. 2021 Feb 19;12(1):1172.
doi: 10.1038/s41467-021-21344-8.

20S proteasomes secreted by the malaria parasite promote its growth

Affiliations

20S proteasomes secreted by the malaria parasite promote its growth

Elya Dekel et al. Nat Commun. .

Abstract

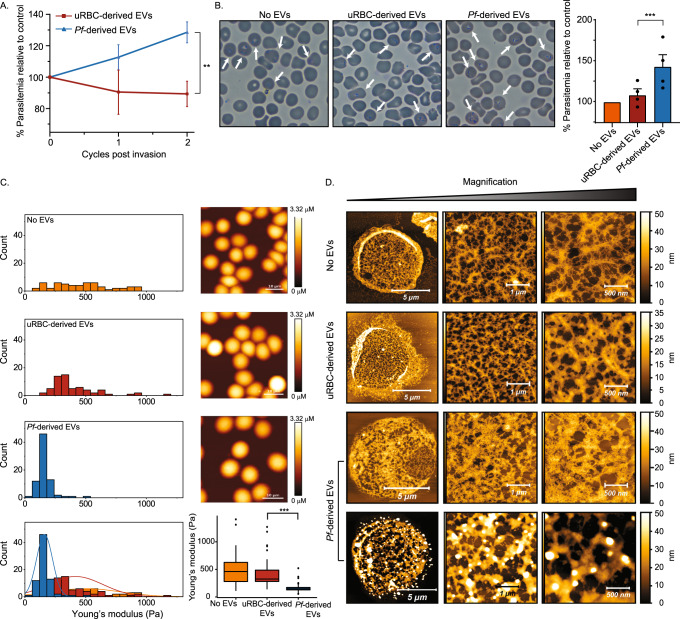
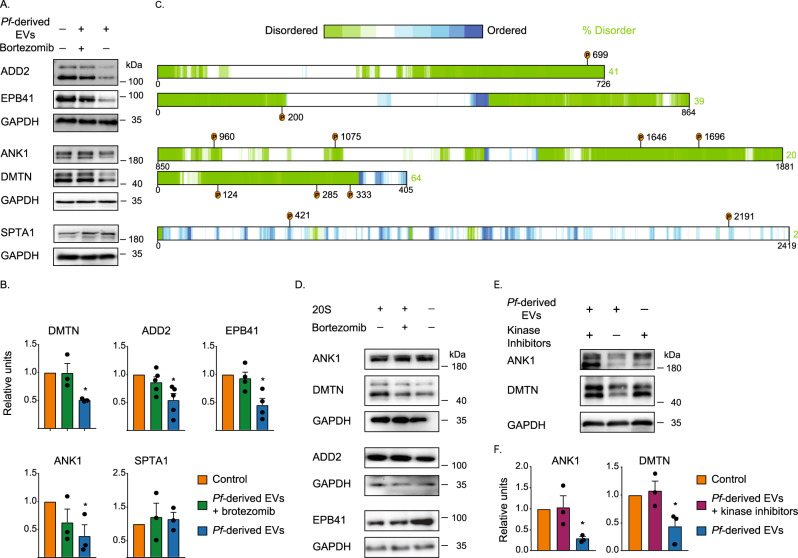
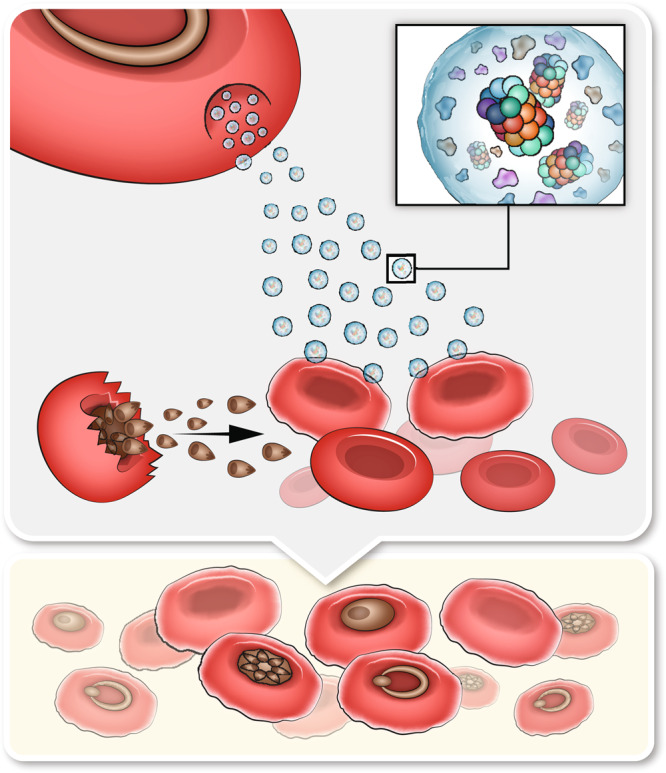
Mature red blood cells (RBCs) lack internal organelles and canonical defense mechanisms, making them both a fascinating host cell, in general, and an intriguing choice for the deadly malaria parasite Plasmodium falciparum (Pf), in particular. Pf, while growing inside its natural host, the human RBC, secretes multipurpose extracellular vesicles (EVs), yet their influence on this essential host cell remains unknown. Here we demonstrate that Pf parasites, cultured in fresh human donor blood, secrete within such EVs assembled and functional 20S proteasome complexes (EV-20S). The EV-20S proteasomes modulate the mechanical properties of naïve human RBCs by remodeling their cytoskeletal network. Furthermore, we identify four degradation targets of the secreted 20S proteasome, the phosphorylated cytoskeletal proteins β-adducin, ankyrin-1, dematin and Epb4.1. Overall, our findings reveal a previously unknown 20S proteasome secretion mechanism employed by the human malaria parasite, which primes RBCs for parasite invasion by altering membrane stiffness, to facilitate malaria parasite growth.


Conflict of interest statement

The authors declare no competing interests.

Figures

Fig. 1
Fig. 1. Pf-derived EV treatment influences growth dynamics and morphology of naïve RBCs.
A, B Pf-derived EVs were incubated for 18 hr with naïve RBCs. Magnet-purified Pf were then introduced to the treated cells and the parasitemia level was monitored (estimated comparing to the untreated control) using flow cytometry (A) and Giemsa smears (B). Treatment with uRBC-derived EVs or the absence of EVs were used as controls. A Averages and statistical significance for at least three independent experiments were calculated by comparing percentages (relative to control) between treatments with a 2-way ANOVA, accounting for treatment and batch (uRBC-derived EVs 1st cycle n = 3, Pf-derived EVs 1st cycle n = 9, uRBC-derived EVs 2nd cycle n = 4, Pf-derived EVs 2nd cycle n = 12, **p = 0.00416). Error bars represent SEM (standard error of the mean). B The arrows indicate Pf-iRBCs. Scale bars represent 10 μm. Averages and statistical analysis of four independent experiments, in which counts were compared between treatments using a mixed GLM, assuming a binomial distribution, with a random intercept for batch (***p = 0.0008). Error bars represent SEM. C Mechanical changes of the recipient naïve RBCs following the Pf-derived EV treatment. Distributions of Young’s modulus values were obtained from AFM measurements (left panel), each count in the histogram represents the average value calculated from 25 indentations near the center of each cell. AFM images of the EV-treated and -untreated RBCs are shown on the right panel (scale bar 10 µm). Differences between groups shown in the box plot were tested with a one-way ANOVA, followed by Tukey’s post-hoc test. Boxes represent the 25-75 percentiles of the sample distribution, with black vertical lines representing the 1.5×IQR (interquartile range). The black dots represent outliers. Black horizontal line represents the median. Log-transformed data was used due to the mean-variance correlation. Three independent experiments, each comparing naïve RBCs, uRBC-derived EV and Pf-derived EV exposure, were performed with total of 15 full images acquired for each of the cell exposure conditions. Number of cells measured were for No EVs n = 57, uRBC-derived EVs n = 63, Pf-derived EVs n = 77, ***p < 0.001). D Representative AFM images of cytoskeletal structures of naïve RBCs, naïve RBCs incubated with either uRBC-derived or Pf-derived EVs. The sharp fibrilar network assigned to spectrin filaments seen in the upper frames breaks down and becomes blurred and disconnected in the lower frames. Three independent experiments were performed, with a total of 50 AFM scans for each type of cell treatment. AD Results are representative of at least three independent biological replicates. Source data for A and B are provided in Supplementary Fig. S2.
Fig. 2
Fig. 2. Pf-derived EVs are enriched with kinases and proteasome subunits.
Gene Ontology (GO) cellular components enrichment analysis of Pf-derived EV protein cargo. Vesicles were harvested and proteins were extracted and subjected to cellular components analysis following LC-MS/MS proteomic identification. The horizontal bar graph shows the fold enrichment of significantly enriched A Pf and D human proteins. Results are based on GO cellular component enrichment analysis of all identified proteins against the background of D Homo sapiens and A Plasmodium falciparum (http://geneontology.org/; p-value < 0.05, FDR < 0.01). Lists of identified Pf and human (B and E) kinases and proteasome subunits (C and F). G Phosphoproteomics analysis of uRBCs treated with Pf-derived EVs. Identified proteins were subjected to GO Biological Processes analysis (FDR < 0.00035). Statistical analyses in A and D were done using PANTHER Statistical Overrepresentation Test (Released 2019-07-11). Annotation versions and release date: GO Ontology database (Released 2019-10-08), PANTHER version 15 (Released 2020-02-14). Analyzed lists: Homo sapiens or Plasmodium falciparum Proteins IDs (Uniprot Accessions are listed in Table S1A, S1B). Reference list: Homo sapiens or Plasmodium falciparum (all genes in database). Test Type: FISHER, applying FDR correction, p < 0.05.
Fig. 3
Fig. 3. The 20S proteasome is assembled and functional within Pf-derived EVs.
A Western blot analysis of the different fractions separated by OptiPrep velocity gradient centrifugation. Anti-PSMA1 antibody was used to probe the 20S proteasome complex, and anti-PSMD1 was used to identify the 19S particle. As a positive control, antibodies against the EV markers HSP90 and SR1 were used. This experiment was repeated independently three times with similar results. B Proteasome proteolytic activity measurement of Pf-derived EVs with the fluorescent peptide Suc-LLVY-AMC. As a control, uRBC-derived EVs were used. The data was normalized with respect to background levels of fluorescence in the presence of the proteasome inhibitor MG132. Averaging and statistical analysis were performed on three biological replicates using two tailed t-test assuming unequal variances. Error bars represent SD (standard deviation) (**p = 0.0032). C To validate the integrity and activity of the proteasome complex, uRBC-derived, and Pf-derived EVs were lysed and separated using 4% native-PAGE. The activity of the proteasome complexes was analyzed by incubating the gels with the fluorescent peptide substrate Suc-LLVY-AMC (left panel). Quantifications demonstrates the average of five independent biological replicates subjected to paired two-way t-test analysis using log-transformed measurements (*p = 0.028). Error bars represent SEM. The relative abundance of the complexes was assessed by Western blot analysis of the native gel (right panel, showing a representative gel from three independently repeated experiments with similar results.) using an anti-PSMA1 antibody. Samples of RBC lysate and purified 20S proteasome were used as controls. D Naïve RBCs were incubated with EVs purified from Pf-iRBCs or from uRBC cultures; samples were then lysed and separated using 4% native-PAGE and incubated with the fluorescent peptide (left panel) for activity analysis. Band intensity quantifications of five independent experiments were subjected to averaging and paired t-test analysis (*p = 0.021). Error bars represent SEM. Western blot of the native gel (right panel), using an anti-PSMA1 antibody. Samples of uRBCs and uRBCs treated with EVs derived from naïve RBCs were used as controls. E Denaturing gel of the samples analyzed in D. Anti-PSMA1 was used to probe the 20S proteasome, and anti-PSMD1 was used to probe the 19S complex. Glyceraldehyde-3-phosphate dehydrogenase (GAPDH) was used as a loading control. All images are representatives of three independent repeats (see Supplementary Fig. S9). F Parasite growth curve in EV-treated RBCs following incubation with Pf-derived EVs with or without the proteasome inhibitor bortezomib. Average and statistical significance was calculated for at least three independent experiments by comparing percentages (relative to control) between treatments with a two-way ANOVA, accounting for treatment and batch (No EVs n = 3, Pf-derived EVs n = 7, Pf-derived EVs + bortezomib N = 7), **p = 0.0015). Error bars represent SEM. Source data are provided in Supplementary Fig. S7 and in the source data file.
Fig. 4
Fig. 4. EV-20S proteasomes modulate the mechanical properties of RBCs.
A Mechanical changes measured by AFM following Pf-derived EV incubation with naïve RBCs. Pf-derived EVs or Pf-derived EVs pretreated with proteasome inhibitor (bortezomib) were incubated with naïve RBCs. Pretreated cells were deposited on a mica surface for AFM topography and mechanical measurements. Distributions of Young’s modulus values shown in the left panel, each count in the histogram represents data from a separate indentation, nine different positions were measured near the center of each cell. Representative AFM images are shown in the right panel (scale bar 10 µm). B Superposition of the Young’s modulus distribution (left panel) and box plot of the average value from the four different experiments (right panel). Boxes represent the 25–75 percentiles of the sample distribution, with black vertical lines representing the 1.5 × IQR (interquartile range). The black dots represent outliers. Black horizontal line represents the median. Significance was calculated using one-way ANOVA, followed by a Tukey post hoc test. For A and B three independent experiments were performed, each comparing naïve RBCs, and naïve RBCs treated with Pf-derived EVs in the presence or absence of bortezomib, with total of 15 full images acquired for each condition. Number of cells measured were for No EVs n = 86, Pf-derived EVs n = 103, Pf-derived EVs + bortezomib n = 95, p < 0.001. C Representative AFM images recorded in air showing the cytoskeletal structures of naïve RBCs, naïve RBCs treated with Pf-derived EVs in the presence or absence of bortezomib. Three independent experiments were performed, with a total of 50 AFM scans for each type of cell treatment. D Demonstration of the CNN analysis discrimination. Two examples are shown for each cytoskeleton phenotype: uRBCs on the left, RBCs exposed to Pf-derived EVs without and with bortezomib treatment in the center and right, respectively. Top row shows AFM images and bottom row the class activation maps whereby discriminatory regions are red/yellow and uncorrelated or anti-correlated regions blue/green. Discriminatory regions are marked and labeled to guide the eye. It is clear that the “hole” regions are associated with healthy untreated RBC and RBC treated with Pf-derived EV and bortezomib and the “backbone” regions with the RBC affected with Pf-derived EVs. E CNN prediction, showing analysis made on the control set of naïve RBCs, and naïve RBCs treated with Pf-derived EVs in the presence or absence of bortezomib (proteasome inhibitor). The x-axis represents the probability for an image to resemble the uRBC control. The y axis represents the number of images in the analysis for a class type (untreated RBC, Pf-derived EV-treated RBC, and RBC treated with Pf-derived EV and bortezomib) which conforms to a given probability. The no EV and Pf-derived EV data is from the testing set.
Fig. 5
Fig. 5. RBC cytoskeleton proteins are target substrates of the EV-20S proteasome.
A Degradation of cytoskeletal proteins following Pf-derived EV treatment. Western blot analysis of naïve RBCs treated with Pf-derived EVs in the presence or absence of the proteasome inhibitor bortezomib. Commercial antibodies were used against five cytoskeletal proteins: β-adducin (ADD2), erythrocyte membrane protein band 4.1 (EPB4.1), ankyrin-1 (ANK1), dematin (DMTN), and spectrin α−chain (SPTA1). For each gel, GAPDH was used as a loading control. B Quantification and averaging of three independent experiments (as in A). Each protein’s value was divided by the control value for that batch, thus creating a pair of ratios for each batch. The ratios of Pf-derived EVs were tested against the ratios of the Pf-derived EVs + bortezomib using a paired two-way t-test, error bars represent SD (DMTN *p = 0.0102, ADD2 *p = 0.01339, EPB41 *p = 0.02769, ANK *p = 0.01339). C Graphical illustration of the disorder prediction of human β-adducin, Ebp4.1, ankyrin-1, dematin, and spectrin α−chain, generated by D2P2 (website: http://d2p2.pro), a database of protein disorder predictions. The level of disorder prediction is shown as a color intensity in which green segments represent disordered regions. The position of the unique phosphosites following treatment with Pf-derived EVs is indicated by orange circles. D Degradation assay of ghost naïve RBCs with purified 20S proteasome complexes. Bortezomib was used as a control for 20S proteasome inhibition. Panels display immunoblots using the relevant antibodies. Results represent three independent experiments (Supplementary Fig. S16). E Degradation of cytoskeletal proteins following Pf-derived EV treatment in the presence of kinase inhibitors mixture. Western blot analysis for naïve RBCs that were treated with Pf-derived EVs in the presence or absence of kinase inhibitor mixture (staurosporine and dihydrochloride). Antibodies were used against ankyrin-1 and dematin. GAPDH was used as a loading control (Supplementary Fig. S17). F Quantification and averaging of three independent experiments (as in E), using a paired two-way t-test, error bars represent SD (ANK *p = 0.0421, DMTN *p = 0.0402). Source data for A and D are provided in the source data file. Source data for B and F are provided in Supplementary Fig. S14.
Fig. 6
Fig. 6. Pf-derived EVs prime naïve host RBCs to enhance parasite growth.
Diagram demonstrating the impact of Pf-derived EVs on naïve RBCs. Our results indicate that EVs enriched with active proteasome complexes and protein kinases invade naïve host RBCs. This process leads to the phosphorylation and subsequent degradation of RBC cytoskeleton proteins. Consequently, the cytoskeleton network of the recipient naïve RBC is disrupted and the cell membrane is remodeled, improving the invasive capacity of the malaria parasite.

References

    1. Lasch J, Kullertz G, Opalka JR. Separation of erythrocytes into age-related fractions by density or size? Counterflow centrifugation. Clin. Chem. Lab Med. 2000;38:629–632. doi: 10.1515/CCLM.2000.092. - DOI - PubMed
    1. Pretini V, et al. Red blood cells: chasing interactions. Front. Physiol. 2019;10:945. doi: 10.3389/fphys.2019.00945. - DOI - PMC - PubMed
    1. Boulet C, Doerig CD, Carvalho TG. Manipulating eryptosis of human red blood cells: a novel antimalarial strategy? Front. Cell. Infect. Microbiol. 2018;8:419. doi: 10.3389/fcimb.2018.00419. - DOI - PMC - PubMed
    1. Frontiers Production, O. Erratum: manipulating eryptosis of human red blood cells: a novel antimalarial strategy? Front. Cell. Infect. Microbiol. 2018;8:455. doi: 10.3389/fcimb.2018.00455. - DOI - PMC - PubMed
    1. Huisjes R, et al. Squeezing for life - properties of red blood cell deformability. Front. Physiol. 2018;9:656. doi: 10.3389/fphys.2018.00656. - DOI - PMC - PubMed

Publication types

MeSH terms

Substances