. 2021 Feb 19;12(1):1151.
doi: 10.1038/s41467-021-21407-w.

Single-cell RNA sequencing reveals functional heterogeneity of glioma-associated brain macrophages

Affiliations

Single-cell RNA sequencing reveals functional heterogeneity of glioma-associated brain macrophages

Natalia Ochocka et al. Nat Commun. .

Abstract

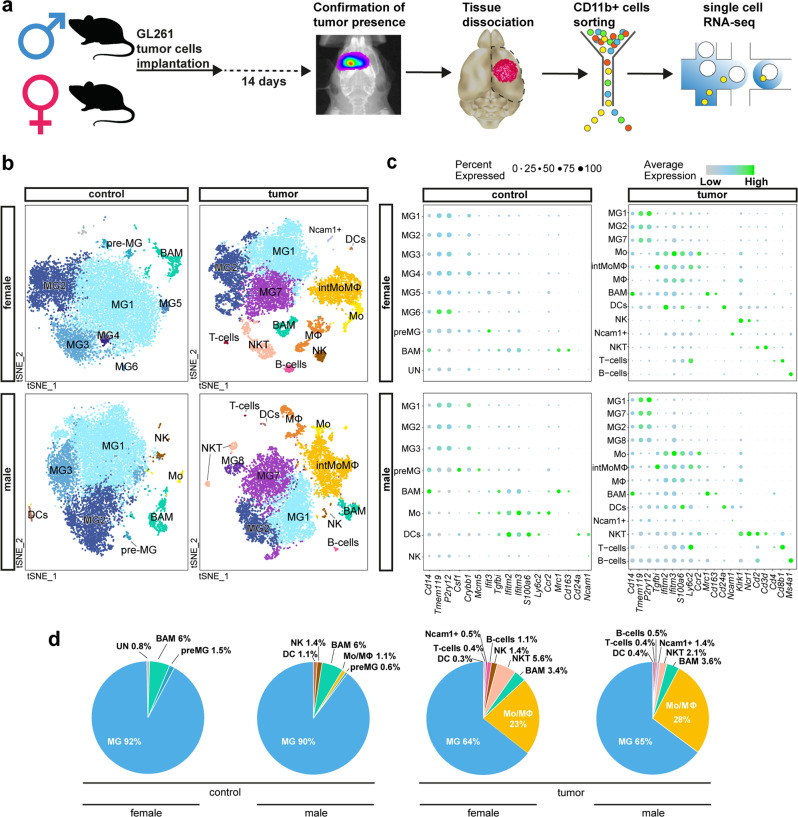
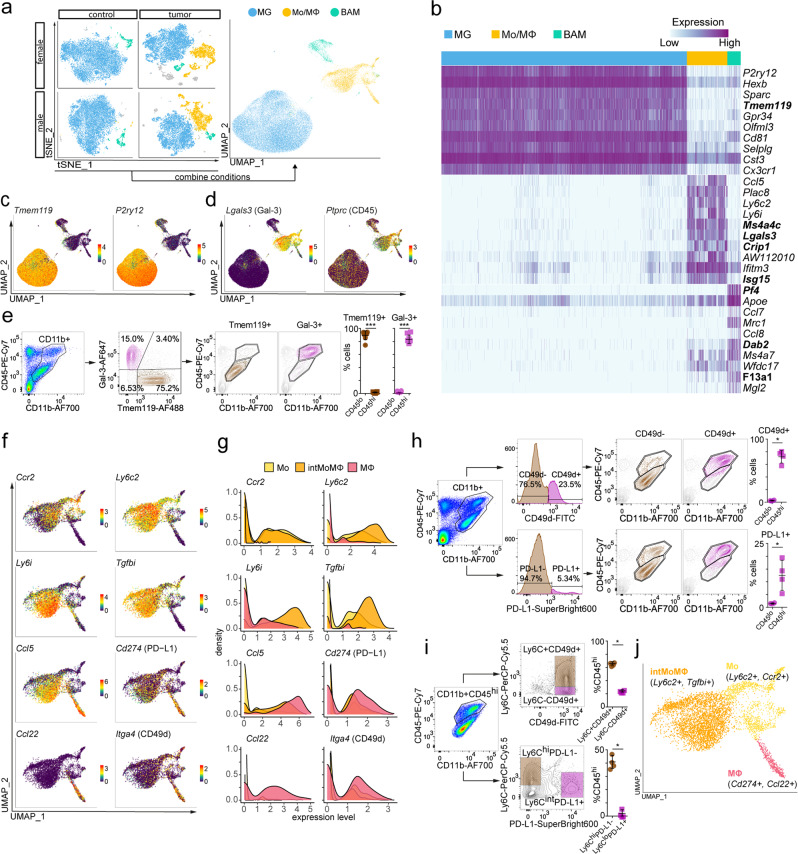
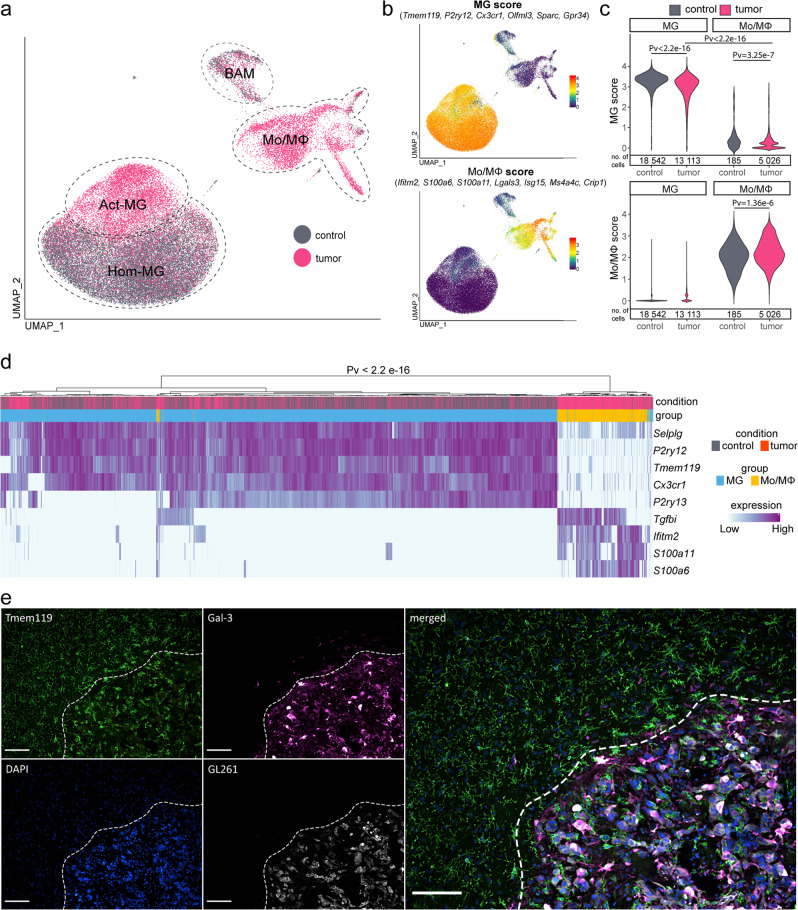
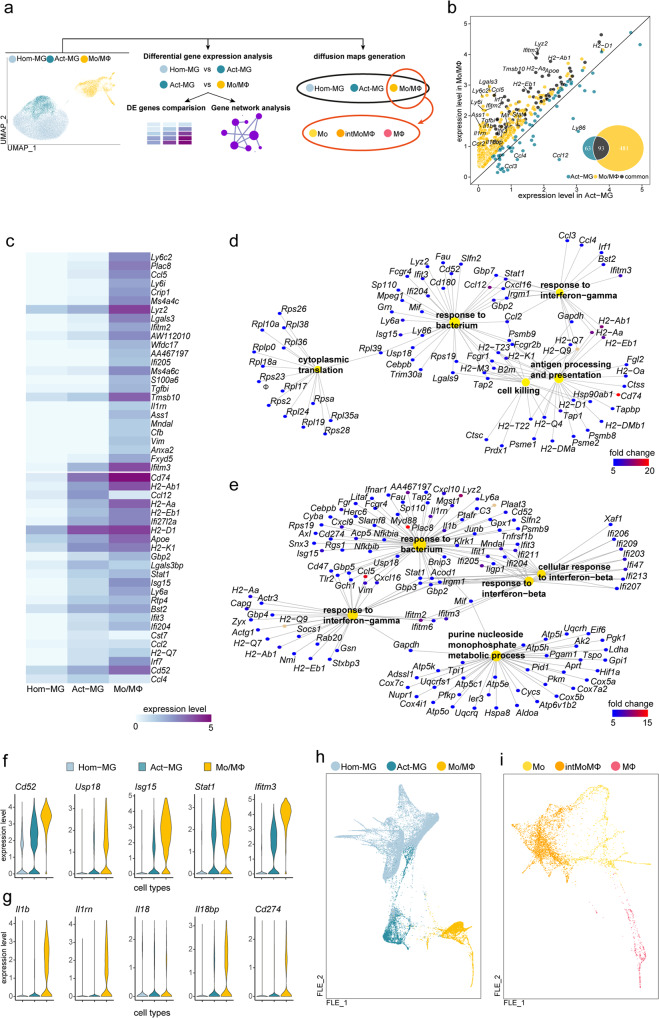
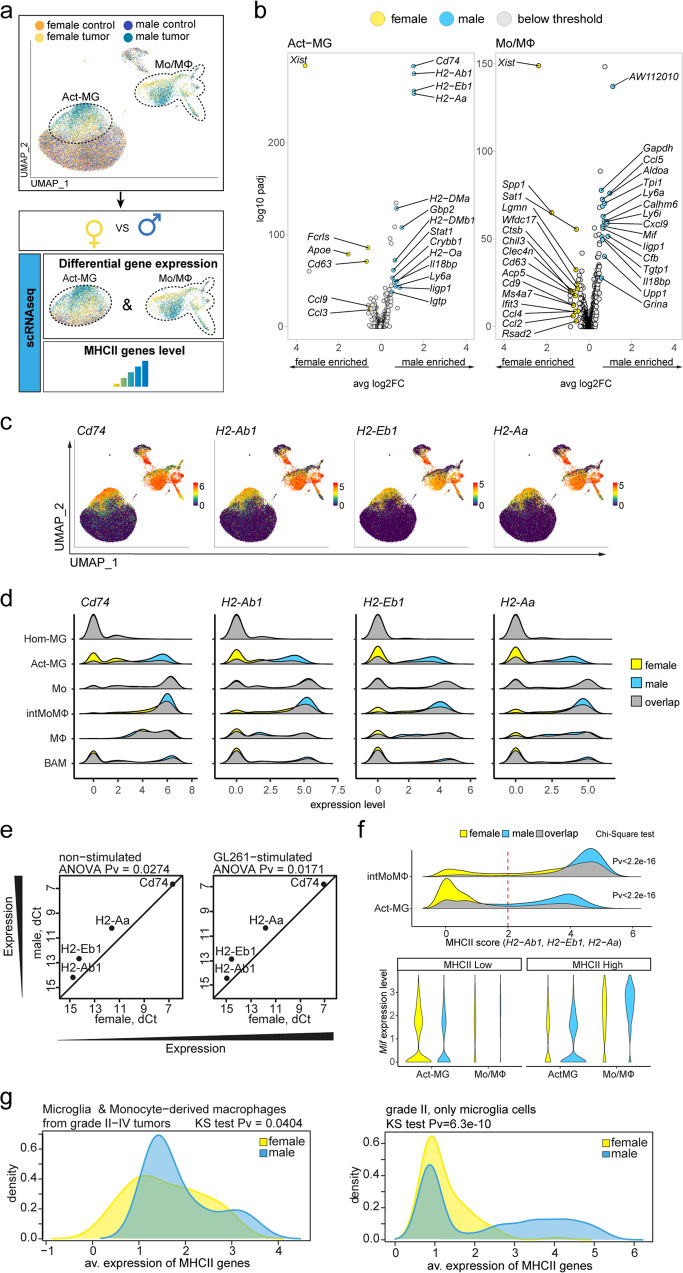
Microglia are resident myeloid cells in the central nervous system (CNS) that control homeostasis and protect CNS from damage and infections. Microglia and peripheral myeloid cells accumulate and adapt tumor supporting roles in human glioblastomas that show prevalence in men. Cell heterogeneity and functional phenotypes of myeloid subpopulations in gliomas remain elusive. Here we show single-cell RNA sequencing (scRNA-seq) of CD11b+ myeloid cells in naïve and GL261 glioma-bearing mice that reveal distinct profiles of microglia, infiltrating monocytes/macrophages and CNS border-associated macrophages. We demonstrate an unforeseen molecular heterogeneity among myeloid cells in naïve and glioma-bearing brains, validate selected marker proteins and show distinct spatial distribution of identified subsets in experimental gliomas. We find higher expression of MHCII encoding genes in glioma-activated male microglia, which was corroborated in bulk and scRNA-seq data from human diffuse gliomas. Our data suggest that sex-specific gene expression in glioma-activated microglia may be relevant to the incidence and outcomes of glioma patients.


Conflict of interest statement

The authors declare no competing interests.

Figures

Fig. 1
Fig. 1. Identification of immune cell populations in control and tumor-bearing brain hemispheres.
a Scheme of the experimental workflow. The used brain image was modified from Database Center for Life Science. b t-SNE plot demonstrating clustering obtained for each group (female control, female tumor, male control, and male tumor), two biological replicates were combined. Clusters annotations: MG microglia, preMG premature microglia, Mo monocytes, intMoMΦ intermediate monocyte–macrophage, MΦ macrophages, BAM CNS border-associated macrophages, DCs dendritic cells, Ncam1+ Ncam1-positive cells, NK natural killer cells, NKT natural killer T cells, B cells B lymphocytes, T cells T lymphocytes. c Expression of “signature” genes selected from the immune marker panel for identification of a cluster cell type (Supplementary Table 1). d Pie charts demonstrating distribution of the identified cell types across samples.
Fig. 2
Fig. 2. Transcriptomic characterization of main myeloid subpopulations.
a Projection of cells combined from clusters identified as microglia (MG), monocytes/macrophages (Mo/MΦ), and BAMs from all groups. b Top ten differentially expressed genes for the three main identified cell populations, new marker candidates are in bold. c, d Feature plots depicting genes highly expressed in MG (c) and MoMΦ (d). e Flow cytometric analysis of the distribution of Tmem119 and Gal-3 protein markers within CD11b+ cells and projection of Tmem119+ and Gal-3+ cells onto CD45/CD11b graphs, dot plots demonstrate percentages of Tmem119+ and Gal-3+ cells within CD45hi and CD45lo groups (n = 8, 4 males, and 4 females, two-sided Mann–Whitney U test, mean ± SD, *** < 0.001, Tmem119 Pv = 0.0002, Gal-3 Pv = 0.0002). f Feature plots depicting distribution of the expression of genes discriminating monocytes (Mo), monocyte–macrophage intermediate (intMoMΦ), and macrophage (MΦ) subpopulations. g Density plots demonstrating the expression level of markers discriminating the Mo/MΦ subpopulations. h Flow cytometry analysis of CD49d and PD-L1 proteins within CD11b+ cells and their projection onto CD11b/CD45 graphs, dot plots demonstrate percentages of CD49d+ and PD-L1+ cells within CD45hi and CD45lo groups (n = 4, 2 males, and 2 females; two-sided Mann–Whitney U test, mean ± SD, * < 0.05, CD49d Pv = 0.0286, PD-L1 Pv = 0.0286). i Flow cytometry analysis of the distribution of the markers discriminating Mo/MΦ subpopulations within CD11b+CD45hi cells, dot plots demonstrate percentage of CD11b+CD45hi cells that belong to the defined populations (n = 4, 2 males, and 2 females; two-sided Mann–Whitney U test, mean ± SD, * < 0.05, Ly6C CD49d Pv = 0.0286, Ly6C PD-L1 Pv = 0.0286). j UMAP plot showing clusters of Mo/MΦ subpopulations.
Fig. 3
Fig. 3. Tumor-derived microglia and macrophages form separate cell populations.
a UMAP plots demonstrate the distribution of CD11b+ cells from naive and tumor-bearing mice. b Distribution of MG and Mo/MΦ “signature” gene scores (presented as an average of expression of the selected genes). c Density plots of MG and Mo/MΦ scores across MG and Mo/MΦ populations demonstrating no overlap of a specific “signature” between the two cell populations, two-sided Wilcoxon signed-rank test. d Cell hierarchical clustering according to the expression of reported macrophage markers demonstrating bimodal cell distribution, two-sided Fisher’s exact test. e Immunohistochemical staining for microglia (Tmem119+ and Gal-3) and Mo/MΦ (Tmem119 and Gal-3+) shows the localization of specific immune cells within the tumor and its surroundings in female animal (for male, see Supplementary Fig. 8); a dashed line marks the tumor edge; scale, 100 μm; the staining was performed for three animals, four sections each, a representative image is shown.
Fig. 4
Fig. 4. Functional analysis of glioma-activated microglia in comparison to tumor-infiltrating monocytes/macrophages.
a Scheme of the analytical approach. b Scatter plot depicting expression levels of differentially upregulated genes in Act-MG and Mo/MΦ. c Heatmap showing the comparison of expression of top 25 upregulated genes in Hom-MG vs Act-MG and Act-MG vs Mo/MΦ. d, e Gene Ontology analysis of biological processes for genes upregulated in d Act-MG compared to Hom-MG and e Mo/MΦ compared to the Act-MG. f, g Expression level of selected genes expressed specifically in distinct subpopulations. h, i Visualization of cells projection on two-dimensional FLE (force-directed layout embedding) space.
Fig. 5
Fig. 5. Expression of MHCII and Cd74 genes is more abundant in microglia and monocytes/macrophages from gliomas in males.
a Illustration of the analytical approach. UMAP plot demonstrates the distribution of male and female cells across cell clusters and reveals sex-enriched areas in Act-MG and Mo/MΦ. Differential gene expression analysis was performed for male vs female in Act-MG and Mo/MΦ groups, and expression level of top differentially expressed genes (DEG) verified across all cell groups. b Volcano plots depicting DEG across sexes in Act-MG and Mo/MΦ-infiltrating gliomas. c Expression of the most highly upregulated genes from males. d Density plots show enrichment of male cells in MHCII genes- and Cd74-high expressing populations of Act-MG and intMoMΦ. e Gene expression analysis of MHCII and Cd74 genes in murine primary microglia cocultured with GL261 cells. Gene expression differences determined by qPCR are depicted as dCt, with Actb as a housekeeping gene. f Violin and density plots demonstrate that Mif upregulation is limited to the intMoMΦ MHCIIhi cells; two-sided Chi-Square test. g Distribution of MHCII genes average expression in human data sets. Left panel shows distribution of the MHCII genes level in microglia and monocyte-derived macrophage cells sorted from glioma grades II–IV samples (males n = 5, females n = 3), and right panel in single microglial cells from WHO grade II glioma samples (males n = 5, females n = 2 (refs. ,). Difference between the distribution was assessed with Kolmogorov–Smirnov test.

References

    1. Binnewies M, et al. Understanding the tumor immune microenvironment (TIME) for effective therapy. Nat. Med. 2018;24:541–550. doi: 10.1038/s41591-018-0014-x. - DOI - PMC - PubMed
    1. Qian BZ, Pollard JW. Macrophage diversity enhances tumor progression and metastasis. Cell. 2010;141:39–51. doi: 10.1016/j.cell.2010.03.014. - DOI - PMC - PubMed
    1. Walentynowicz KA, et al. In search for reliable markers of glioma-induced polarization of microglia. Front. Immunol. 2018;9:1–13. doi: 10.3389/fimmu.2018.01329. - DOI - PMC - PubMed
    1. Szulzewsky F, et al. Glioma-associated microglia/macrophages display an expression profile different from M1 and M2 polarization and highly express Gpnmb and Spp1. PLoS ONE. 2015;10:e0116644. doi: 10.1371/journal.pone.0116644. - DOI - PMC - PubMed
    1. Szulzewsky F, et al. Human glioblastoma-associated microglia/monocytes express a distinct RNA profile compared to human control and murine samples. Glia. 2016;64:1416–1436. doi: 10.1002/glia.23014. - DOI - PubMed

Publication types

MeSH terms

Substances