. 2021 Feb 19;12(1):1198.
doi: 10.1038/s41467-021-21263-8.

The evolution of critical thermal limits of life on Earth

Affiliations

The evolution of critical thermal limits of life on Earth

Joanne M Bennett et al. Nat Commun. .

Abstract

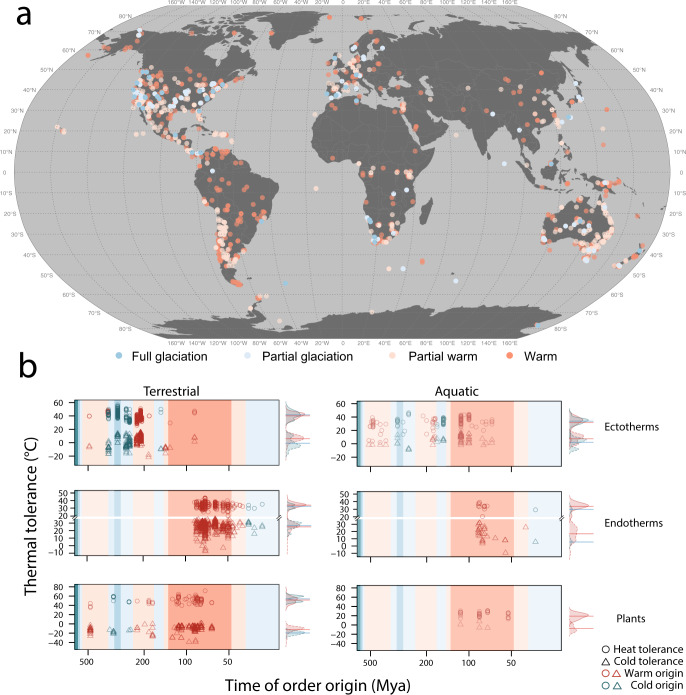
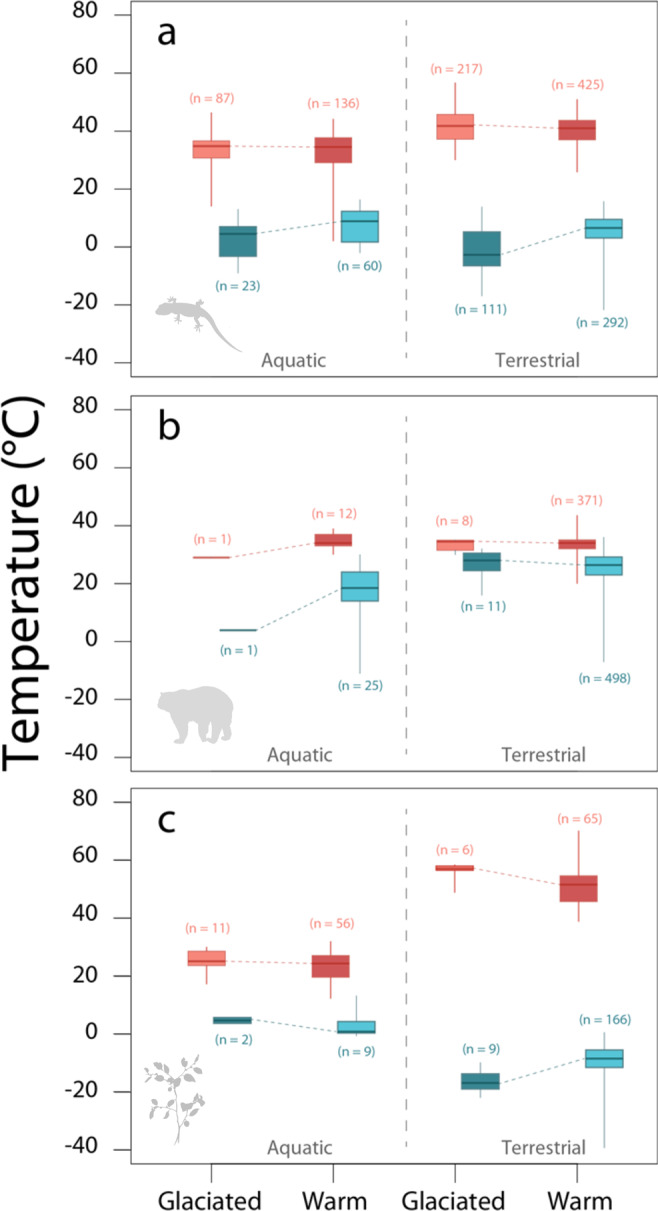
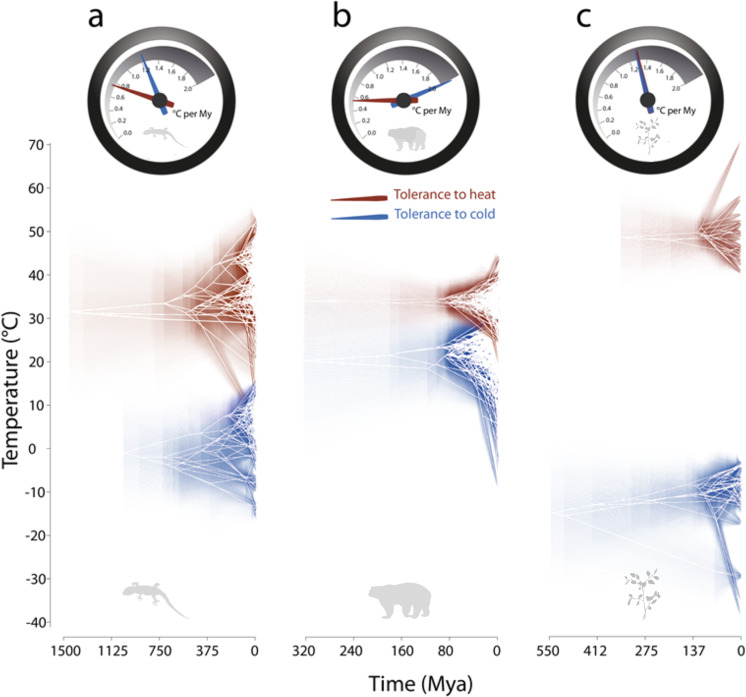
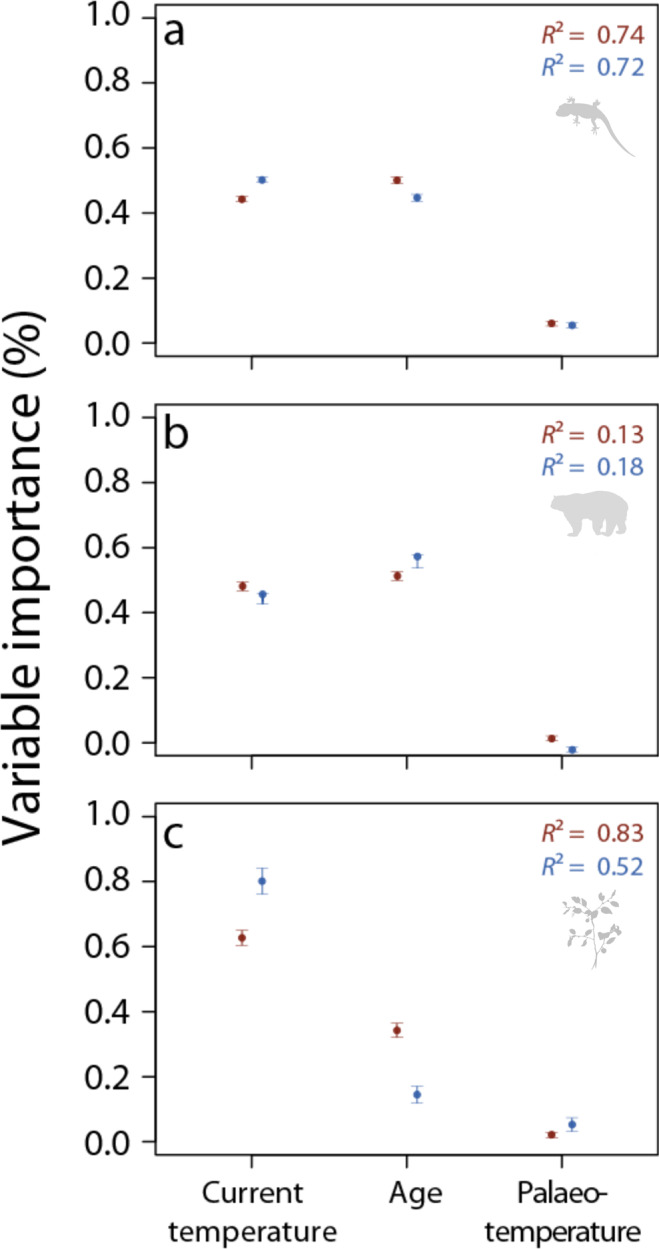
Understanding how species' thermal limits have evolved across the tree of life is central to predicting species' responses to climate change. Here, using experimentally-derived estimates of thermal tolerance limits for over 2000 terrestrial and aquatic species, we show that most of the variation in thermal tolerance can be attributed to a combination of adaptation to current climatic extremes, and the existence of evolutionary 'attractors' that reflect either boundaries or optima in thermal tolerance limits. Our results also reveal deep-time climate legacies in ectotherms, whereby orders that originated in cold paleoclimates have presently lower cold tolerance limits than those with warm thermal ancestry. Conversely, heat tolerance appears unrelated to climate ancestry. Cold tolerance has evolved more quickly than heat tolerance in endotherms and ectotherms. If the past tempo of evolution for upper thermal limits continues, adaptive responses in thermal limits will have limited potential to rescue the large majority of species given the unprecedented rate of contemporary climate change.


Conflict of interest statement

The authors declare no competing interests.

Figures

Fig. 1
Fig. 1. A map illustrating the geographic location at which experimental specimens were collected and plots of the relationship between order age and thermal tolerance limits.
Map points (a) and the plot area shading (b) are coloured according to the prevailing paleoclimate at order origin (see Supplementary Fig. 2) full glaciation (blue), partial glaciation (light blue), partial warm (light orange) and warm (orange). b The raw relationships between order age in million years (mya) and lower (triangles) and upper (circles) thermal tolerance limits for ectotherms, endotherms and plants. Points (b) are coloured red for species in warm origin orders (partial warm and warm palaeoclimate categories as shown in the map) and blue for species in cold origin orders (full and partial glaciation palaeoclimate categories as shown in the map). For endotherms only (b), the axis is broken so that upper and lower thermal limits can be clearly delineated. Density distributions of upper and lower thermal tolerance limits are shown to the right of each panel b, aggregated by time of origin, following the same colour scheme as above, lines correspond to medians. Source data are provided as a Source Data file.
Fig. 2
Fig. 2. Test of the effect of deep-time climate legacies.
The boxplots compare the distributions of upper (red) and lower (blue) thermal tolerance of species belonging to orders of terrestrial and aquatic (a) ectotherms, (b) endotherms and (c) plants (photosynthetic plants and macroalgae). Dark colours reflect the palaeoclimatic conditions of order origination expected to show either lower values in lower thermal limits (darker blue for species belonging to orders originated under glaciated palaeoclimates—data from partial glaciated and glaciated paleoclimate categories combined) or higher values in upper thermal limits (darker red for species belonging to orders originated under warm non-glaciated palaeoclimates—warm and partial warm paleoclimate categories combined). For details on data collection see Supplementary Note 1. Boxes are bounded within the first and third quartiles, medians represented by thick horizontal lines within each box and, whiskers extending to the minimum and maximum values that do not exceed 1.5 times the interquartile range from the median (provided by default in R function ‘boxplot’). Source data are provided as a Source Data file.
Fig. 3
Fig. 3. Tempo and mode of evolution of thermal tolerance limits.
Tempo and mode of evolution of upper (red) and lower (blue) thermal tolerance limits of a ectotherms, b endotherms and c plants (photosynthetic plants and macroalgae). The top velocimeters illustrate the rate of evolution as measured by σ². Estimates of σ² are computed as the average between the results for the smoothed and unsmoothed phylogenetic trees in ref. . Sample sizes and details on the uncertainty around the estimates are supplied in Supplementary Tables 2–4 and see Supplementary Note 2. The bottom traitgrams together with the uncertainty about ancestral character states shown by increasing transparency illustrate the phenotypic change along evolutionary time.
Fig. 4
Fig. 4. The importance of experienced contemporary climate, clade evolutionary age and palaeoclimatic origin in predicting thermal limits.
Variable importance in random forest models fitting the relationships between upper (red) and lower (blue) thermal limits and predictors including palaeoclimatic origin (palaeo-temperature), experienced contemporary climate (current temperature) and clade evolutionary age (age) for a ectotherms, b endotherms, c plants (combing data from aquatic and terrestrial realms). Average model accuracy (R²) is reported for each model subset. Error bars represent 95% confidence intervals. For source data and sample sizes see Supplementary Table 5 and Supplementary Note 3.

References

    1. Webb TJ. Marine and terrestrial ecology: unifying concepts, revealing differences. Trends Ecol. Evol. 2012;27:535–541. doi: 10.1016/j.tree.2012.06.002. - DOI - PubMed
    1. Calosi P, Bilton DT, Spicer JI, Votier SC, Atfield A. What determines a species’ geographical range? Thermal biology and latitudinal range size relationships in European diving beetles (Coleoptera: Dytiscidae) J. Anim. Ecol. 2010;79:194–204. doi: 10.1111/j.1365-2656.2009.01611.x. - DOI - PubMed
    1. Sunday JM, Bates AE, Dulvy NK. Thermal tolerance and the global redistribution of animals. Nat. Clim. Chang. 2012;2:686–690. doi: 10.1038/nclimate1539. - DOI
    1. Wiens JJ, et al. Niche conservatism as an emerging principle in ecology and conservation biology. Ecol. Lett. 2010;13:1310–1324. doi: 10.1111/j.1461-0248.2010.01515.x. - DOI - PubMed
    1. Huey RB, et al. Predicting organismal vulnerability to climate warming: roles of behaviour, physiology and adaptation. Philos. Trans. R. Soc. B. 2012;367:1665–1679. doi: 10.1098/rstb.2012.0005. - DOI - PMC - PubMed

Publication types

LinkOut - more resources