. 2021 Feb 19;12(1):1146.
doi: 10.1038/s41467-021-21280-7.

GWAS of peptic ulcer disease implicates Helicobacter pylori infection, other gastrointestinal disorders and depression

Affiliations

GWAS of peptic ulcer disease implicates Helicobacter pylori infection, other gastrointestinal disorders and depression

Yeda Wu et al. Nat Commun. .

Abstract

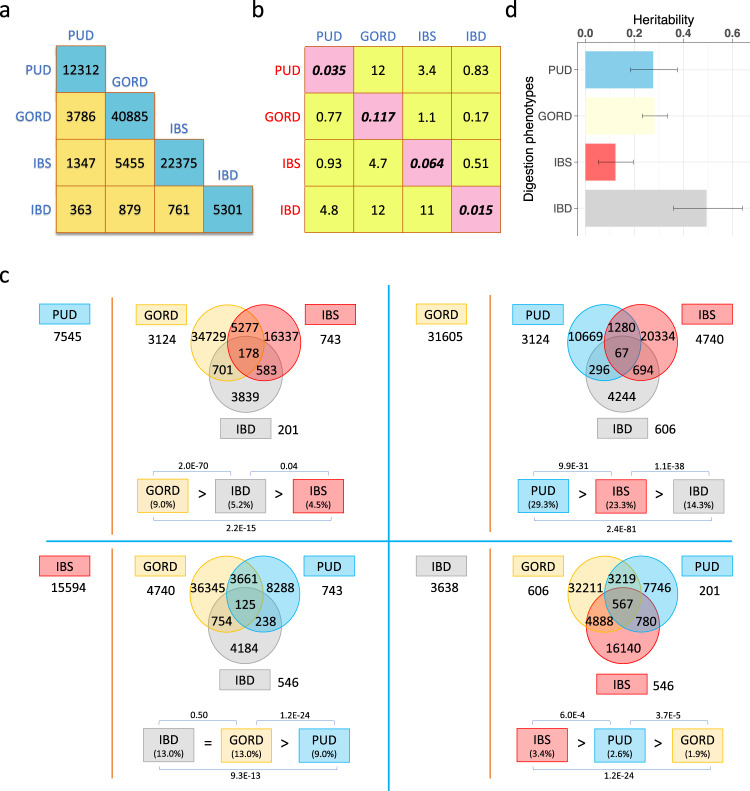
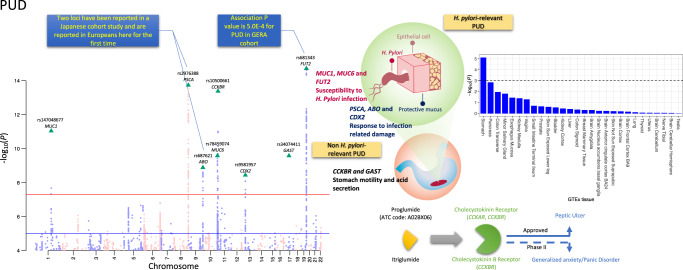
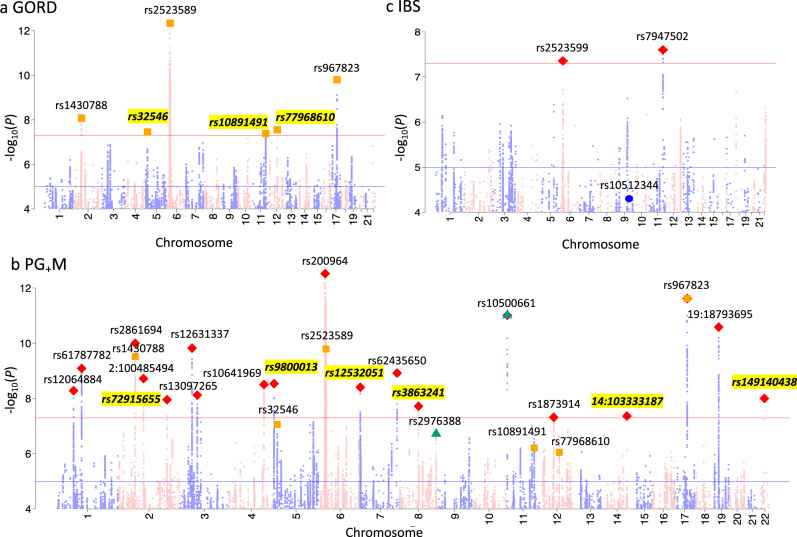
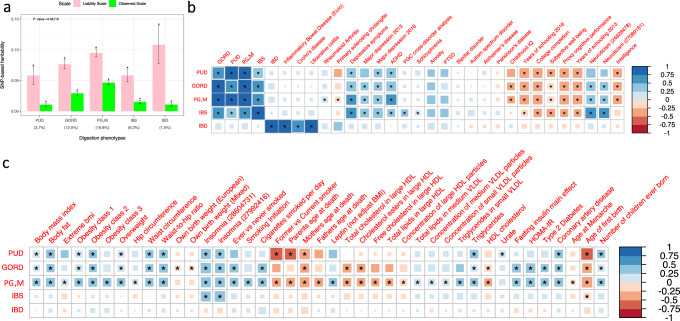
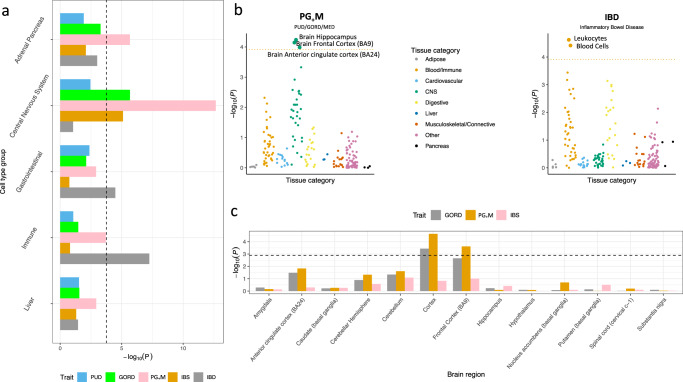
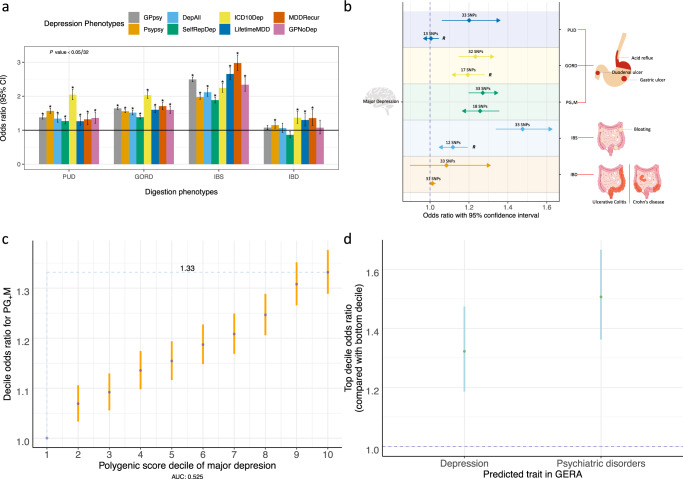
Genetic factors are recognized to contribute to peptic ulcer disease (PUD) and other gastrointestinal diseases, such as gastro-oesophageal reflux disease (GORD), irritable bowel syndrome (IBS) and inflammatory bowel disease (IBD). Here, genome-wide association study (GWAS) analyses based on 456,327 UK Biobank (UKB) individuals identify 8 independent and significant loci for PUD at, or near, genes MUC1, MUC6, FUT2, PSCA, ABO, CDX2, GAST and CCKBR. There are previously established roles in susceptibility to Helicobacter pylori infection, response to counteract infection-related damage, gastric acid secretion or gastrointestinal motility for these genes. Only two associations have been previously reported for duodenal ulcer, here replicated trans-ancestrally. The results highlight the role of host genetic susceptibility to infection. Post-GWAS analyses for PUD, GORD, IBS and IBD add insights into relationships between these gastrointestinal diseases and their relationships with depression, a commonly comorbid disorder.


Conflict of interest statement

The authors declare no competing interests.

Figures

Fig. 1
Fig. 1. Comorbidity analyses in unrelated European individuals and heritability estimation based on full-sibling relative risk for PUD, GORD, IBS, and IBD.
a The number of unrelated individuals with each diagnosis (cyan boxes) and the number of overlapped individuals between each pair of PUD, GORD, IBS, and IBD cases (yellow boxes). These differ from Table 1 because only unrelated individuals are considered here. b Cells represent ratio of the odds of disease cases from each column in those with disease from each row and the odds of each row disease cases in unrelated European-ancestry individuals. The diagonal elements are the sample risk rates and differ from “N case/(N case + N control)” in Table 1 because only unrelated individuals are included here. c Competitive comorbidity analyses for each of PUD, GORD, IBS, and IBD disease (defined, in turn, as index disease) to test among the other three diseases which disease is more prone to be comorbid with the index disease. The disease on the left of the red dashed line is the index disease and the number shows the number of cases without any comorbidity. The corresponding Venn diagram shows the number of individuals with recorded or self-report diagnosis with at least one of the other three diseases. The numbers outside of the Venn diagrams are the numbers of individuals with diagnosis of both the index disease and each of the other three diseases in turn, after removing the overlapped individuals for these three diseases. At the bottom of each Venn diagram is the proportion of the index disease cases in the other three diseases respectively, compared in pairs using a two-proportion Z test to test which disease is more prone to be comorbid with the index disease. d Heritability estimates and 95% confidence interval for PUD, GORD, IBS, and IBD based on full-sibling relative risk. See the Supplementary Note 1 for an example explaining b, c.
Fig. 2
Fig. 2. Manhattan plot of peptic ulcer disease (PUD) for SNPs associated P < 1.0E−4 from BOLT-LMM association test.
SNPs highlighted with green triangles are independent loci with P < 5.0E−8. rs2976388 and rs687621 are the only two loci associated with duodenal ulcer in a Japanese cohort and rs681343 showed statistically significant association in GERA PUD GWAS, as annotated in the blue box. SNPs on odd/even chromosomes are presented in mauve/pink. Schematic diagram on the right side represents the reported biological evidence supporting involvement in peptic ulcers of genes physically located near PUD-associated loci (noting that we do not have direct evidence to link the associated SNPs with the genes). MUC1, MUC6, and FUT2 have been linked to susceptibility to H. pylori infection and PSCA and ABO have been proposed to be associated with subsequent response after infection. Induced/enhanced CDX2 expression as a result of H. pylori infection of gastric epithelial cell lines has been observed. GAST encodes gastrin, which is a hormone whose main function is to stimulate secretion of hydrochloric acid by the gastric mucosa. CCKBR encodes cholecystokinin receptor which mediates a therapeutic effect for peptic ulcer treatment by reducing acid secretion and inhibiting gastrointestinal motility. The cholecystokinin receptor is also an effect-mediating target of itriglumide on phase II clinical trial for anxiety and panic disorder. Using the GENE2FUNC of FUMA pipeline, we found that the eight annotated genes are highly overexpressed in human stomach tissue from GTEx 8th version data, as shown in the bar plot on the right side with data presented in Supplementary Data 2. The dashed line represents Bonferroni corrected significance at −log10(0.05/54).
Fig. 3
Fig. 3. Manhattan plot of gastroesophageal reflux disease (GORD), peptic ulcer disease, GORD and corresponding medications (PG+M) and irritable bowel syndrome (IBS) for SNPs associated P < 1.0E−4 from BOLT-LMM association test.
a GORD: SNPs highlighted with orange squares are genome-wide statistically significant (P < 5.0E−8) independent loci, which correspond to the orange squares in b. SNPs highlighted with yellow represent loci that have not previously been reported to be associated with GORD. b PG+M: SNPs highlighted with red diamond are independent loci with P < 5.0E−8. Only two of eight SNPs associated with peptic ulcer disease (highlighted with green triangles) are with P < 1.0E−5 in PG+M and all the SNPs associated with GORD (highlighted with orange squares) have P < 1.0E−5 in PG+M. SNPs highlighted with yellow represent loci that have not previously been reported to be associated with GORD. c IBS: SNPs highlighted with red diamond are independent loci with P < 5.0E−8. The blue dot is for rs10512344 that has been reported associated with female IBS in UKB previously released data. The IBD Manhattan plot is found in Supplementary Fig. 2.
Fig. 4
Fig. 4. SNP-based heritability and genetic correlation analyses for the five digestion phenotypes from LD score regression analyses.
a SNP-based heritability of the five digestion phenotypes both on the observed and liability scales. The transformation to the liability scale uses the UKB sample risk, i.e., the proportion cases in the UKB cohort, as the population lifetime risk; the sample risk percentage of whole UKB European ancestry is shown below the x-axis in parentheses. The error bars represent 95% confidence interval for the estimated SNP-based heritability. “*” represents that the SNP-based heritability P value remain significant after Bonferroni correction (P < 0.05/10). b, c Results for genetic correlation within-digestion phenotypes and between digestion phenotypes and the nine psychiatric and neurological disorder traits are in b, while genetic correlation results between digestion phenotypes and traits from LD Hub that had a significant correlation with at least one of the digestion phenotypes are provided in b, c. “*” represent that genetic correlation estimates are still significant after Bonferroni correction (P < 0.05/((5 + 9 + 258) * 5)).
Fig. 5
Fig. 5. Analyses of partitioning SNP-based heritability by different annotations.
a SNP-based heritability enrichment analysis for each digestion phenotype partitioned by cell type groups annotated by histone marks. The dashed line represents the Bonferroni corrected significance threshold (0.05/(53 * 5 + 5 * 5)). b SNP-based heritability enrichment analysis for PG+M and IBD partitioned by cell types annotated using cell-type specific gene expression data given the results from a. The dotted lines represent the Bonferroni correction threshold (P < 0.05/(205*2)). c SNP-based heritability enrichment analysis for GORD, PG+M, and IBS partitioned by cell types annotated using fine-scale GTEx brain gene expression data from 13 brain regions selected given the central nervous system enrichment results of these three phenotypes from a. The dashed line represents the Bonferroni correction threshold (P < 0.05/(13*3)).
Fig. 6
Fig. 6. Comorbidity, Mendelian randomisation and polygenic risk score analyses with depression.
a Comorbidity relationship between eight depression phenotypes and each of the PUD, GORD, IBS, and IBD. Odds ratio and 95% CI were calculated based on the 2 by 2 contingency table for number of cases and controls of each of the 32 digestion-depression phenotype pairs (Supplementary Tables 19 and 20). The definitions of the eight depression phenotypes are in the Methods section. “*” represents the P value for each digestion and depression pair that remain significant after Bonferroni correction (P < 0.05/32). b Mendelian randomization (MR) results between major depression (MD) and five digestion phenotypes. The left y axis is for MD while the right y axis is for the five digestion phenotypes. The arrow for each horizontal line represents the direction from exposure trait to outcome trait relative to the y-axis labels. OR and 95% CI are represented as diamond and horizontal lines taking values from x axis. Each digestive phenotype corresponds to two horizontal lines. “R” on the right side of the horizontal line represents relaxation of significance threshold of SNP associations to obtain more SNP genetic instruments (Supplementary Table 21). The number of the SNP instruments used in analyses are shown above the diamond. The common pathological characteristics or symptoms for these phenotype-related diseases are shown on the right side (noting that pathological characteristics or symptoms are not limited to these locations). c Decile of major depression polygenic score predicts PG+M. Odds ratio (OR) and 95% confidence intervals (CI, blue dots and orange bars) relative to decile 1 were estimated using logistic regression. The blue dashed lines shows the OR for the highest decile, OR of 1.33 for PG+M related disorders. d OR and 95% CIs (green dots and blue bars) for top decile of PG+M polygenic score predicting depression and psychiatric disorders in the independent GERA cohort.

References

    1. Peery AF, et al. Burden and cost of gastrointestinal, liver, and pancreatic diseases in the United States: update 2018. Gastroenterology. 2019;156:254–272. doi: 10.1053/j.gastro.2018.08.063. - DOI - PMC - PubMed
    1. Williams JG, et al. Gastroenterology services in the UK. The burden of disease, and the organisation and delivery of services for gastrointestinal and liver disorders: a review of the evidence. Gut. 2007;56:1. doi: 10.1136/gut.2006.117598. - DOI - PMC - PubMed
    1. Whitehead WE, Palsson O, Jones KR. Systematic review of the comorbidity of irritable bowel syndrome with other disorders: What are the causes and implications? Gastroenterology. 2002;122:1140–1156. doi: 10.1053/gast.2002.32392. - DOI - PubMed
    1. Vakil N, van Zanten SV, Kahrilas P, Dent J, Jones R. The Montreal definition and classification of gastroesophageal reflux disease: a global evidence-based consensus. Am. J. Gastroenterol. 2006;101:1900–1920. doi: 10.1111/j.1572-0241.2006.00630.x. - DOI - PubMed
    1. Lanas A, Chan FKL. Peptic ulcer disease. Lancet. 2017;390:613–624. doi: 10.1016/S0140-6736(16)32404-7. - DOI - PubMed

Publication types

MeSH terms