. 2021 Feb 19;12(1):1186.
doi: 10.1038/s41467-021-21453-4.

Optimal marker gene selection for cell type discrimination in single cell analyses

Affiliations

Optimal marker gene selection for cell type discrimination in single cell analyses

Bianca Dumitrascu et al. Nat Commun. .

Abstract

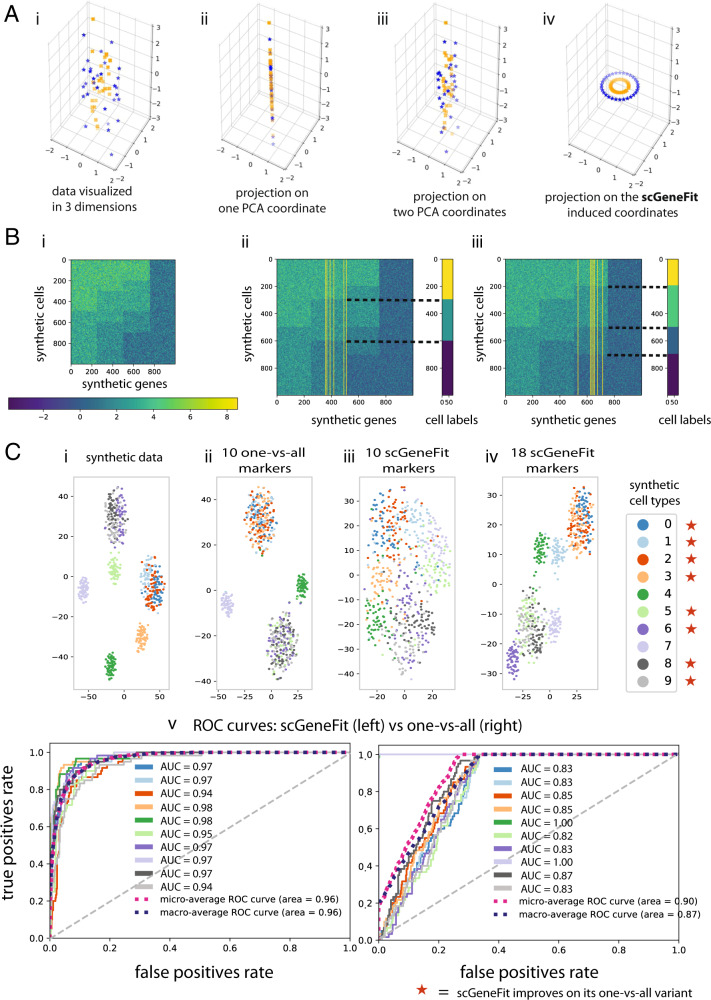
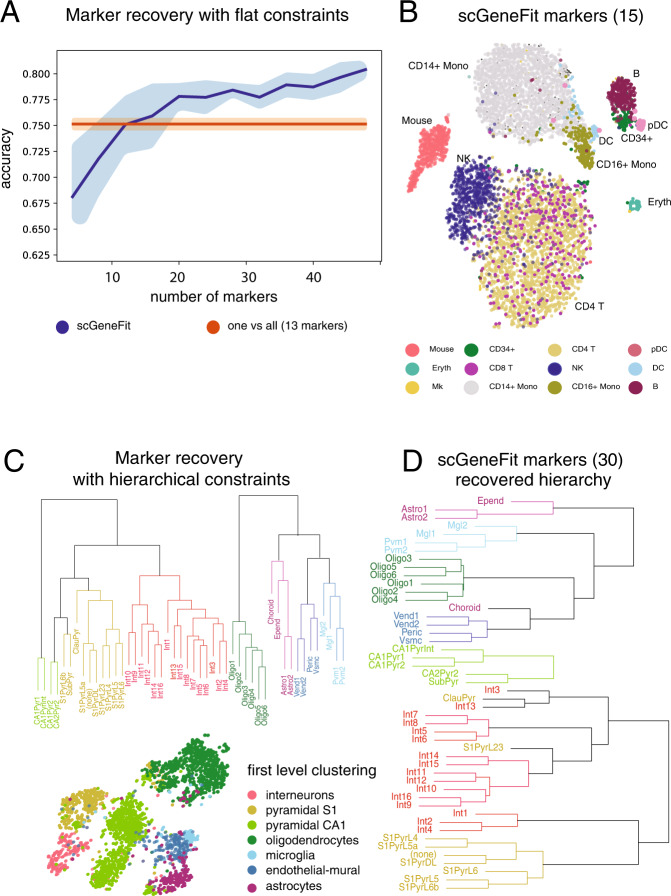
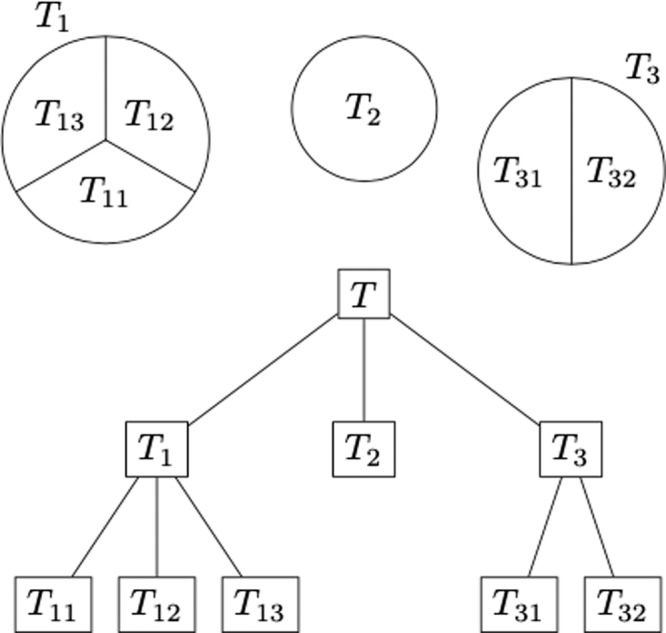
Single-cell technologies characterize complex cell populations across multiple data modalities at unprecedented scale and resolution. Multi-omic data for single cell gene expression, in situ hybridization, or single cell chromatin states are increasingly available across diverse tissue types. When isolating specific cell types from a sample of disassociated cells or performing in situ sequencing in collections of heterogeneous cells, one challenging task is to select a small set of informative markers that robustly enable the identification and discrimination of specific cell types or cell states as precisely as possible. Given single cell RNA-seq data and a set of cellular labels to discriminate, scGeneFit selects gene markers that jointly optimize cell label recovery using label-aware compressive classification methods. This results in a substantially more robust and less redundant set of markers than existing methods, most of which identify markers that separate each cell label from the rest. When applied to a data set given a hierarchy of cell types as labels, the markers found by our method improves the recovery of the cell type hierarchy with fewer markers than existing methods using a computationally efficient and principled optimization.


Conflict of interest statement

B.E.E. is on the Scientific Advisory Board of Freenome, Celsius Therapeutics, and Crayon Bio. B.E.E. is a consultant for Freenome and was employed by Genomics plc during 2019-2020. Otherwise, the authors declare that they have no additional competing interests.

Figures

Fig. 1
Fig. 1. scGeneFit identifies markers associated with a flat partition of cell type labels when applied to a wide range of synthetic datasets.
A Proof of concept inspired by ref. ; cells are color coded with labels. In simulated high-dimensional data, for each sample, two dimensions (x- and y-axes) are drawn from concentric circles, and the remaining dimensions are drawn from white noise. The underlying structure is not apparent from the data (A-i). Considering each dimension in isolation, marker selection fails to capture the true structure (A-ii,iii). In contrast, scGeneFit recovers the correct dimensions as markers, and is able to recapitulate the label structure (A-iv). B Discriminative markers were correctly recovered by scGeneFit for simulated samples drawn from mixtures of Gaussians corresponding to two distinct label sets with three (B-ii), and four (B-iii) labels, respectively. Each row is a single sample and each column is a single feature or gene. Only 1000 genes of 10,000 are visualized, representing all the types simulated. The yellow lines correspond to the markers selected by scGeneFit. C t-SNE visualizations of results from the functional group synthetic data (C-i–iv). ROC curves comparing the performance of one-vs-all and scGeneFit in distinguishing cell labels following dimension reduction. scGeneFit outperforms one-vs-all in most cell labels when using the same number of markers (C-v).
Fig. 2
Fig. 2. scGeneFit applied to scRNA-seq data with input cell labels both unstructured (flat) and hierarchical.
A, B Results from single-cell expression profiles of cord blood mononuclear cells (CBMC) given a flat partition of labels. A Mean accuracy and variance of scGeneFit as a function of the number of allowed markers. B t-SNE visualization of scGeneFit with 15 marker genes distinguishing 13 distinct cell populations. C Hierarchical clustering of brain scRNA-seq data and a t-SNE plot of the cell labels at the first level of the hierarchy: interneurons, pyramidal S1 cells, pyramidal CA1 cells, oligodendrocytes, microglia, endothelial–mural cells, and astrocytes. D Hierarchical labeling of the data with respect to the 30 markers chosen by scGeneFit. scGeneFit achieves predictive accuracy comparable to the full gene set, using 40% fewer markers than one-vs-all.
Fig. 3
Fig. 3. Example of hierarchical partition explaining the notation.
In this example, we have three classes (T1, T2, and T3) at the first level of the hierarchy. At the second level of the hierarchy, T1 is divided into three classes (T11, T12, and T13), and T2 is divided in two classes (T21 and T23).

References

    1. Macosko EZ, et al. Highly parallel genome-wide expression profiling of individual cells using nanoliter droplets. Cell. 2015;161:1202–1214. doi: 10.1016/j.cell.2015.05.002. - DOI - PMC - PubMed
    1. Zheng GX, et al. Massively parallel digital transcriptional profiling of single cells. Nat. Commun. 2017;8:14049. doi: 10.1038/ncomms14049. - DOI - PMC - PubMed
    1. Zhu L, Lei J, Devlin B, Roeder K, et al. A unified statistical framework for single cell and bulk RNA sequencing data. Ann. Appl. Stat. 2018;12:609–632. doi: 10.1214/17-AOAS1110. - DOI - PMC - PubMed
    1. Stoeckius M, et al. Simultaneous epitope and transcriptome measurement in single cells. Nat. Methods. 2017;14:865. doi: 10.1038/nmeth.4380. - DOI - PMC - PubMed
    1. Codeluppi, S. et al. Spatial organization of the somatosensory cortex revealed by cyclic smFISH. Nat. Methods15, 932–935 (2018). - PubMed

Publication types

Substances

LinkOut - more resources