Comparative Study
. 2021 Feb 19;12(1):1152.
doi: 10.1038/s41467-021-20973-3.

Exploring beyond clinical routine SARS-CoV-2 serology using MultiCoV-Ab to evaluate endemic coronavirus cross-reactivity

Affiliations
Comparative Study

Exploring beyond clinical routine SARS-CoV-2 serology using MultiCoV-Ab to evaluate endemic coronavirus cross-reactivity

Matthias Becker et al. Nat Commun. .

Abstract

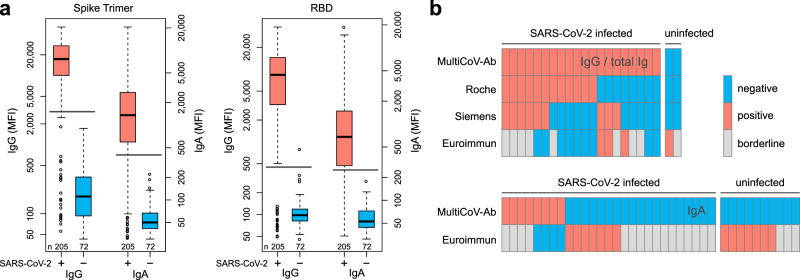
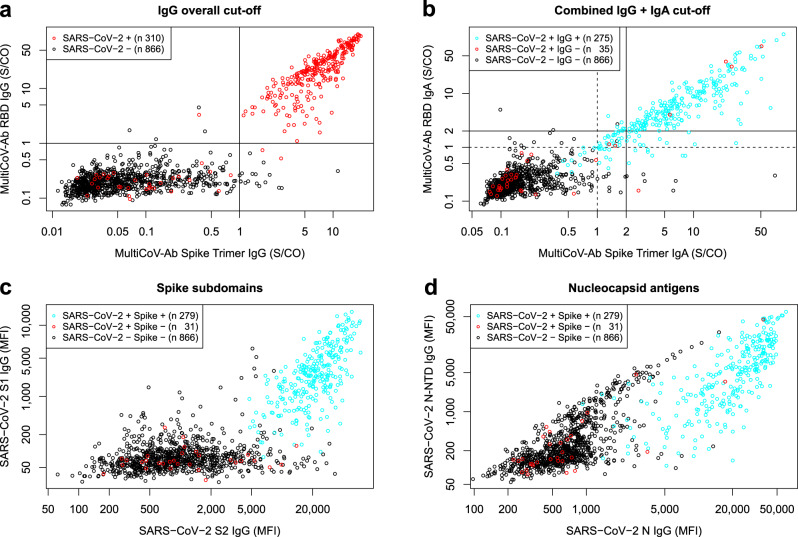
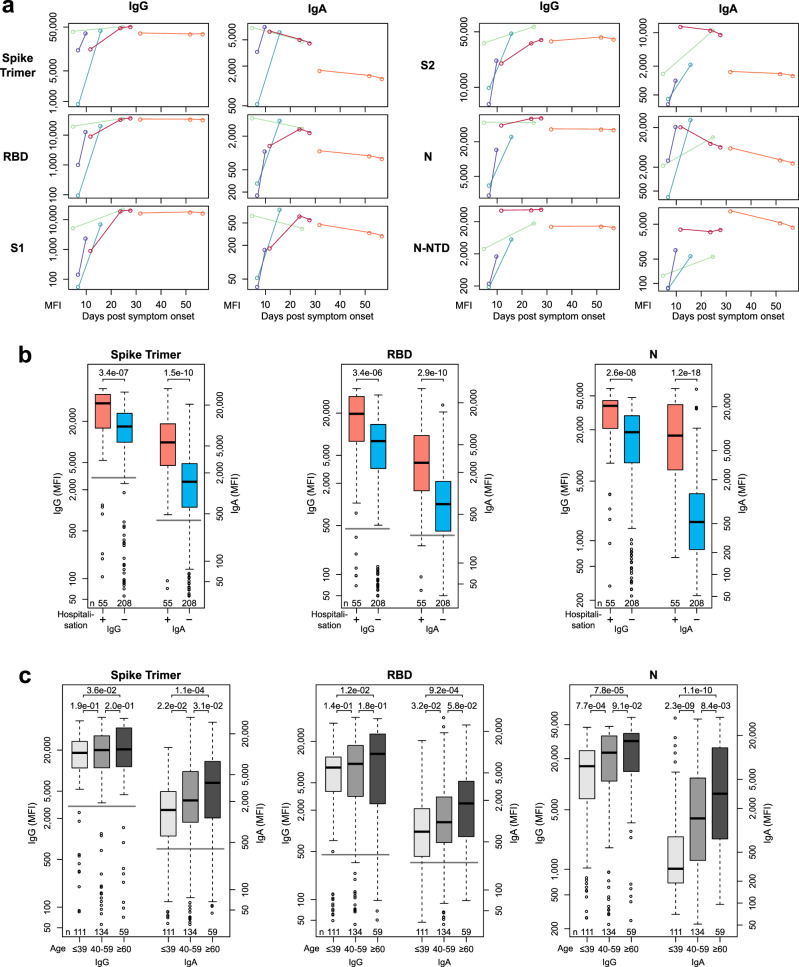
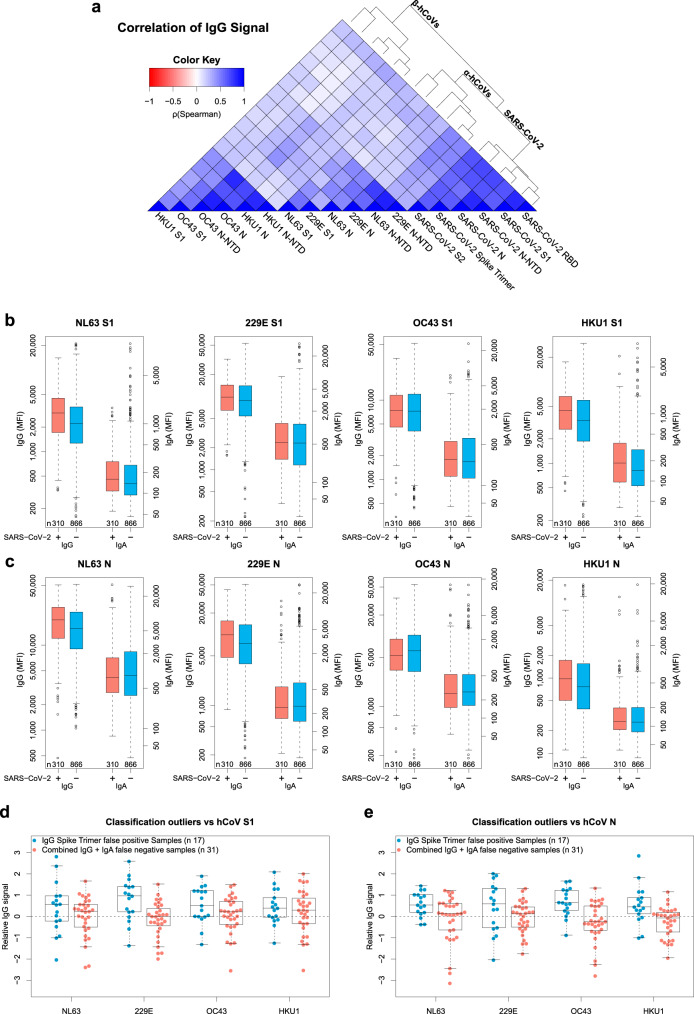
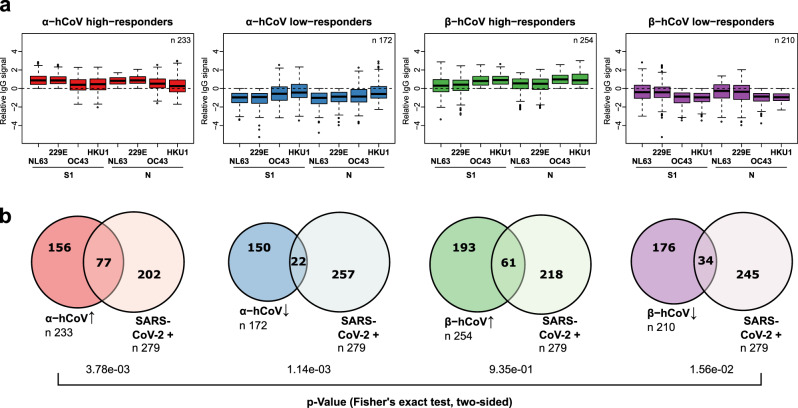
The humoral immune response to SARS-CoV-2 is a benchmark for immunity and detailed analysis is required to understand the manifestation and progression of COVID-19, monitor seroconversion within the general population, and support vaccine development. The majority of currently available commercial serological assays only quantify the SARS-CoV-2 antibody response against individual antigens, limiting our understanding of the immune response. To overcome this, we have developed a multiplex immunoassay (MultiCoV-Ab) including spike and nucleocapsid proteins of SARS-CoV-2 and the endemic human coronaviruses. Compared to three broadly used commercial in vitro diagnostic tests, our MultiCoV-Ab achieves a higher sensitivity and specificity when analyzing a well-characterized sample set of SARS-CoV-2 infected and uninfected individuals. We find a high response against endemic coronaviruses in our sample set, but no consistent cross-reactive IgG response patterns against SARS-CoV-2. Here we show a robust, high-content-enabled, antigen-saving multiplex assay suited to both monitoring vaccination studies and facilitating epidemiologic screenings for humoral immunity towards pandemic and endemic coronaviruses.


Conflict of interest statement

The authors declare the following competing interests: T.O.J. is a scientific advisor for Luminex. N.S-M. was a speaker at Luminex user meetings in the past. The Natural and Medical Sciences Institute at the University of Tübingen is involved in applied research projects as a fee for services with Luminex. The remaining authors declare no competing interests.

Figures

Fig. 1
Fig. 1. MultiCoV-Ab, a sensitive and specific tool to monitor SARS-CoV-2 antibody responses.
a Control sera (blue, n = 72) and sera from individuals with PCR-confirmed SARS-CoV-2 infection (red, n = 205) were screened in a multiplex bead-based assay using Luminex technology (MultiCoV-Ab) to quantify IgG or IgA responses to various antigens. Reactivity towards trimeric SARS-CoV-2 spike protein (Spike Trimer) or SARS-CoV-2 receptor binding domain of spike (RBD) was found to be the best predictor of SARS-CoV-2 infection. Data are presented as Box-Whisker plots of a sample’s median fluorescence intensity (MFI) on a logarithmic scale. Box represents the median and the 25th and 75th percentiles, whiskers show the largest and smallest values. Outliers determined by 1.5 times IQR of log-transformed data are depicted as circles. Cut-off values for classification for single antigens are displayed as horizontal lines (Spike Trimer IgG: 3,000 MFI, IgA: 400 MFI; RBD IgG: 450 MFI, IgA: 250 MFI). b Sample set from a, was used to compare assay performance of the MultiCoV-Ab using Spike Trimer and RBD antigens with commercially available single analyte SARS-CoV-2 IVD assays which detect total Ig (Elecsys Anti-SARS-CoV-2 (Roche); ADVIA Centaur SARS-CoV-2 Total (COV2T) (Siemens Healthineers)) or IgG (Anti-SARS-CoV-2-ELISA - IgG (Euroimmun)) or IgA (Anti-SARS-CoV-2-ELISA - IgA (Euroimmun)). SARS-CoV-2 infection status of samples based on PCR diagnostic is indicated as SARS-CoV-2 positive or negative. Antibody test results were classified as negative (blue), positive (red), or borderline (gray) as per the manufacturer’s definition. Only samples with divergent antibody test results are shown. c Performance and specifications as stated in the manufacturer’s IVD assay manual. For the manufacturer sensitivity specification, information for samples >14 days post-infection are presented. Respective sensitivity and specificity values calculated in this study are given with 95% Clopper-Pearson confidence intervals. Positive and negative predictive values (PPV/NPV) were calculated based on a seropositivity of 3%. Source data are provided as a Source Data file.
Fig. 2
Fig. 2. Combination of 2 spike protein variants and isotype profiling by multiplex assay increases accuracy to identify SARS-CoV-2 antibody-positive individuals.
a, b Scatterplot detailing MultiCoV-Ab cut-offs. Signal to cut-off (S/CO) values are displayed for Spike Trimer against RBD on a logarithmic scale. For IgG (a), cut-offs are visualized by straight lines and SARS-CoV-2-infected and uninfected samples are separated by color (black circles – SARS-CoV-2-uninfected; red circles – SARS-CoV-2-infected). For IgA (b) cut-offs are visualized as dashed lines and S/CO of 2 used for the combined cut-off is shown as straight lines. SARS-CoV-2-infected samples are split into IgG-positives and -negatives by color as indicated in the plot. c, d Scatterplots display IgG response to additional SARS-CoV-2 antigens contained in the MultiCoV-Ab panel: MFI for spike subdomains S1 vs S2 (c) or nucleocapsid antigens N vs N-NTD (d) are displayed on a logarithmic scale. SARS-CoV-2-uninfected samples are distinguished from SARS-CoV-2-infected and MultiCoV-Ab classification into positives or negatives as indicated by color. Source data are provided as a Source Data file.
Fig. 3
Fig. 3. Multiplex-based seroprofiling allows in-depth characterization of SARS-CoV-2 antibody responses.
a Kinetic of SARS-CoV-2 antigen-specific IgA and IgG responses is shown for indicated days after symptom onset for six SARS-CoV-2-specific antigens for five different patients. Patients are indicated by color. b, c Samples of SARS-CoV-2-infected individuals were analyzed to identify antigen- and isotype-specific antibody responses based on hospitalization indicating disease severity (b) or age (c). Data is presented as Box-Whisker plots of sample MFI on a logarithmic scale. Box represents the median and the 25th and 75th percentiles, whiskers show the largest and smallest values. Outliers determined by 1.5 times IQR of log-transformed data are depicted as circles. p-value (Mann–Whitney U test, two-sided) is displayed at the top of the boxes, indicating differences between signal distribution for respective groups. Cut-off values for MultiCoV-Ab classification are displayed as horizontal lines (Spike Trimer IgG: 3,000 MFI, IgA: 400 MFI; RBD IgG: 450 MFI, IgA: 250 MFI). Source data are provided as a Source Data file.
Fig. 4
Fig. 4. Correlation of seasonal hCoV and SARS CoV-2 antibody responses.
a Correlation of IgG response for the entire sample set (n = 1176) is visualized as heatmap based on Spearman’s ρ coefficient; dendrogram on the right side displays antigens after hierarchical clustering was performed. b-c, Immune responses (IgG and IgA) towards hCoV S1 (b) and N (c) proteins are presented as Box-Whisker plots of sample MFI on a logarithmic scale for SARS-CoV-2-infected (red, n = 310) and uninfected (blue, n = 866) individuals. Box represents the median and the 25th and 75th percentiles, whiskers show the largest and smallest values. Outliers determined by 1.5 times IQR of log-transformed data are depicted as circles. d-e, Relative levels of IgG-specific immune response towards hCoV S1 (d) and N (e) proteins are presented as Box-Whisker plots/strip chart overlays of log-transformed and per-antigen scaled and centered MFI for the sample subsets of Spike Trimer false positives (blue, n = 17) and combined IgG + IgA false negatives (red, n = 31). Box represents the median and the 25th and 75th percentiles, whiskers show the largest and smallest values, excluding outliers as determined by 1.5 times IQR. Source data are provided as a Source Data file.
Fig. 5
Fig. 5. Analysis of seasonal hCoV high and low responders.
a From the entire study population, groups of α- or β-hCoV high and low responders were built as indicated. High responder were defined as samples with above average MFI values for S1 and N-specific IgGs of the respective hCoV clade. Low responders were defined with below MFI values, correspondingly. Responder groups (i) α-hCoV ↑, red, n = 233, (ii) β-hCoV ↑, green, n = 254, (iii) α-hCoV ↓, blue, n = 172 (iv) β-hCoV ↓, purple, n = 210 are shown as Box-Whisker plots of log-transformed and per-antigen scaled and centered MFI values across hCoV N and S1 antigens. Box represents the median and the 25th and 75th percentiles, whiskers show the largest and smallest values. Outliers determined by 1.5 times IQR are depicted as circles. b The over- or under-representation of SARS-CoV-2 responders (SARS-CoV-2 + , n = 279, as determined by positive MultiCoV-Ab classification) within the four sample groups is visualized in Venn diagrams, stochastic significance was calculated using Fisher’s exact test (two-sided). Source data are provided as a Source Data file.

References

    1. Gorbalenya AE, et al. The species Severe acute respiratory syndrome-related coronavirus: classifying 2019-nCoV and naming it SARS-CoV-2. Nat. Microbiol. 2020;5:536–544. doi: 10.1038/s41564-020-0695-z. - DOI - PMC - PubMed
    1. Mofijur M, et al. Impact of COVID-19 on the social, economic, environmental and energy domains: Lessons learnt from a global pandemic. Sustain. Prod. Consum. 2021;26:343–359. doi: 10.1016/j.spc.2020.10.016. - DOI - PMC - PubMed
    1. Hu, B., Guo, H., Zhou, P. & Shi, Z.-L. Characteristics of SARS-CoV-2 and COVID-19. Nat. Rev. Microbiol.10.1038/s41579-020-00459-7 (2020). - PMC - PubMed
    1. Wu Z, McGoogan JM. Characteristics of and important lessons from the coronavirus disease 2019 (COVID-19) outbreak in China: summary of a report of 72 314 cases from the Chinese Center for Disease Control and Prevention. Jama. 2020;323:1239–1242. doi: 10.1001/jama.2020.2648. - DOI - PubMed
    1. Huang AT, et al. A systematic review of antibody mediated immunity to coronaviruses: kinetics, correlates of protection, and association with severity. Nat. Commun. 2020;11:4704. doi: 10.1038/s41467-020-18450-4. - DOI - PMC - PubMed

Publication types

Substances