. 2021 Feb 19;12(1):1150.
doi: 10.1038/s41467-021-21009-6.

Diatom fucan polysaccharide precipitates carbon during algal blooms

Affiliations

Diatom fucan polysaccharide precipitates carbon during algal blooms

Silvia Vidal-Melgosa et al. Nat Commun. .

Abstract

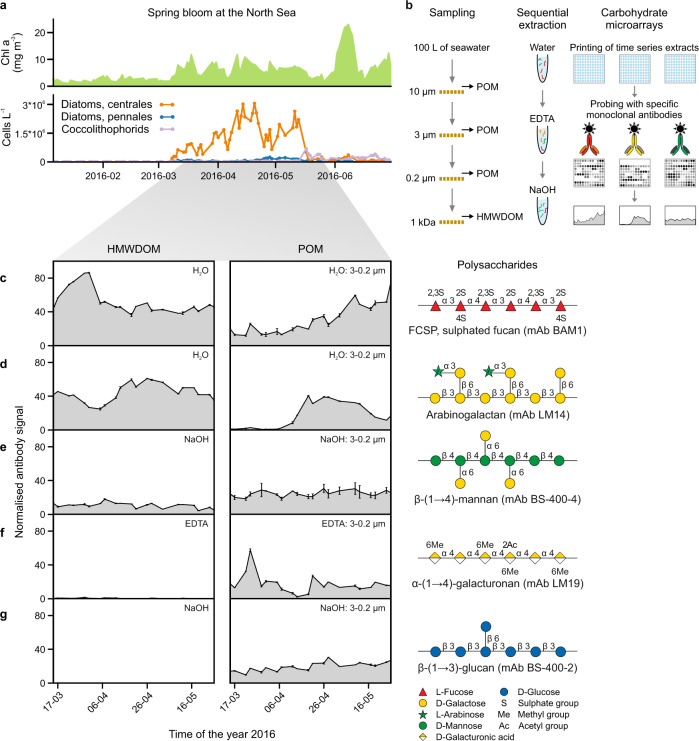
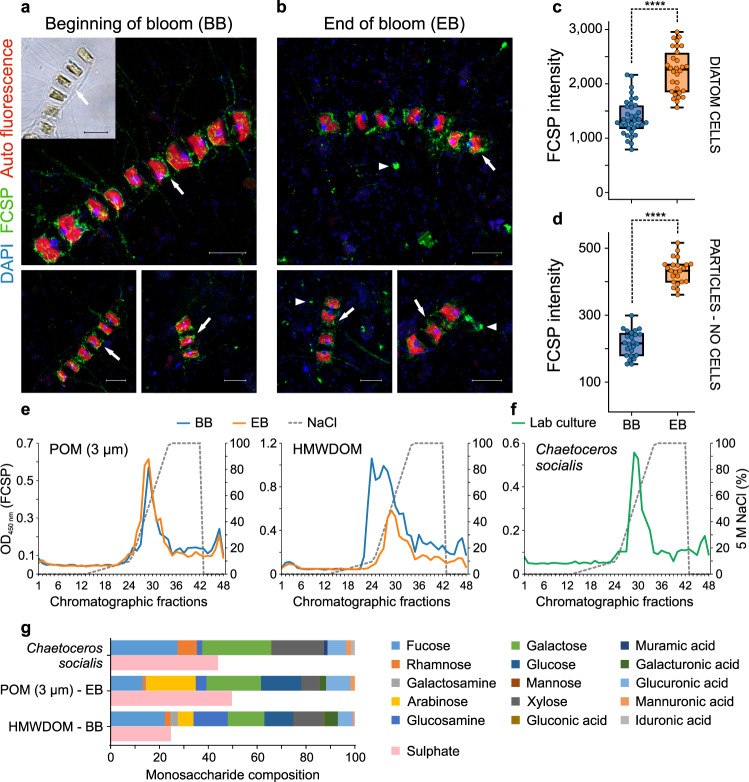
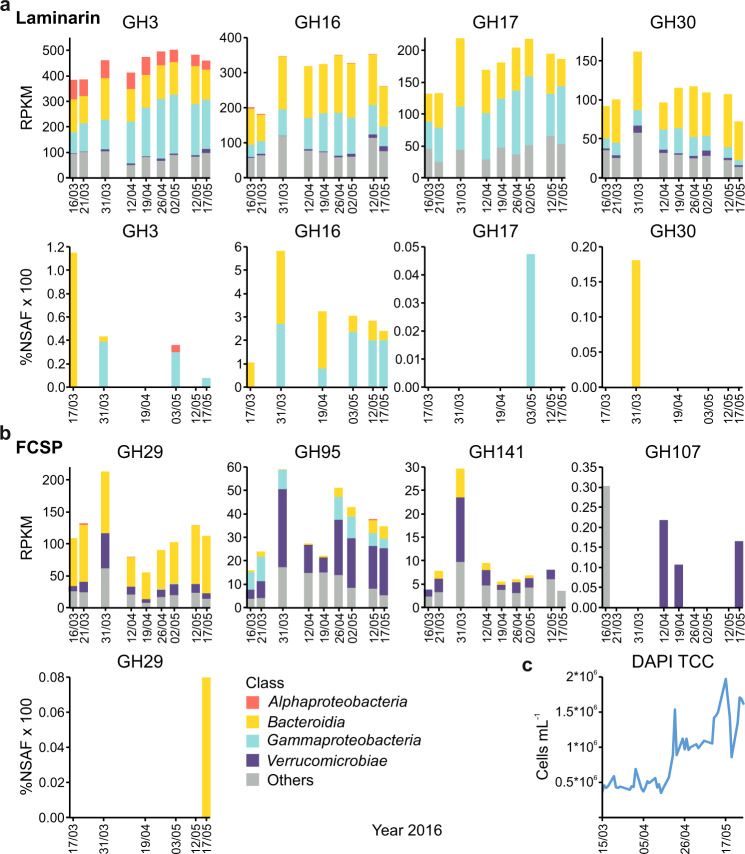
The formation of sinking particles in the ocean, which promote carbon sequestration into deeper water and sediments, involves algal polysaccharides acting as an adhesive, binding together molecules, cells and minerals. These as yet unidentified adhesive polysaccharides must resist degradation by bacterial enzymes or else they dissolve and particles disassemble before exporting carbon. Here, using monoclonal antibodies as analytical tools, we trace the abundance of 27 polysaccharide epitopes in dissolved and particulate organic matter during a series of diatom blooms in the North Sea, and discover a fucose-containing sulphated polysaccharide (FCSP) that resists enzymatic degradation, accumulates and aggregates. Previously only known as a macroalgal polysaccharide, we find FCSP to be secreted by several globally abundant diatom species including the genera Chaetoceros and Thalassiosira. These findings provide evidence for a novel polysaccharide candidate to contribute to carbon sequestration in the ocean.


Conflict of interest statement

The authors declare no competing interests.

Figures

Fig. 1
Fig. 1. Different polysaccharide structures are present in high molecular weight dissolved organic matter (HMWDOM) and particulate organic matter (POM) and show fluctuations in their abundance during the diatom bloom.
a Chlorophyll a (Chl a) concentrations and abundances of the major microalgae taxa detected at our sampling site (54˚11.3′N, 7˚54.0′E) from January to June 2016. b Scheme of the sampling and carbohydrate microarray analysis. cg Representative examples of five selected polysaccharides, complete microarray data set is shown in Supplementary Fig. 5. On the left, plots show the relative abundance of polysaccharide epitopes (antibody signal intensity, y axis) detected in HMWDOM and POM during the bloom (21 sampling dates, x axis). Spot signal intensities for each extract (each extract was represented by 4 spots in the array) against each probe were quantified and the highest mean signal value in the data set for HMWDOM and for POM was set to 100 and all other values were normalised accordingly. Data are mean values, n = 4 spots per extract. The temporal dynamics but not the absolute number should be compared between HMWDOM and POM pools as they required independent normalisation, since they required different sampling strategies. At the right, sketch of polysaccharide structures that the corresponding monoclonal antibodies (mAbs), which are depicted in parentheses, bind to. HMWDOM, between 0.2 µm and 1 kDa. Error bars in cg represent ± standard deviation.
Fig. 2
Fig. 2. Fucose-containing sulphated polysaccharide (FCSP) is produced by diatoms and increased abundance in particulate organic matter (POM) during the bloom.
Inset in panel a, bright-field image of Chaetoceros socialis cells. a, b Representative images of FCSP localisation in POM (>0.2 µm) from the diatom bloom. Airyscan super-resolution images demonstrate FCSP occurred around the cells (arrows) of the chain-forming diatom C. socialis at the beginning of the bloom (BB) (a) and on the diatoms cells (arrows) as well as on particles (arrowheads) at the end of the bloom (EB) (b). In a, b, DAPI (blue), FCSP (green) and diatom auto fluorescence (red). Scale bars, 10 µm. Experiments were performed four times with similar results. c Quantification of FCSP signal (mAb BAM1) on diatom cells. BB n = 36 cells, EB n = 30 cells. d FCSP quantification on particles (areas not containing cells). BB n = 24 areas, EB n = 23 areas. In c, d ****P < 0.0001 (two-sided t-test), in c P = 8.4 × 10−13 and in d P = 2.3 × 10−23. For boxplots, the middle line indicates the median, the box designates the interquartile range (IQR) and the whiskers denote 1.5 times the IQR. e, f Chromatographic separation of FCSP in water extracts from POM and high molecular weight dissolved organic matter (HMWDOM) of beginning and end of the bloom (e) and from a lab culture of the diatom C. socialis (f) by anion exchange chromatography (AEC). AEC fractions were analysed by ELISA with the mAb BAM1. ELISA developing time was not the same for the five shown representative single FCSP separation AEC runs (four in e and one in f), thus absorbance values do not indicate extract concentration (see Methods section). Optical density (OD). Experiments (chromatography plus ELISA analyses) for BB and EB POM were performed two times per each, for BB and EB HMWDOM four times per each and for C. socialis four times, with similar results. g Monosaccharide composition of purified FCSP (AEC fraction with BAM1 absorbance peak) as mean relative abundance, n = 2 independent acid hydrolysis and HPAEC-PAD runs. See FCSP monosaccharide composition of additional AEC fractions in Supplementary Fig. 6b. Sulphate content (n = 2 technical replicates) of each purified FCSP sample as µM sulphate per µM total building blocks.
Fig. 3
Fig. 3. Content and expression of particular CAZymes by marine bacteria during the algal bloom.
Plots show abundances of genes coding for carbohydrate-active enzymes (CAZymes) with relevance for degradation of two selected glycan substrates in the genomes of marine bacteria (at the top of each panel) and their expression during the bloom (at the bottom of each panel). Selected substrates are: β-1,3-glucan, laminarin (a) and fucose-containing sulphated polysaccharide, FCSP (b). Complete CAZymes metagenomic analysis and complete proteomic data are shown in Supplementary Fig. 7. Reads per kilobase per million (RPKM). Proteome data were analysed in a semiquantitative manner based on normalised spectral abundance factors (%NSAF). Both analyses include class-level taxonomic classifications, see Methods section. Glycoside hydrolase family (GH). c DAPI-based total microbial cell counts (TCC) during the diatom bloom of 2016.

References

    1. Alldredge AL, Gotschalk C, Passow U, Riebesell U. Mass aggregation of diatom blooms: insights from a mesocosm study. Deep Sea Res. Part II Top. Stud. Oceanogr. 1995;42:9–27. doi: 10.1016/0967-0645(95)00002-8. - DOI
    1. Eppley RW, Peterson BJ. Particulate organic matter flux and planktonic new production in the deep ocean. Nature. 1979;282:677–680. doi: 10.1038/282677a0. - DOI
    1. Alldredge AL, Gotschalk CC. Direct observations of the mass flocculation of diatom blooms: characteristics, settling velocities and formation of diatom aggregates. Deep Sea Res. Part A. Oceanogr. Res. Pap. 1989;36:159–171. doi: 10.1016/0198-0149(89)90131-3. - DOI
    1. Le Quéré C, et al. Global carbon budget 2018. Earth Syst. Sci. Data. 2018;10:2141–2194. doi: 10.5194/essd-10-2141-2018. - DOI
    1. Aluwihare LI, Repeta DJ, Chen RF. A major biopolymeric component to dissolved organic carbon in surface sea water. Nature. 1997;387:166–169. doi: 10.1038/387166a0. - DOI

Publication types