. 2021 Feb 19;12(1):1195.
doi: 10.1038/s41467-021-21479-8.

Calculating metalation in cells reveals CobW acquires CoII for vitamin B12 biosynthesis while related proteins prefer ZnII

Affiliations

Calculating metalation in cells reveals CobW acquires CoII for vitamin B12 biosynthesis while related proteins prefer ZnII

Tessa R Young et al. Nat Commun. .

Abstract

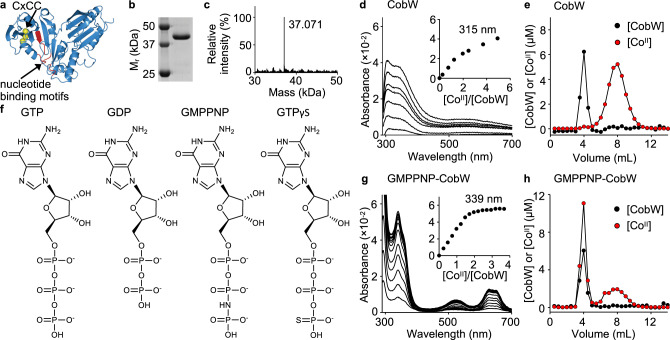
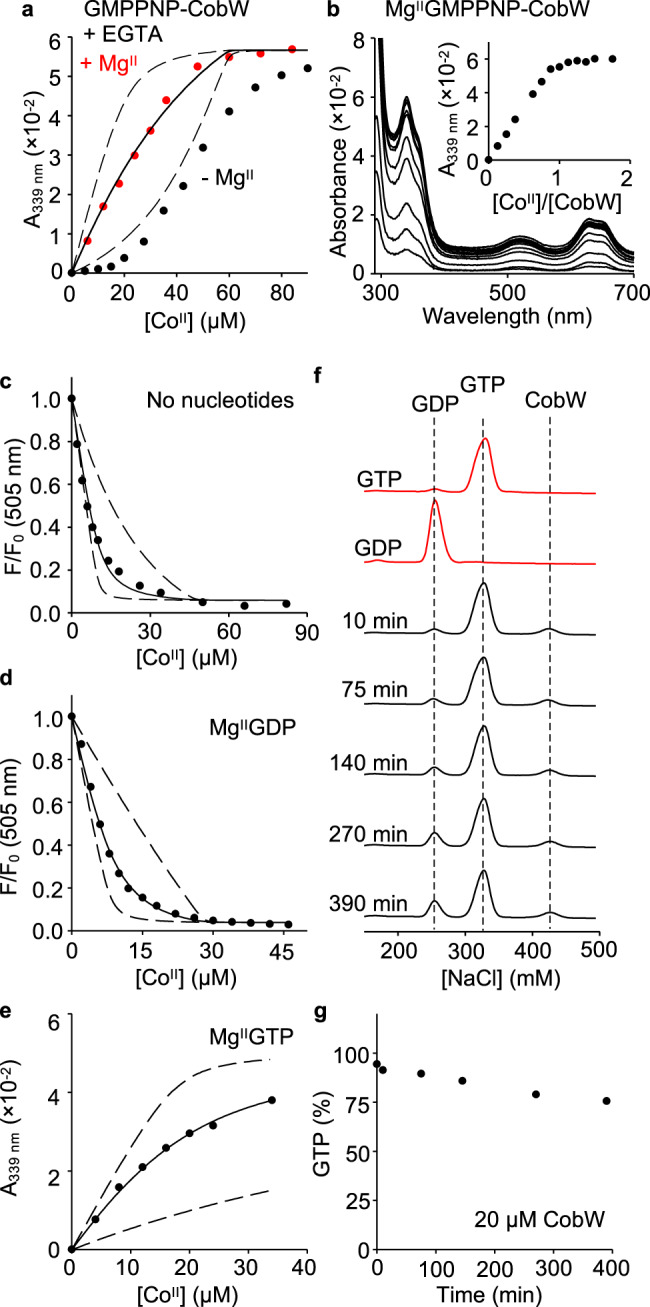
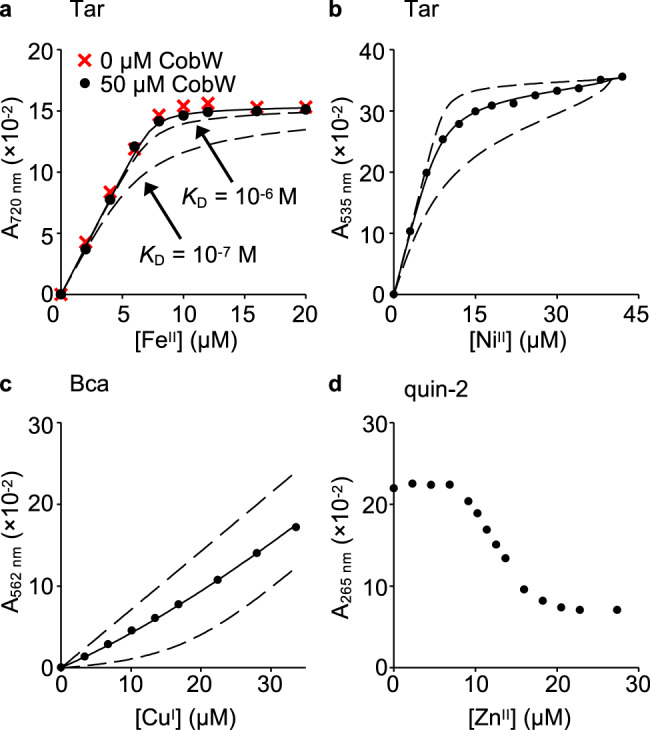
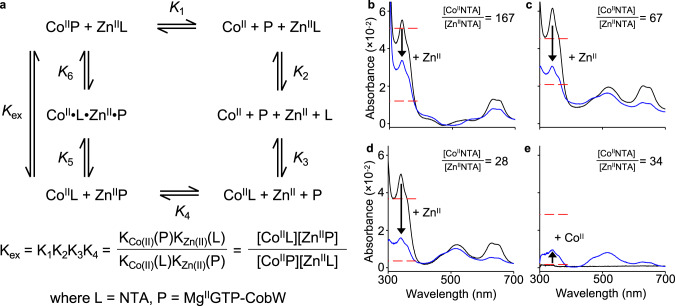
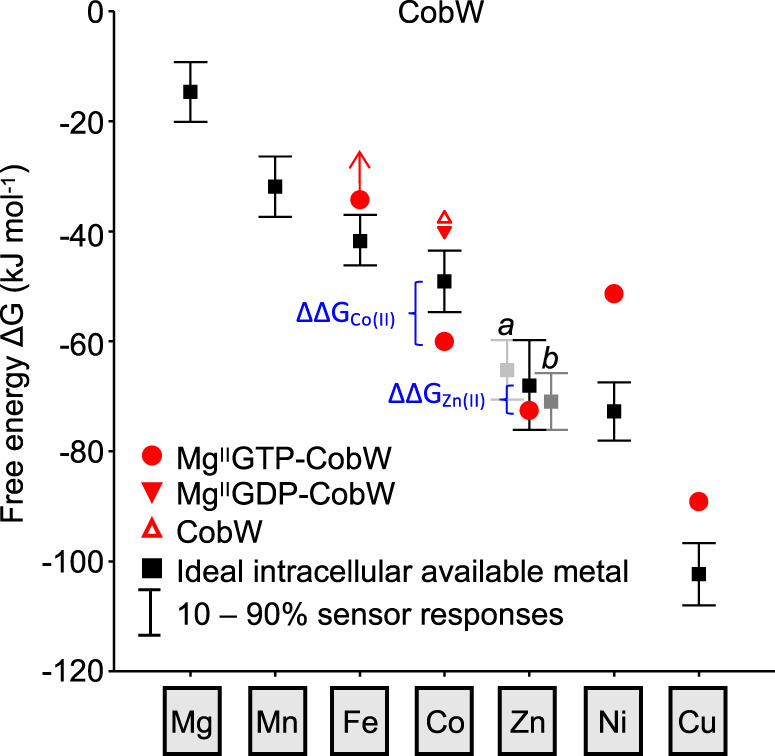
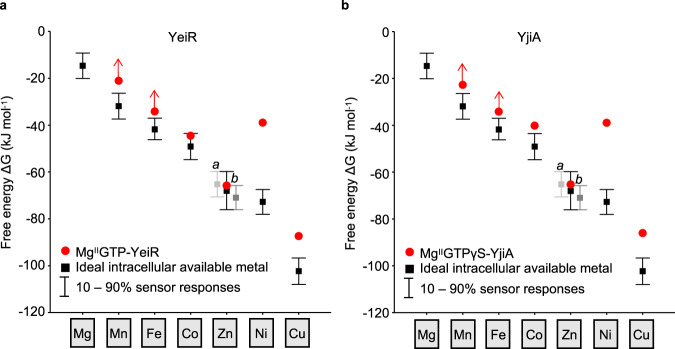
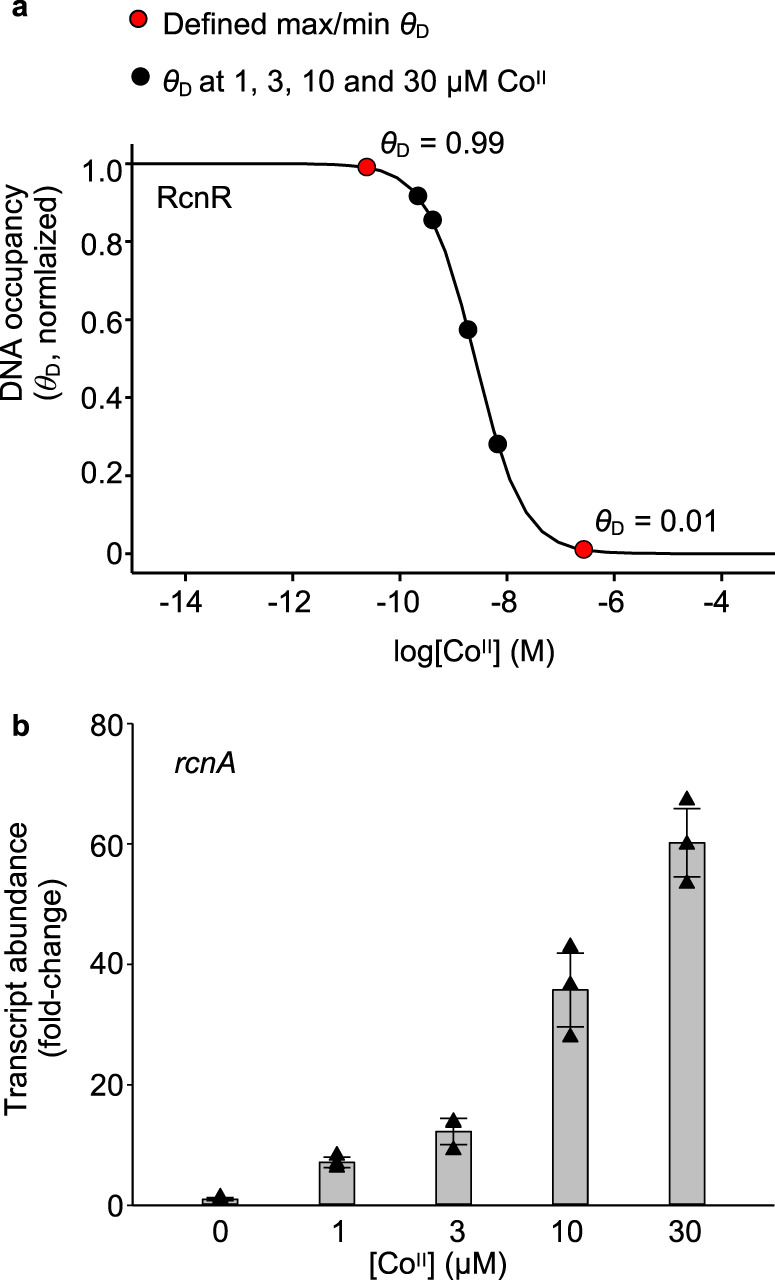
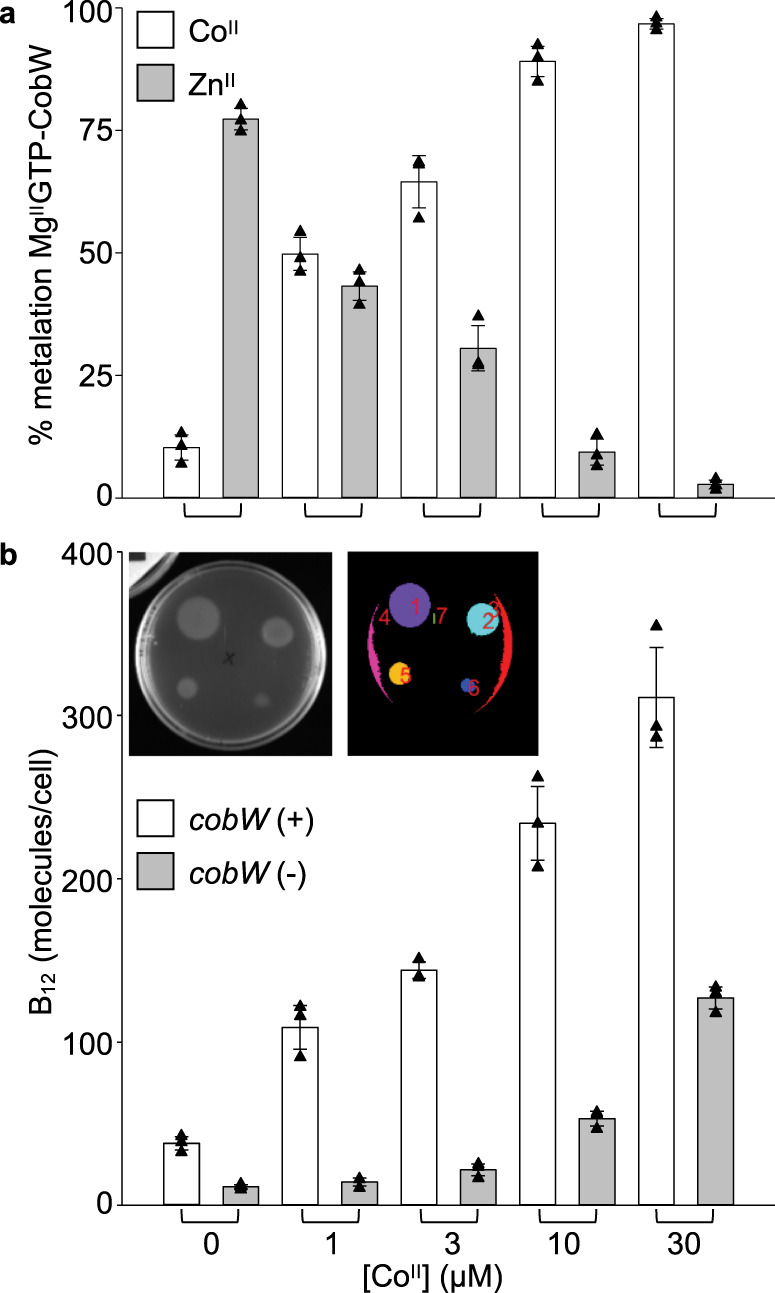
Protein metal-occupancy (metalation) in vivo has been elusive. To address this challenge, the available free energies of metals have recently been determined from the responses of metal sensors. Here, we use these free energy values to develop a metalation-calculator which accounts for inter-metal competition and changing metal-availabilities inside cells. We use the calculator to understand the function and mechanism of GTPase CobW, a predicted CoII-chaperone for vitamin B12. Upon binding nucleotide (GTP) and MgII, CobW assembles a high-affinity site that can obtain CoII or ZnII from the intracellular milieu. In idealised cells with sensors at the mid-points of their responses, competition within the cytosol enables CoII to outcompete ZnII for binding CobW. Thus, CoII is the cognate metal. However, after growth in different [CoII], CoII-occupancy ranges from 10 to 97% which matches CobW-dependent B12 synthesis. The calculator also reveals that related GTPases with comparable ZnII affinities to CobW, preferentially acquire ZnII due to their relatively weaker CoII affinities. The calculator is made available here for use with other proteins.


Conflict of interest statement

The authors declare no competing interests.

Figures

Fig. 1
Fig. 1. CoII binding to CobW is enhanced by guanine nucleotides.
a Homology model of CobW (generated with SWISS-MODEL using E. coli YjiA PDB entry 1NIJ as template; image generated using CCP4 Molecular Graphics software) showing sulfur atoms from conserved CxCC motif (in yellow) and nucleotide-binding (GxxGxGKT, hhhExxG, SKxD*) motifs, (in red). *Ordinarily NKxD but [ST]KxD observed in some COG0523 proteins. b Purified CobW analysed by SDS-PAGE (full image in Supplementary Fig. 1; n = 1 under these conditions). c ESI-MS analysis (de-convoluted spectra) of purified CobW. d Representative (n = 2) apo-subtracted spectra of CoII-titrated CobW (26.1 µM); feature at 315 nm (inset) shows a non-linear increase. e Representative (n = 2) elution profile following gel-filtration of a mixture of CobW (10 µM) and CoII (30 µM) showing no co-migration of metal (red) with protein (black). Fractions were analysed for protein by Bradford assay and for metal by ICP-MS. f Structures of nucleotides used in this work (generated using ChemDraw software). g As in d for a mixture of CobW (24 µM) and GMPPNP (60 µM); feature at 339 nm (inset) showing a linear increase saturating at 2:1 ratio CoII:CobW (n = 2). h As in e for a mixture of CobW (10 µM), CoII (30 µM) and GMPPNP (30 µM) showing co-migration of 1.8 equivalents CoII per CobW (mean value from peak integration, n = 2 independent experiments). Data replicates are shown in Supplementary Fig. 1.
Fig. 2
Fig. 2. MgII and the γ-phosphate group of GTP are necessary for high affinity CoII binding.
a Absorbance (relative to CoII-free solution) of CoII-titrated CobW (20 µM) with GMPPNP (60 µM) in competition with EGTA (40 µM); titrations in the absence (black) or presence (red) of MgII (2.7 mM, i.e. concentration in a bacterium,). Data shown are representative of n = 3 independent experiments (with varying [competitor] and/or identity; see Supplementary Figs. 3c, d and 4a, b). b Absorbance (relative to CoII-free solution) of CoII-titrated CobW (20 µM) with GMPPNP (60 µM) and MgII (2.7 mM) in the absence of competing ligand; feature at 339 nm (inset) showing linear increase saturating at 1:1 ratio CoII:CobW (n = 2; see Supplementary Fig. 3e). ce Representative KCo(II) quantification for CobW in the absence or presence of nucleotides (n = 3 independent experiments, details in Supplementary Fig. 4 and Supplementary Table 1). c Fluorescence quenching of CoII-titrated fura-2 (10 µM) in competition with CobW alone (37 µM). d Fluorescence quenching of CoII-titrated fura-2 (8.1 µM) in competition with CobW (20 µM) with MgII (2.7 mM) and GDP (200 µM). e Absorbance (relative to CoII-free solution) of CoII-titrated CobW (18 µM) in competition with EGTA (2.0 mM) with MgII (2.7 mM) and GTP (200 µM). Solid traces in a, c, d, e show curve fits of experimental data to a model where CobW binds one molar equivalent CoII per protein monomer. Dashed lines show simulated responses for KCo(II) tenfold tighter or weaker than the fitted value. f Analysis of GTP hydrolysis by anion-exchange chromatography. Control samples of GTP and GDP elute as distinct peaks (red traces) measured by absorbance at 254 nm. Black traces show the extent of hydrolysis of GTP (200 µM) incubated with CobW (20 µM), MgII (2.7 mM) and CoII (18 µM) over time. g Analysis of data from f showing % GTP remaining over time. After 390 min incubation, nucleotides remain primarily (>75 %) unhydrolysed. Equivalent data using 4:1 ratio GTP:CobW is shown in Supplementary Fig. 6.
Fig. 3
Fig. 3. Binding of MgIIGTP-CobW to FeII, NiII, CuI and ZnII.
a Absorbance upon FeII titration into a mixture of Tar (16 µM), MgII (2.7 mM) and GTP (500 µM) in the absence (red crosses) or presence (black circles) of CobW (50 µM). Dashed lines show simulated responses for specified KFe(II) of MgIIGTP-CobW, providing limiting KFe(II) ≥ 10−6 M. Control FeII titration into a solution of Tar (16 µM) in buffer only (Supplementary Fig. 8a) confirmed that MgII and GTP did not inhibit stoichiometric FeIITar2 formation. b Absorbance change (relative to NiII-free solution) of NiII-titrated Tar (20 µM) in competition with CobW (30 µM) in the presence of MgII (2.7 mM) and GTP (300 µM). c Absorbance of CuI-titrated Bca (1.0 mM) in competition with CobW (20 µM) in the presence of MgII (2.7 mM) and GTP (200 µM). In ac, solid traces show curve fits of experimental data to models where CobW binds one molar equivalent of metal per protein monomer. Supplementary Table 2 contains mean ± standard deviation (SD) Kmetal values from n = 3 independent experiments (full details in Supplementary Figs. 8–12 and Supplementary Table 1). In b, c, dashed lines show simulated responses for Kmetal tenfold tighter or weaker than the fitted value. d Absorbance (relative to probe-free solution) upon titration of ZnII into a mixture of quin-2 (10 µM), MgII (2.7 mM), GTP (100 µM) and CobW (10 µM).
Fig. 4
Fig. 4. MgIIGTP-CobW binds ZnII with sub-picomolar affinity.
a Representation of the equilibrium for exchange of CoII and ZnII between ligand (L = NTA) and protein (P = MgIIGTP-CobW). be Absorbance (relative to metal-free solution) of solutions of CobW (17.9–20.4 µM), MgII (2.7 mM), GTP (200 µM) and NTA (0.4–4.0 mM) upon (bd) first addition of CoII (black trace) then ZnII (blue trace) or (e) the reverse, at equilibrium (n = 1 for each panel). The absorbance peak at 339 nm corresponds to CoII-bound protein. An excess of ligand NTA was used to buffer both metals in each experiment: varying the ratios of ligand-bound metal ions ([CoIINTA]/[ZnIINTA] = 28–167) shifted the ratios of CoII- and ZnII-bound protein as predicted by the equilibrium exchange constant in a. Consistent KZn(II) values for MgIIGTP-CobW were generated at all tested conditions (Supplementary Table 4). Dashed red lines show expected A339 nm peak intensities for KZn(II) of MgIIGTP-CobW tenfold tighter or weaker than calculated values.
Fig. 5
Fig. 5. MgIIGTP-CobW is predicted to acquire CoII or ZnII in a bacterial cell.
Free-energy change (ΔG) for metal binding to MgIIGTP-CobW (red circles) plotted against the intracellular available free energies for metal binding in a reference bacterial cytosol (values correspond to Salmonella) under idealised conditions (i.e. where each metal sensor undergoes half of its transcriptional response; black squares). Intracellular available ΔGZn(II) is the mean of the values determined from the two ZnII sensors ZntR (a) and Zur (b). Bars show the change in intracellular available ΔG as cognate sensors shifts from 10–90% of their responses. Free energy differences (ΔΔG) which favour acquisition of metals by MgIIGTP-CobW in vivo are indicated in blue. ΔG values for CoII complexes of CobW alone (open red triangle) and MgIIGDP-CobW (closed red triangle) are also shown. For FeII binding to MgIIGTP-CobW, arrow indicates limiting ΔG > −34.2 kJ mol−1.
Fig. 6
Fig. 6. MgIIGTP-YeiR and MgIIGTP-YjiA preferentially acquire ZnII.
a Free-energy change (ΔG) for metal binding to MgIIGTP-YeiR (red circles) plotted against the intracellular available free energies for metal binding (as described in Fig. 5; black squares and bars). b As a for MgIIGTPγS-YjiA (red circles). Arrows indicate where only a limiting ΔG was determined (thus ΔG > plotted value).
Fig. 7
Fig. 7. MgIIGTP-CobW outcompetes MgIIGTP-YeiR for CoII.
Elution profile of YeiR (10 μM), CobW (10 μM) or both proteins following incubation with GTP (100 μM), MgII (2.7 mM) and CoII (8 μM) resolved by differential elution from an anion exchange column. Fractions were analysed for CoII by ICP-MS and protein by SDS-PAGE (YeiR alone black, CobW alone blue, both proteins red; n = 1). Arrow denotes flow through fractions. Full gel images and SDS-PAGE analysis of flow through fractions shown in Supplementary Fig. 26.
Fig. 8
Fig. 8. Calculations of conditional CoII availabilities in B12-producing E. coli*.
a Calculated relationship between intracellular CoII availability and normalised DNA occupancy (θD) by RcnR. θD of 0 and 1 are the maximum and minimum calculated DNA occupancies. The dynamic range (within which RcnR responds to changing intracellular CoII availability) has been defined as θD of 0.01–0.99 (i.e. 1–99% of RcnR response). The calibrated maximum and minimum fold changes in rcnA transcript abundance (i.e. boundary conditions, see Supplementary Fig. 27) therefore correspond to θD of 0.01 and 0.99 in these calculations (red circles). θD for each growth condition (black circles) was calculated from the qPCR response in b, assuming a linear relationship between change in θD and change in transcript abundance (Eq. (10)). Corresponding CoII availabilities are listed in Supplementary Table 8. b Transcript abundance (relative to untreated control) of the RcnR-regulated gene rcnA following 1 h exposure of E. coli* to increasing [CoII], measured by qPCR. Data are the mean ± SD of n = 3 biologically independent replicates. Triangle shapes represent individual experiments (some data points overlap, experimental values are available in Source Data files).
Fig. 9
Fig. 9. B12 production follows predicted metalation of MgIIGTP-CobW.
a Predicted metalation of MgIIGTP-CobW with CoII and ZnII (open and grey bars, respectively) in samples treated with defined media [CoII]. Intracellular ΔGCo(II) for each condition was calculated from rcnA expression (Fig. 8 and Supplementary Table 8). b B12 produced by E. coli* strains with and without cobW (open and grey bars, respectively) following 4 h exposure to defined [CoII]. B12 was detected using a Salmonella AR2680 bioassay (detects corrins, expected to be predominantly B12; see “Methods”) and quantified by automated analysis of growth areas (Supplementary Fig. 29 and Supplementary Software 1). Inset shows original image and detected areas (each false coloured) for representative (n = 3) bioassay plate of B12 calibration standards. All data are the mean ± SD of n = 3 biologically independent replicates (with errors in a propagated from qPCR data in Fig. 8b). Triangles represent individual experiments (some data points overlap, experimental values are available in Source Data files).

References

    1. Foster AW, Osman D, Robinson NJ. Metal preferences and metallation. J. Biol. Chem. 2014;289:28095–28103. doi: 10.1074/jbc.R114.588145. - DOI - PMC - PubMed
    1. Irving H, Williams RJP. Order of stability of metal complexes. Nature. 1948;162:746–747. doi: 10.1038/162746a0. - DOI
    1. Martin ME, et al. A Streptococcus mutans superoxide dismutase that is active with either manganese or iron as a cofactor. J. Biol. Chem. 1986;261:9361–9367. doi: 10.1016/S0021-9258(18)67663-X. - DOI - PubMed
    1. Culotta VC, Yang M, O’Halloran TV. Activation of superoxide dismutases: putting the metal to the pedal. Biochim. Biophys. Acta Mol. Cell Res. 2006;1763:747–758. doi: 10.1016/j.bbamcr.2006.05.003. - DOI - PMC - PubMed
    1. Ranquet C, Ollagnier-de-Choudens S, Loiseau L, Barras F, Fontecave M. Cobalt stress in Escherichia coli: the effect on the iron-sulfur proteins. J. Biol. Chem. 2007;282:30442–30451. doi: 10.1074/jbc.M702519200. - DOI - PubMed

Publication types

LinkOut - more resources