. 2021 Feb 19;11(1):4232.
doi: 10.1038/s41598-021-82707-1.

Effects of maoto (ma-huang-tang) on host lipid mediator and transcriptome signature in influenza virus infection

Affiliations

Effects of maoto (ma-huang-tang) on host lipid mediator and transcriptome signature in influenza virus infection

Akinori Nishi et al. Sci Rep. .

Abstract

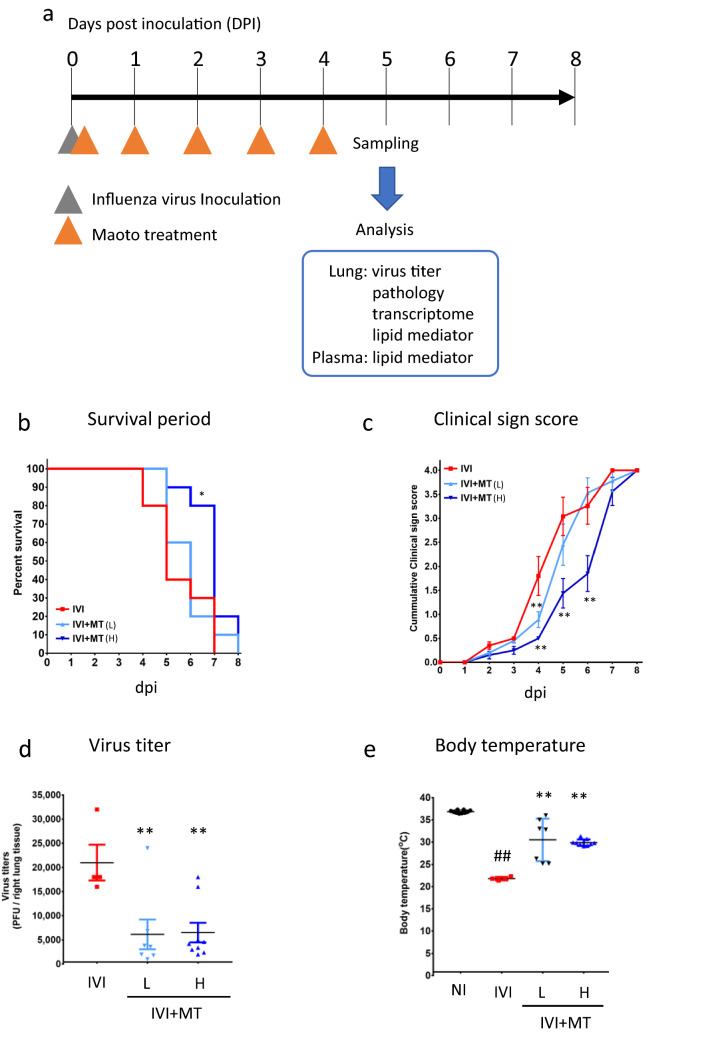
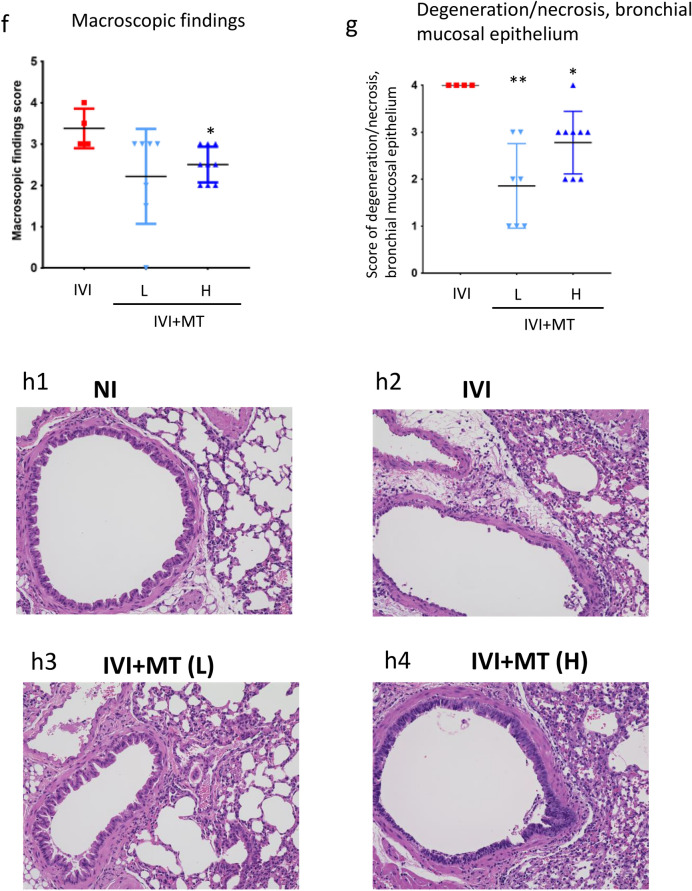
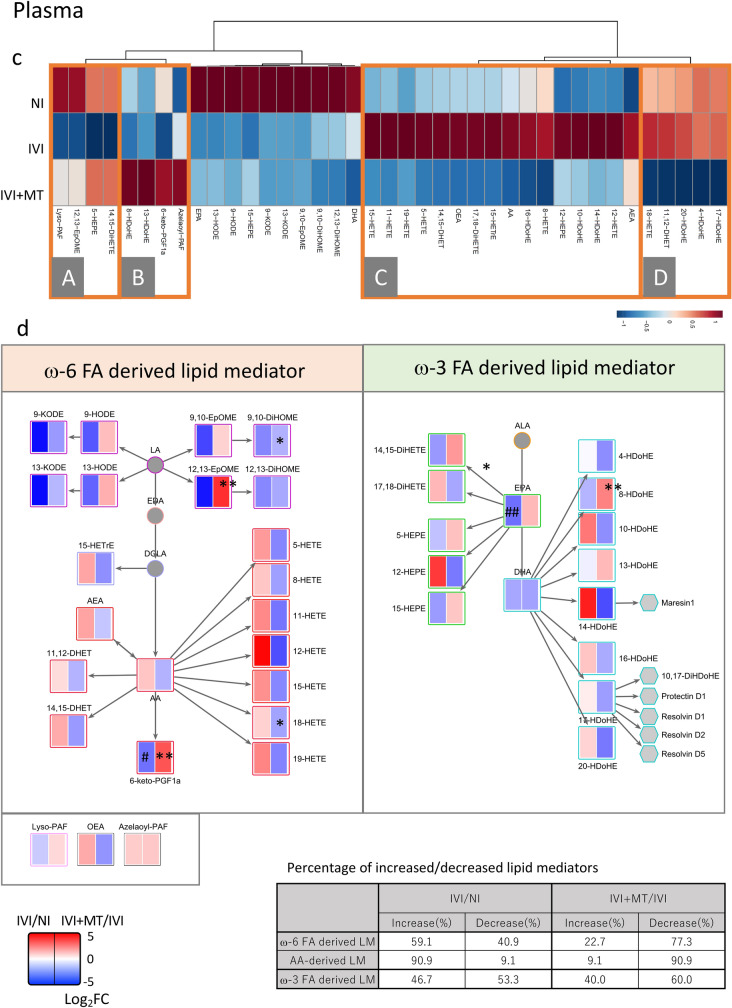
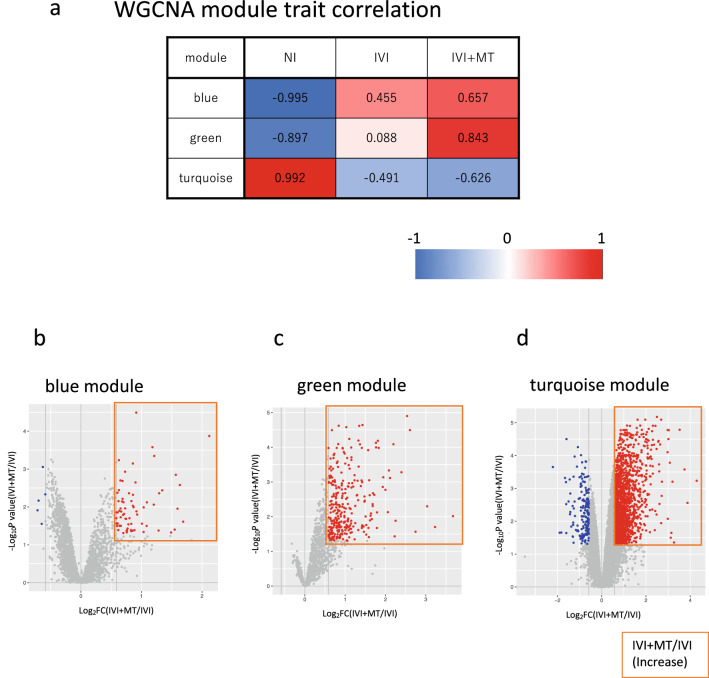
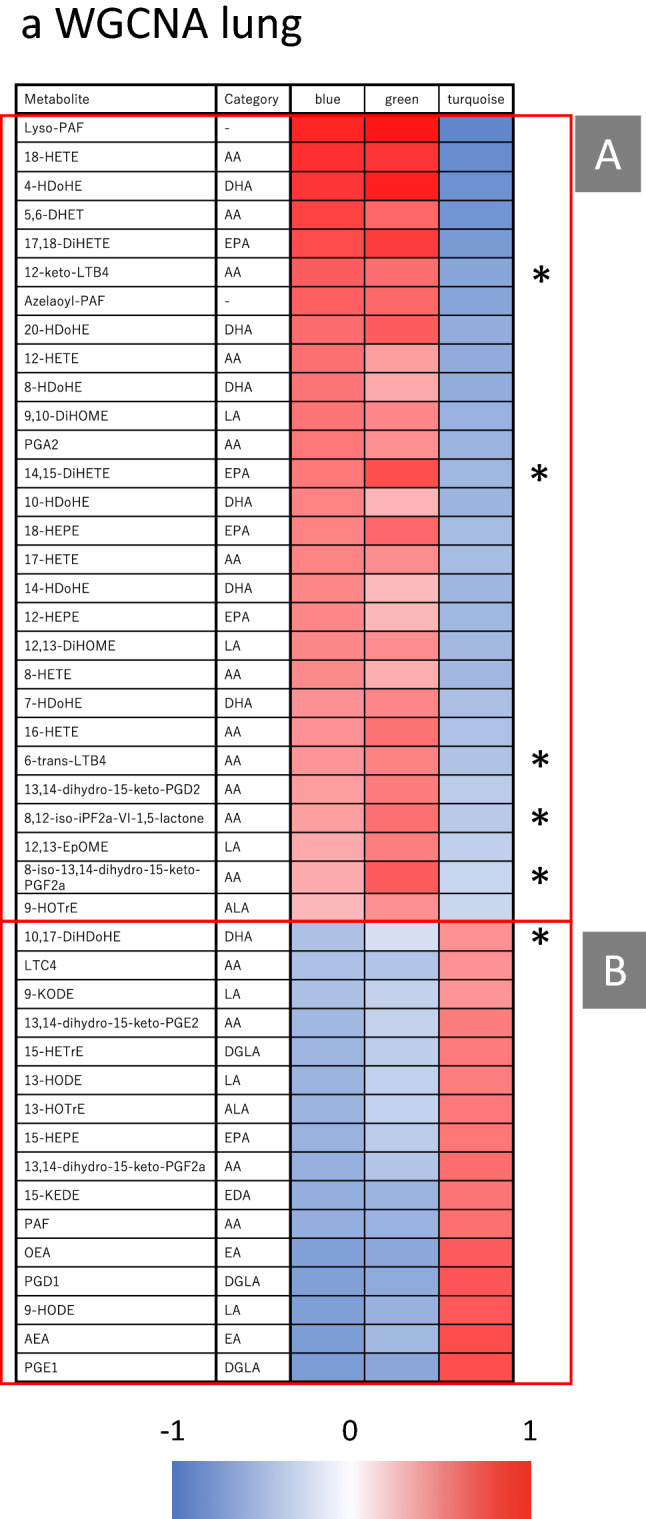
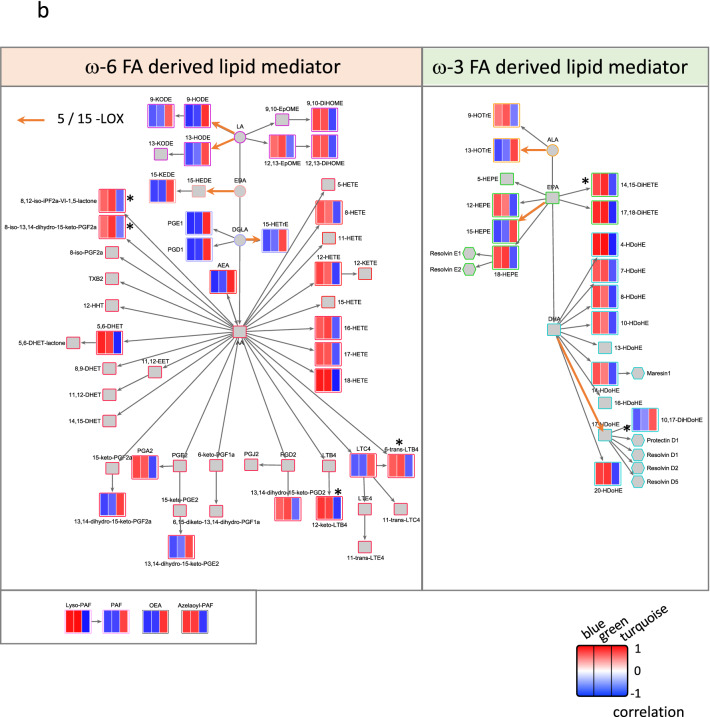
Maoto, a traditional kampo medicine, has been clinically prescribed for influenza infection and is reported to relieve symptoms and tissue damage. In this study, we evaluated the effects of maoto as an herbal multi-compound medicine on host responses in a mouse model of influenza infection. On the fifth day of oral administration to mice intranasally infected with influenza virus [A/PR/8/34 (H1N1)], maoto significantly improved survival rate, decreased viral titer, and ameliorated the infection-induced phenotype as compared with control mice. Analysis of the lung and plasma transcriptome and lipid mediator metabolite profile showed that maoto altered the profile of lipid mediators derived from ω-6 and ω-3 fatty acids to restore a normal state, and significantly up-regulated the expression of macrophage- and T-cell-related genes. Collectively, these results suggest that maoto regulates the host's inflammatory response by altering the lipid mediator profile and thereby ameliorating the symptoms of influenza.


Conflict of interest statement

A. N., N.K., C.S., K. Oh., S. I., A.S., K. Og. and M. Y. are employed by Tsumura & Co. H. Ku., S. N., A. Y., Y. M., and H. Ki. have financial interests in Tsumura & Co. relevant to this research. The authors declare no competing interests.

Figures

Figure 1
Figure 1
Effect of maoto on a mouse model of influenza virus infection. (a) Experimental protocol. Influenza virus was administered to mice by intranasal inoculation. Maoto (MT; 0.5 or 2 g/10 mL/kg) was orally administered 1 h after inoculation, and continued for 4 days (5 days treatment in total). Mice with no virus inoculation were used as a control against the infection, and infected mice treated distilled water were used as infected control mice. Data from 10 mice each in the influenza virus inoculation (IVI) control group, IVI with maoto 0.5 g/kg treatment [IVI + MT(L)] group, and IVI with maoto 2 g/kg treatment [IVI + MT(H)] group were used to determine the average survival period. Another 10 mice each in the no-inoculation (NI), IVI, IVI + MT(L), and IVI + MT(H) groups were sacrificed at 5 days post inoculation (dpi) to collect tissue and plasma samples for analysis of viral titer and histopathology. In addition, lipid mediator and transcriptome analysis were performed for the NI, IVI and IVI + MT(H) groups. At 5 dpi, the number of surviving mice were 10, 4, 7, and 9 in the NI, IVI, IVI + MT(L), and IVI + MT(H) groups, respectively. (b) Survival period (dpi). (c) Clinical sign score (dpi). (d) Viral titer. (e) Body temperature. (f) Macroscopic findings. (g) Histopathological score for degeneration and necrosis of bronchial mucosal epithelium. (h) Histopathological images of mouse lung tissue with hematoxylin–eosin staining (× 20). (h1) NI; (h2) IVI; (h3) IVI + MT(L); (h4) IVI + MT(H). * P < 0.01, ** P < 0.05 versus IVI by Log-rank test for survival period, by Mann–Whitney U test with Bonferroni’s multiple comparisons for clinical sign score, macroscopic findings, and histopathological score; and by Welch’s t-test with Bonferroni’s multiple comparisons for viral titer and body temperature.
Figure 1
Figure 1
Effect of maoto on a mouse model of influenza virus infection. (a) Experimental protocol. Influenza virus was administered to mice by intranasal inoculation. Maoto (MT; 0.5 or 2 g/10 mL/kg) was orally administered 1 h after inoculation, and continued for 4 days (5 days treatment in total). Mice with no virus inoculation were used as a control against the infection, and infected mice treated distilled water were used as infected control mice. Data from 10 mice each in the influenza virus inoculation (IVI) control group, IVI with maoto 0.5 g/kg treatment [IVI + MT(L)] group, and IVI with maoto 2 g/kg treatment [IVI + MT(H)] group were used to determine the average survival period. Another 10 mice each in the no-inoculation (NI), IVI, IVI + MT(L), and IVI + MT(H) groups were sacrificed at 5 days post inoculation (dpi) to collect tissue and plasma samples for analysis of viral titer and histopathology. In addition, lipid mediator and transcriptome analysis were performed for the NI, IVI and IVI + MT(H) groups. At 5 dpi, the number of surviving mice were 10, 4, 7, and 9 in the NI, IVI, IVI + MT(L), and IVI + MT(H) groups, respectively. (b) Survival period (dpi). (c) Clinical sign score (dpi). (d) Viral titer. (e) Body temperature. (f) Macroscopic findings. (g) Histopathological score for degeneration and necrosis of bronchial mucosal epithelium. (h) Histopathological images of mouse lung tissue with hematoxylin–eosin staining (× 20). (h1) NI; (h2) IVI; (h3) IVI + MT(L); (h4) IVI + MT(H). * P < 0.01, ** P < 0.05 versus IVI by Log-rank test for survival period, by Mann–Whitney U test with Bonferroni’s multiple comparisons for clinical sign score, macroscopic findings, and histopathological score; and by Welch’s t-test with Bonferroni’s multiple comparisons for viral titer and body temperature.
Figure 2
Figure 2
Clustering analysis and metabolic pathway mapping of lipid mediators in lung and plasma. (a) Clustering analysis in lung. A–D show specific clusters of lipid mediators that were altered by maoto (MT) relative to IVI. (b) Pathway mapping of lipid mediators in lung. Log2 fold changes (log2FC) in detected lipid mediators for IVI/NI (left column) and IVI + MT/IVI (right column) were mapped on the metabolic pathway. The percentage of increased or decreased lipid mediators for IVI/NI and IVI + MT/IVI is summarized in the table. (c) Clustering analysis in plasma. A–D show the specific cluster of lipid mediators that were altered by MT relative to IVI. (d) Pathway mapping of lipid mediators in plasma. The log2FC in detected lipid mediators for IVI/NI (left column) and IVI + MT/IVI (right column) were mapped on the metabolic pathway. To show the related pathway of specialized pro-resolving mediators (SPMs), undetected SPMs were included on the pathway as hexagons. The percentage of increased or decreased lipid mediators for IVI/NI and IVI + MT/IVI is summarized in the table. For clustering analysis, the data were normalized and standardized by autoscale for metabolites. Euclidean distance was used for the distance measure, and Ward’s method was used for the clustering algorithm. *P < 0.05, **P < 0.01 versus IVI. ##P < 0.01 versus NI. *P < 0.05, **P < 0.01 versus IVI. #P < 0.05, ##P < 0.01 versus NI.
Figure 2
Figure 2
Clustering analysis and metabolic pathway mapping of lipid mediators in lung and plasma. (a) Clustering analysis in lung. A–D show specific clusters of lipid mediators that were altered by maoto (MT) relative to IVI. (b) Pathway mapping of lipid mediators in lung. Log2 fold changes (log2FC) in detected lipid mediators for IVI/NI (left column) and IVI + MT/IVI (right column) were mapped on the metabolic pathway. The percentage of increased or decreased lipid mediators for IVI/NI and IVI + MT/IVI is summarized in the table. (c) Clustering analysis in plasma. A–D show the specific cluster of lipid mediators that were altered by MT relative to IVI. (d) Pathway mapping of lipid mediators in plasma. The log2FC in detected lipid mediators for IVI/NI (left column) and IVI + MT/IVI (right column) were mapped on the metabolic pathway. To show the related pathway of specialized pro-resolving mediators (SPMs), undetected SPMs were included on the pathway as hexagons. The percentage of increased or decreased lipid mediators for IVI/NI and IVI + MT/IVI is summarized in the table. For clustering analysis, the data were normalized and standardized by autoscale for metabolites. Euclidean distance was used for the distance measure, and Ward’s method was used for the clustering algorithm. *P < 0.05, **P < 0.01 versus IVI. ##P < 0.01 versus NI. *P < 0.05, **P < 0.01 versus IVI. #P < 0.05, ##P < 0.01 versus NI.
Figure 3
Figure 3
Weighted gene co-expression network analysis (WGCNA). (a) Correlation between module and trait. (bd) Volcano plot for comparing gene expression between IVI + MT and IVI in the blue, green, and turquoise modules. Blue indicates a significant decrease in gene expression in IVI + MT relative to IVI at P < 0.05 and fold change (FC) < 0.67; red indicates a significant increase in gene expression in IVI + MT relative to IVI at P < 0.05 and FC > 1.5. (e) Summary of cell type enrichment analysis (CTen). –log10 Benjamini–Hochberg adjusted P > 2 was considered to be significant. For each module, the left column shows the results using all genes in the module; the right column shows the results using genes significantly increased by MT relative to IVI. (f) Pathway enrichment analysis of differentially expressed genes between IVI and NI in the blue (FDR < 0.05) (f1) and green (major top 7 pathways with FDR < 0.05) (f2) modules. The gene sets significantly increased by IVI relative to NI at criteria of P < 0.05 and log2FC > 3 were used for analysis. (g) Pathway enrichment analysis of differentially expressed genes between IVI + MT and IVI in the green (FDR < 0.05) (g1) and turquoise (FDR < 0.05) (g2) modules. The gene sets significantly increased by MT relative to IVI at criteria of P < 0.05 and FC > 1.5 were used for analysis.
Figure 3
Figure 3
Weighted gene co-expression network analysis (WGCNA). (a) Correlation between module and trait. (bd) Volcano plot for comparing gene expression between IVI + MT and IVI in the blue, green, and turquoise modules. Blue indicates a significant decrease in gene expression in IVI + MT relative to IVI at P < 0.05 and fold change (FC) < 0.67; red indicates a significant increase in gene expression in IVI + MT relative to IVI at P < 0.05 and FC > 1.5. (e) Summary of cell type enrichment analysis (CTen). –log10 Benjamini–Hochberg adjusted P > 2 was considered to be significant. For each module, the left column shows the results using all genes in the module; the right column shows the results using genes significantly increased by MT relative to IVI. (f) Pathway enrichment analysis of differentially expressed genes between IVI and NI in the blue (FDR < 0.05) (f1) and green (major top 7 pathways with FDR < 0.05) (f2) modules. The gene sets significantly increased by IVI relative to NI at criteria of P < 0.05 and log2FC > 3 were used for analysis. (g) Pathway enrichment analysis of differentially expressed genes between IVI + MT and IVI in the green (FDR < 0.05) (g1) and turquoise (FDR < 0.05) (g2) modules. The gene sets significantly increased by MT relative to IVI at criteria of P < 0.05 and FC > 1.5 were used for analysis.
Figure 4
Figure 4
Correlation between gene expression networks and the lipid mediator profile. (a) Correlation between modules detected by WGCNA (blue, green, and turquoise) and lipid mediator profile. Correlations between the gene expression profile and the lipid mediator profile, which was used as trait, were analyzed by WGCNA. Asterisks indicate lipid mediators that were significantly altered by MT relative to IVI. (b) Pathway mapping of lipid mediators in lung. The WGCNA correlation score of the blue (left column), green (middle column), and turquoise (right column) modules of detected lipid mediators were mapped on the metabolic pathway. Lipid mediators that were detected but not included in the WGCNA modules are indicated by small grey-filled squares. *P < 0.05 for IVI + MT versus IVI by Welch’s t-test with Bonferroni’s multiple comparisons.
Figure 4
Figure 4
Correlation between gene expression networks and the lipid mediator profile. (a) Correlation between modules detected by WGCNA (blue, green, and turquoise) and lipid mediator profile. Correlations between the gene expression profile and the lipid mediator profile, which was used as trait, were analyzed by WGCNA. Asterisks indicate lipid mediators that were significantly altered by MT relative to IVI. (b) Pathway mapping of lipid mediators in lung. The WGCNA correlation score of the blue (left column), green (middle column), and turquoise (right column) modules of detected lipid mediators were mapped on the metabolic pathway. Lipid mediators that were detected but not included in the WGCNA modules are indicated by small grey-filled squares. *P < 0.05 for IVI + MT versus IVI by Welch’s t-test with Bonferroni’s multiple comparisons.

References

    1. Iuliano AD, et al. Estimates of global seasonal influenza-associated respiratory mortality: A modelling study. Lancet. 2018;391:1285–1300. doi: 10.1016/S0140-6736(17)33293-2. - DOI - PMC - PubMed
    1. Uyeki TM, et al. Clinical practice guidelines by the infectious diseases society of America: 2018 update on diagnosis, treatment, chemoprophylaxis, and institutional outbreak management of seasonal influenzaa. Clin. Infect. Dis. 2019;68:e1–e47. doi: 10.1093/cid/ciy866. - DOI - PMC - PubMed
    1. Salomon R, Webster RG. The influenza virus enigma. Cell. 2009;136:402–410. doi: 10.1016/j.cell.2009.01.029. - DOI - PMC - PubMed
    1. Tam VC, et al. Lipidomic profiling of influenza infection identifies mediators that induce and resolve inflammation. Cell. 2013;154:213–227. doi: 10.1016/j.cell.2013.05.052. - DOI - PMC - PubMed
    1. Morita M, et al. The lipid mediator protectin D1 inhibits influenza virus replication and improves severe influenza. Cell. 2013;153:112–125. doi: 10.1016/j.cell.2013.02.027. - DOI - PubMed

Publication types

MeSH terms