. 2021 Feb 19;11(1):4225.
doi: 10.1038/s41598-021-83379-7.

One-carbon pathway and cognitive skills in children with Down syndrome

Affiliations

One-carbon pathway and cognitive skills in children with Down syndrome

Francesca Antonaros et al. Sci Rep. .

Abstract

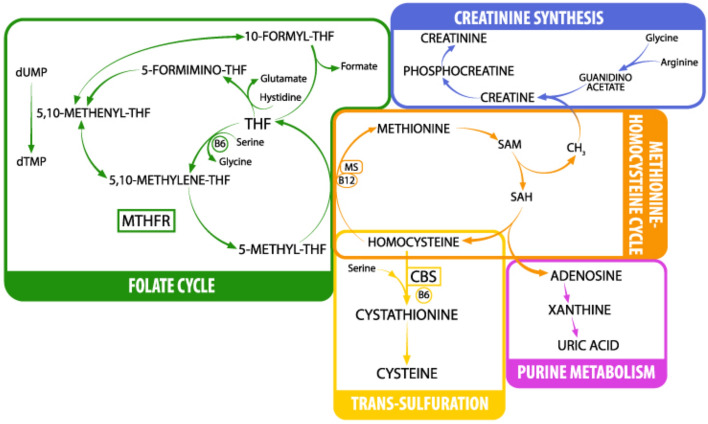
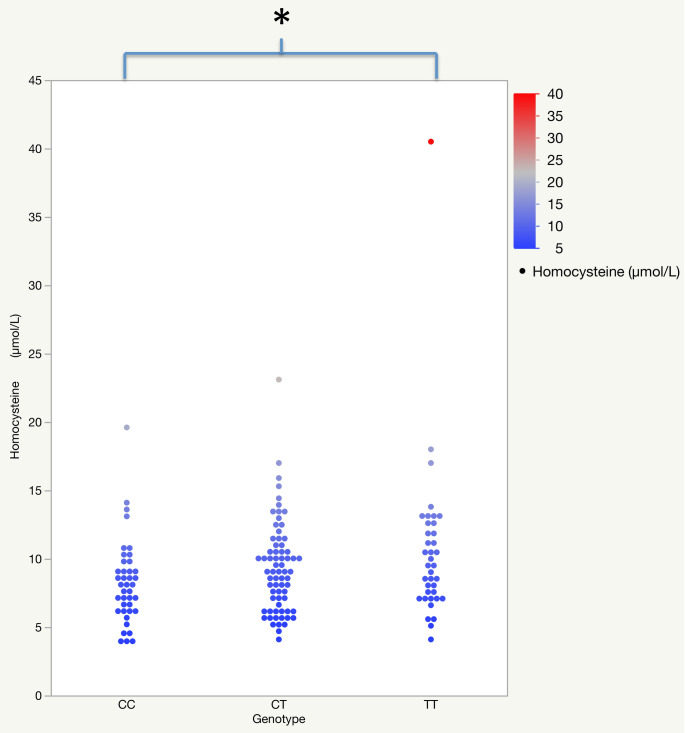
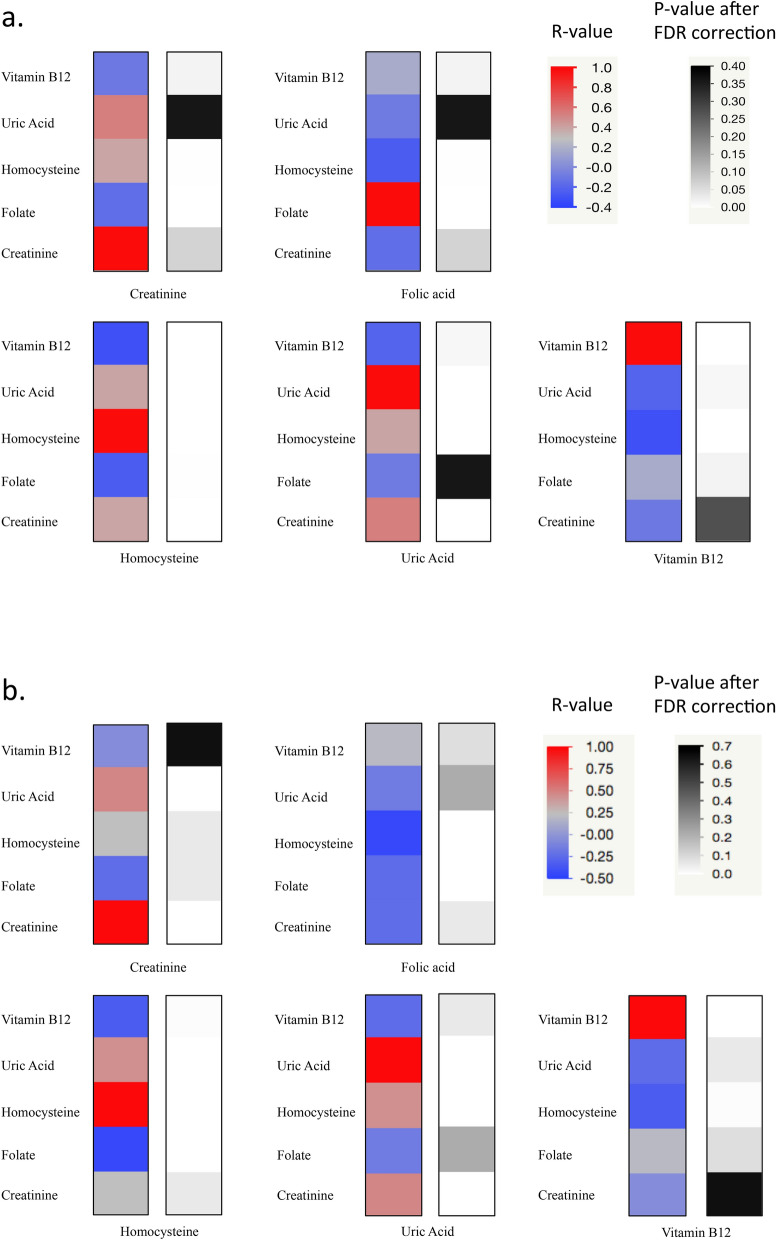
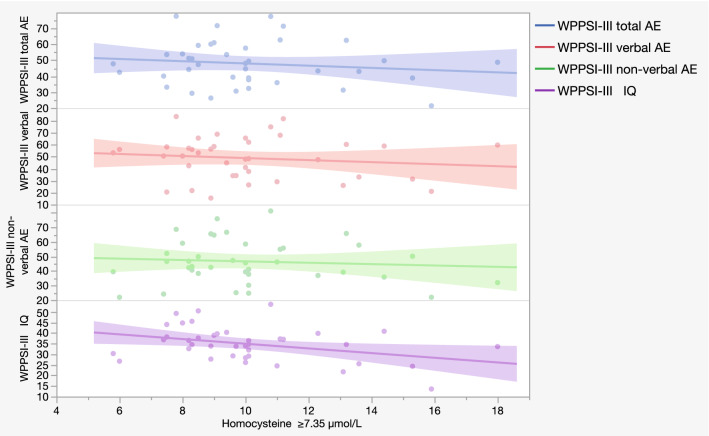
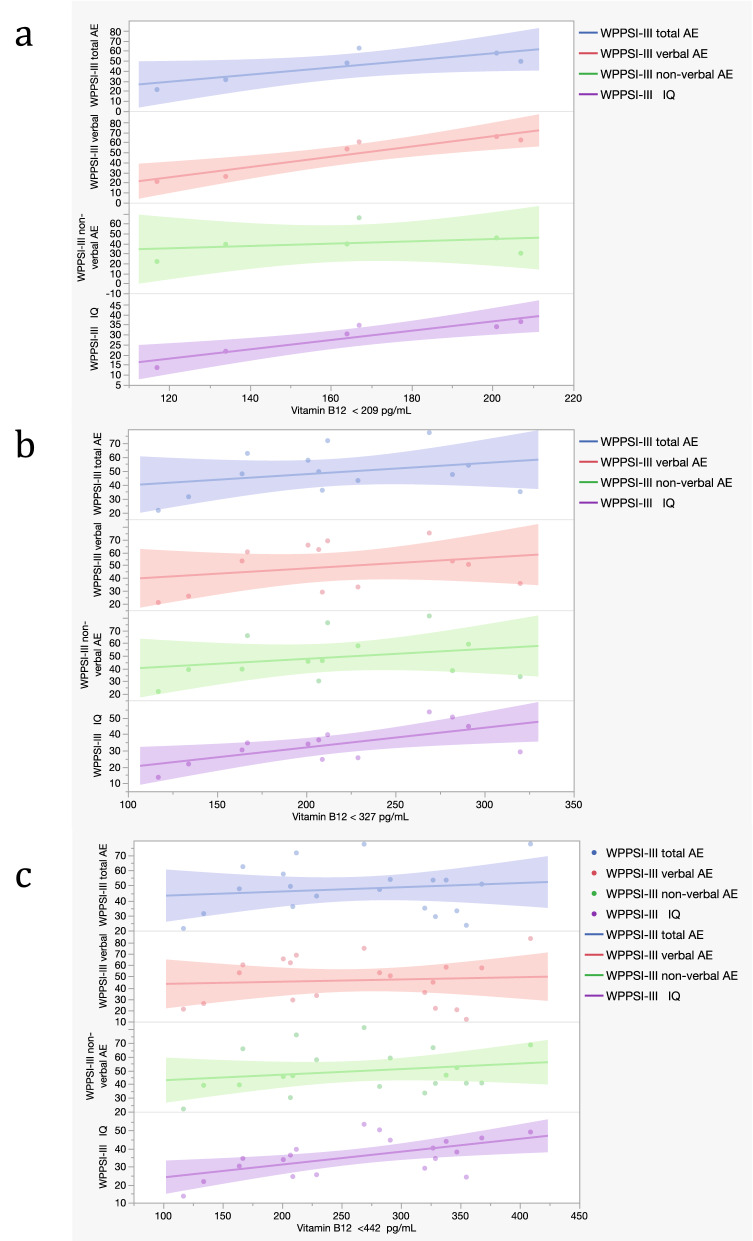
This work investigates the role of metabolite levels in the intellectual impairment of subjects with Down syndrome (DS). Homocysteine, folate, vitamin B12, uric acid (UA), creatinine levels and MTHFR C677T genotype were analyzed in 147 subjects with DS. For 77 subjects, metabolite levels were correlated with cognitive tests. Griffiths-III test was administered to 28 subjects (3.08-6.16 years) and WPPSI-III test was administered to 49 subjects (7.08-16.08 years). Significant correlations were found among some metabolite levels and between homocysteine levels and MTHFR C677T genotype. Moreover, homocysteine, UA and creatinine levels resulted increased with age. We did not find any correlation between metabolites and cognitive test score in the younger group. Homocysteine showed statistically significant correlation with WPPSI-III subtest scores when its level is ≥ 7.35 µmol/L, remaining correlated in higher thresholds only for non-verbal area scores. Vitamin B12 showed correlations with all WPPSI-III subtest scores when its level is < 442 pg/mL. The relevance of the present findings is the detection of a specific metabolite threshold related with a better or worse cognitive score, suggesting that vitamin B12 and homocysteine may have a role in cognitive development in children with DS.


Conflict of interest statement

The authors declare no competing interests.

Figures

Figure 1
Figure 1
One-carbon metabolism. THF tetrahydrofolate, dUMP deoxyuridine monophosphate, dTMP deoxythymidine monophosphate, MTHFR methylene-tetrahydrofolate reductase, MS methionine synthase, SAM S-adenosylmethionine, SAH S-adenosylhomocysteine, CBS cystathionine beta-synthase. Image by Marcello Fedi.
Figure 2
Figure 2
The variance of homocysteine level related to MTHFR genotype groups. One-way ANOVA analysis to compare Hcy concentrations among the three groups of MTHFR C677T genotype. The analysis includes outliers. *p-value =  0.035.
Figure 3
Figure 3
Heat Map of the metabolite level correlations among each other. (a) Partial correlation controlled by age at blood draw between the metabolite levels among each other. The analysis includes outliers. (b) Partial correlation controlled by age at blood draw between the metabolite levels among each other. The analysis excludes strong outliers.
Figure 4
Figure 4
Scatter plot of the main correlation between homocysteine levels and WPPSI-III test scores. Correlation between homocysteine ≥ 7.35 µmol/L (H = High group of 25th percentile threshold) and WPPSI-III non-verbal AE scores, verbal AE scores, total AE scores and IQ scores of 37 subjects. Each dot represents a sample subject. Each line represents a correlation analyzed.
Figure 5
Figure 5
Scatter plot representing correlations between vitamin B12 and cognitive scores in the WPPSI-III group. (a) Correlations between vitamin B12 < 209 pg/mL (L group of 25th percentile threshold; 6 subjects) and WPPSI-III subtests scores. (b) Correlations between vitamin B12 < 327 pg/mL (L group of 50th percentile threshold; 13 subjects) and WPPSI-III subtests scores. (c) Correlations between vitamin B12 < 442 pg/mL (L group of 75th percentile threshold; 20 subjects) and WPPSI-III subtests scores (see Supplementary Table S3). Each dot represents a sample subject. Each line represents a correlation analyzed.

References

    1. Lejeune J, Gauthier M, Turpin R. Human chromosomes in tissue cultures. Comptes rendus hebdomadaires des seances de l'Academie des sciences. 1959;248:602–603. - PubMed
    1. Pelleri MC, et al. Partial trisomy 21 map: Ten cases further supporting the highly restricted Down syndrome critical region (HR-DSCR) on human chromosome 21. Mol. Genet. Genomic Med. 2019;7:e797. doi: 10.1002/mgg3.797. - DOI - PMC - PubMed
    1. Pelleri MC, et al. Integrated quantitative transcriptome maps of human trisomy 21 tissues and cells. Front. Genet. 2018;9:125. doi: 10.3389/fgene.2018.00125. - DOI - PMC - PubMed
    1. Strippoli P, et al. State of the Art of Research on Down Syndrome. Cambridge: Academic Press; 2019. pp. 1–39.
    1. Caracausi M, et al. Plasma and urinary metabolomic profiles of Down syndrome correlate with alteration of mitochondrial metabolism. Sci. Rep. 2018;8:2977. doi: 10.1038/s41598-018-20834-y. - DOI - PMC - PubMed

Publication types