. 2021 Feb 19;13(4):4850-4880.
doi: 10.18632/aging.202693. Epub 2021 Feb 19.

Metabolic footprint of aging and obesity in red blood cells

Affiliations

Metabolic footprint of aging and obesity in red blood cells

Inés Domingo-Ortí et al. Aging (Albany NY). .

Abstract

Aging is a physiological process whose underlying mechanisms are still largely unknown. The study of the biochemical transformations associated with aging is crucial for understanding this process and could translate into an improvement of the quality of life of the aging population. Red blood cells (RBCs) are the most abundant cells in humans and are involved in essential functions that could undergo different alterations with age. The present study analyzed the metabolic alterations experienced by RBCs during aging, as well as the influence of obesity and gender in this process. To this end, the metabolic profile of 83 samples from healthy and obese patients was obtained by Nuclear Magnetic Resonance spectroscopy. Multivariate statistical analysis revealed differences between Age-1 (≤45) and Age-2 (>45) subgroups, as well as between BMI-1 (<30) and BMI-2 (≥30) subgroups, while no differences were associated with gender. A general decrease in the levels of amino acids was detected with age, in addition to metabolic alterations of glycolysis, the pentose phosphate pathway, nucleotide metabolism, glutathione metabolism and the Luebering-Rapoport shunt. Obesity also had an impact on the metabolomics profile of RBCs; sometimes mimicking the alterations induced by aging, while, in other cases, its influence was the opposite, suggesting these changes could counteract the adaptation of the organism to senescence.

Keywords: NMR; RBCs; aging; metabolomics; obesity.


Conflict of interest statement

CONFLICTS OF INTEREST: The authors declare that they have no conflicts of interest.

Figures

Figure 1
Figure 1
Representative 1H-NMR spectra corresponding to Age-1 and Age-2 groups. Spectral regions are widened to better appreciate changes in the levels of some metabolites. Metabolites in Age-1 and Age-2 spectra are negatively and positively associated with age, respectively. Assigned metabolites: 1 alanine, 2 adipate, 3 lysine, 4 acetate, 5 glutamate, 6 pyruvate, 7 glutamine, 8 betaine, 9 glycine, 10 6-phosphogluconate, 11 phosphoenolpyruvate, 12 inosine monophosphate, 13 formate, 14 NAD+.
Figure 2
Figure 2
OPLS-DA analysis of the metabolomic profile of RBCs of Age-1 (≤45 years) and Age-2 (>45 years) groups. (A) Score plot of the OPLS-DA model obtained. R2Y(cum)=0,675, Q2(cum)=0.208. Permutation test result: R2=(0.0, 0.249), Q2=(0.0, -0.276). CV-Anova: p-value=0.0388. (B) S-plot showing the most important metabolites contributing to the discrimination between the Age-1 and Age-2 groups. 2,3-BPG: 2,3-biphosphglycerate, 6-PG: 6-phosphogluconate, G1P: glucose 1-phosphate.
Figure 3
Figure 3
Main metabolomic pathways found in RBCs and summary of the most relevant age-associated metabolic alterations. Concentration values are normalized to total intensity. A1=between 19 and 40 years, A2 = between 40 and 60 years; and A3≥60years. Values are represented as mean±SEM. * p < 0.05, ** p < 0.01, *** p < 0.001, **** p < 0.0001. P-values were calculated with a Student’s t-test. 1,3BPG: 1,3-biphosphoglycerate, 2,3BPG: 2,3-biphosphoglycerate, 3PG: 3-phosphoglycerate, 6-PG: 6-phosphogluconate, ADP: adenosine diphosphate, Ala: alanine, Asn: Asparagine, ATP: adenosine triphosphate, BPG-deoxyHb: biphosphoglycerate-deoxyhemoglobin, Cys: cysteine, F6P: fructose 6-phosphate, F16BP: fructose 1,6-biphosphate, G6P: glucose 6-phosphate, G1P: glucose 1-phoshate, G3P: Glyceraldehyde 3-phosphate, Glu: glutamate, Gln: glutamine, GSH: reduced glutathione, GSSG: oxidized glutathione, IMP: inosine monophosphate, MetHb: methaemoglobin, NAD+: Nicotinamide adenine dinucleotide, NADP+: Nicotinamide adenine dinucleotide phosphate, P5C: 1-pyrroline-5-carboxylate, PEP: phosphoenopyruvate, Pro: proline, PRPP: phosphoribosyl pirophosphate, R-5-P: ribose 5-phosphate.
Figure 4
Figure 4
OPLS-DA analysis of the metabolomic profile of RBCs of BMI-1 (BMI<30) and BMI-2 (BMI≥30) groups. (A) Score plot of the OPLS-DA model obtained. R2Y(cum)=0.75, Q2(cum)=0.413. Permutation test result: R2=(0.0, 0.248), Q2=(0.0, -0.362). CV-Anova: p-value=0.000016. (B) S-plot showing the most important metabolites contributing to the discrimination between non-obese and obese subjects. G1P: glucose 1-phoshate, 2,3BPG: 2,3-biphosphoglycerate.
Figure 5
Figure 5
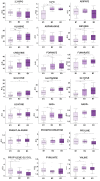
Box-plot comparison of the concentrations associated with the most relevant metabolites involved in the discrimination based on the BMI value. Metabolites that do not present statistically significant changes, but show clear trends with BMI, has been also included (NADP+, phenylalanine, phosphocreatine, asparagine). Concentration values are normalized to total intensity. Values are represented as mean±SEM. * p < 0.05, ** p < 0.01, *** p < 0.001. P-values were calculated with a Student’s t-test. For each box, the central line is the median, the edges of the box are the upper and lower quartiles, the whiskers extend the box by a further ±1.5 interquartile range (IQR) and outliers are plotted as individual points. 6-PG: 6-phosphogluconate, NAD+: Nicotinamide adenine dinucleotide NADP+: Nicotinamide adenine dinucleotide phosphate, 2,3-BPG: 2,3-biphosphoglycerate, G1P: Glucose 1-phosphate.
Figure 6
Figure 6
Box-plot comparison of the concentrations associated with the most relevant metabolites involved in the discrimination based on gender. Concentration values are normalized to total intensity. Values are represented as mean±SEM. * p < 0.05, ** p < 0.01, *** p < 0.001, **** p < 0.0001. P-values were calculated with a Student’s t-test. For each box, the central line is the median, the edges of the box are the upper and lower quartiles, the whiskers extend the box by a further ±1.5 interquartile range (IQR) and outliers are plotted as individual points. M: men, W: women, ATP: adenosine triphosphate.
Figure 7
Figure 7
PLS analysis vs age and BMI. (A) PLS model vs age in BMI-1 group (BMI<30; R2Y(cum)= 0.355, Q2(cum)=0.207), Permutation test result: R2=(0.0, 0.261), Q2=(0.0, -0.162), p from CV-ANOVA =0.084) and in BMI-2 subjects (BMI≥30; R2Y(cum)= 0.294, Q2(cum)=0.185), Permutation test result: R2=(0.0, 0.149), Q2=(0.0,-0.0799), p from CV-ANOVA =0.038). (B) PLS model vs BMI for Age-1 individuals. R2Y(cum)= 0.9, Q2(cum)= 0.649, p= 0.00036, Permutation test result: R2=(0.0, 0.647), Q2=(0.0,-0.286), p from CV-ANOVA =0.0041 (C) Heatmap representation of the metabolites with variable importance in projection (VIP) values > 1 of the PLS regression models vs age or BMI. 2,3-BPG: 2,3-biphoshoglycerate, 6-PG: 6-phosphogluconate, AMP: adenosine monophosphate, ATP: adenosine triphosphate, G1P: glucose 1-phosphate, IMP: inosine monophosphate, NAD+: Nicotinamide adenine dinucleotide, PEP: phosphoenolpyruvate.

Similar articles

Cited by

References

    1. United Nations. Department of Economic and Social Affairs. World population ageing 2019: Highlights. United Nations. Department of Economic and Social Affairs. 2019; 40–1307.
    1. Kerber RA, O’Brien E, Cawthon RM. Gene expression profiles associated with aging and mortality in humans. Aging Cell. 2009; 8:239–50. 10.1111/j.1474-9726.2009.00467.x - DOI - PMC - PubMed
    1. Jaul E, Barron J. Age-related diseases and clinical and public health implications for the 85 years old and over population. Front Public Health. 2017; 5:335. 10.3389/fpubh.2017.00335 - DOI - PMC - PubMed
    1. Lazarus NR, Harridge SD. The inherent human aging process and the facilitating role of exercise. Front Physiol. 2018; 9:1135. 10.3389/fphys.2018.01135 - DOI - PMC - PubMed
    1. Pamplona R, Barja G. An evolutionary comparative scan for longevity-related oxidative stress resistance mechanisms in homeotherms. Biogerontology. 2011; 12:409–35. 10.1007/s10522-011-9348-1 - DOI - PubMed

Publication types