. 2021 Jul;46(7):3105-3116.
doi: 10.1007/s00261-021-02965-5. Epub 2021 Feb 20.

Repeatability and accuracy of various region-of-interest sampling strategies for hepatic MRI proton density fat fraction quantification

Affiliations

Repeatability and accuracy of various region-of-interest sampling strategies for hepatic MRI proton density fat fraction quantification

Cheng William Hong et al. Abdom Radiol (NY). 2021 Jul.

Abstract

Purpose: To evaluate repeatability of ROI-sampling strategies for quantifying hepatic proton density fat fraction (PDFF) and to assess error relative to the 9-ROI PDFF.

Methods: This was a secondary analysis in subjects with known or suspected nonalcoholic fatty liver disease who underwent MRI for magnitude-based hepatic PDFF quantification. Each subject underwent three exams, each including three acquisitions (nine acquisitions total). An ROI was placed in each hepatic segment on the first acquisition of the first exam and propagated to other acquisitions. PDFF was calculated for each of 511 sampling strategies using every combination of 1, 2, …, all 9 ROIs. Intra- and inter-exam intra-class correlation coefficients (ICCs) and repeatability coefficients (RCs) were estimated for each sampling strategy. Mean absolute error (MAE) was estimated relative to the 9-ROI PDFF. Strategies that sampled both lobes evenly ("balanced") were compared with those that did not ("unbalanced") using two-sample t tests.

Results: The 29 enrolled subjects (23 male, mean age 24 years) had mean 9-ROI PDFF 11.8% (1.1-36.3%). With more ROIs, ICCs increased, RCs decreased, and MAE decreased. Of the 60 balanced strategies with 4 ROIs, all (100%) achieved inter- and intra-exam ICCs > 0.998, 55 (92%) achieved intra-exam RC < 1%, 50 (83%) achieved inter-exam RC < 1%, and all (100%) achieved MAE < 1%. Balanced sampling strategies had higher ICCs and lower RCs, and lower MAEs than unbalanced strategies in aggregate (p < 0.001 for comparisons between balanced vs. unbalanced strategies).

Conclusion: Repeatability improves and error diminishes with more ROIs. Balanced 4-ROI strategies provide high repeatability and low error.

Keywords: Hepatic PDFF; Hepatic fat quantification; QIB; Quantitative imaging biomarker; Region-of-interest; Repeatability; Sampling strategy.


Figures

Figure 1:
Figure 1:
Sampling strategy with 9 ROIs (yellow circles). An ROI is propagated onto each of the 9 hepatic segments on multiple slices through the liver on the PDFF map. Scale bar denotes a PDFF dynamic range of 0 – 50% for magnitude-based MRI due to fat-water ambiguity and the assumption that water is the dominant signal.
Figure 2:
Figure 2:
Schematic of the imaging protocol. Subjects were scanned in three separate exams, each of which had three acquisitions (nine acquisitions total). Intra-exam repeatability was computed from the three acquisitions of the first exam (dotted rectangle). Inter-exam repeatability was computed from the first acquisition of each exam (dashed rectangle). Accuracy was computed using all acquisitions (solid rectangle).
Figure 3:
Figure 3:
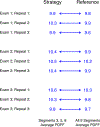
Illustration of the selection of paired data for the accuracy analysis, using the data from two study subjects and a sampling strategy which combines segments 3, 5, and 8. The subject in panel A has all 9 valid acquisitions. All nine strategy-reference data pairs are included in the computation of bias and MAE. The subject in panel B has missing data on multiple segments for acquisitions 2 and 3 of exam 3. Those acquisitions were excluded. Additionally, although this subject has valid measurements for segments 3, 5, and 8 on exam 2 acquisition 3, there is missing value for segment 7 and the reference average is incomplete. That acquisition is also excluded. This subject contributes 6 data pairs to the computation of bias and MAE.
Figure 3:
Figure 3:
Illustration of the selection of paired data for the accuracy analysis, using the data from two study subjects and a sampling strategy which combines segments 3, 5, and 8. The subject in panel A has all 9 valid acquisitions. All nine strategy-reference data pairs are included in the computation of bias and MAE. The subject in panel B has missing data on multiple segments for acquisitions 2 and 3 of exam 3. Those acquisitions were excluded. Additionally, although this subject has valid measurements for segments 3, 5, and 8 on exam 2 acquisition 3, there is missing value for segment 7 and the reference average is incomplete. That acquisition is also excluded. This subject contributes 6 data pairs to the computation of bias and MAE.
Figure 4:
Figure 4:
Box plots showing repeatability (y-axis) shown for sampling strategies by the number of ROIs used. Intra-exam repeatability assessed by ICC (A) and RC (B), as well as inter-exam repeatability assessed by ICC (C) and RC (D) are shown. In each subfigure, each dot represents a particular sampling strategy (510 subsets and the 9-ROI strategy). Strategies where the number of ROIs in the left and right hepatic lobes differed by no more than 1 (i.e. balanced) are color-coded in blue, strategies where the number of ROIs in the left and right hepatic lobes differed by 2 or more (i.e. unbalanced) are color-coded in red. The special case of strategies with a single ROI is color-coded in green. The thresholds of 0.998 for ICC and 1% for RC are illustrated by the dashed horizontal lines. Balanced strategies tended to achieve higher repeatability than unbalanced strategies.
Figure 4:
Figure 4:
Box plots showing repeatability (y-axis) shown for sampling strategies by the number of ROIs used. Intra-exam repeatability assessed by ICC (A) and RC (B), as well as inter-exam repeatability assessed by ICC (C) and RC (D) are shown. In each subfigure, each dot represents a particular sampling strategy (510 subsets and the 9-ROI strategy). Strategies where the number of ROIs in the left and right hepatic lobes differed by no more than 1 (i.e. balanced) are color-coded in blue, strategies where the number of ROIs in the left and right hepatic lobes differed by 2 or more (i.e. unbalanced) are color-coded in red. The special case of strategies with a single ROI is color-coded in green. The thresholds of 0.998 for ICC and 1% for RC are illustrated by the dashed horizontal lines. Balanced strategies tended to achieve higher repeatability than unbalanced strategies.
Figure 5:
Figure 5:
Box plot showing mean absolute error (y-axis) of each sampling strategy relative to the 9-ROI PDFF shown for sampling strategies by the number of ROIs used (x-axis). Each dot represents a particular sampling strategy (510 total). Strategies where the number of ROIs in the left and right hepatic lobes differed by no more than 1 (i.e. balanced) are color-coded in blue, strategies where the number of ROIs in the left and right hepatic lobes differed by 2 or more (i.e. unbalanced) are color-coded in red. The special case of strategies with a single ROI is color-coded in green. Balanced strategies tended to have lower mean absolute error than unbalanced strategies.
Figure 6:
Figure 6:
Box plot showing Bland-Altman bias (y-axis) of each sampling strategy relative to the 9-ROI PDFF shown for sampling strategies by the number of ROIs used (x-axis). Each dot represents a particular sampling strategy (510 total). Strategies where the number of ROIs in the left and right hepatic lobes differed by no more than 1 (i.e. balanced) are color-coded in blue, strategies where the number of ROIs in the left and right hepatic lobes differed by 2 or more (i.e. unbalanced) are color-coded in red. The special case of strategies with a single ROI is color-coded in green. Balanced strategies tended to bias closer to zero than unbalanced strategies.

Similar articles

Cited by

References

    1. Reeder SB, McKenzie CA, Pineda AR et al. (2007) Water–fat separation with IDEAL gradient-echo imaging. J Magn Reson Imaging 25:644–52. 10.1002/jmri.20831 - DOI - PubMed
    1. Reeder SB and Sirlin CB (2010) Quantification of liver fat with magnetic resonance imaging. Magn Reson Imaging Clin N Am 18:337–57, ix. 10.1016/j.mric.2010.08.013 - DOI - PMC - PubMed
    1. Reeder SB, Cruite I, Hamilton G and Sirlin CB (2011) Quantitative assessment of liver fat with magnetic resonance imaging and spectroscopy. J Magn Reson Imaging 34:729–49. 10.1002/jmri.22580 - DOI - PMC - PubMed
    1. Reeder SB, Hu HH and Sirlin CB (2012) Proton density fat-fraction: a standardized MR-based biomarker of tissue fat concentration. J Magn Reson Imaging 36:1011–4. 10.1002/jmri.23741 - DOI - PMC - PubMed
    1. Reeder SB, Pineda AR, Wen Z et al. (2005) Iterative decomposition of water and fat with echo asymmetry and least-squares estimation (IDEAL): Application with fast spin-echo imaging. Magn Reson Med 54:636–44. 10.1002/mrm.20624 - DOI - PubMed

Publication types