. 2021 Aug;74(2):704-722.
doi: 10.1002/hep.31755.

Microbiota-Driven Activation of Intrahepatic B Cells Aggravates NASH Through Innate and Adaptive Signaling

Affiliations

Microbiota-Driven Activation of Intrahepatic B Cells Aggravates NASH Through Innate and Adaptive Signaling

Fanta Barrow et al. Hepatology. 2021 Aug.

Abstract

Background and aims: Nonalcoholic steatohepatitis is rapidly becoming the leading cause of liver failure and indication for liver transplantation. Hepatic inflammation is a key feature of NASH but the immune pathways involved in this process are poorly understood. B lymphocytes are cells of the adaptive immune system that are critical regulators of immune responses. However, the role of B cells in the pathogenesis of NASH and the potential mechanisms leading to their activation in the liver are unclear.

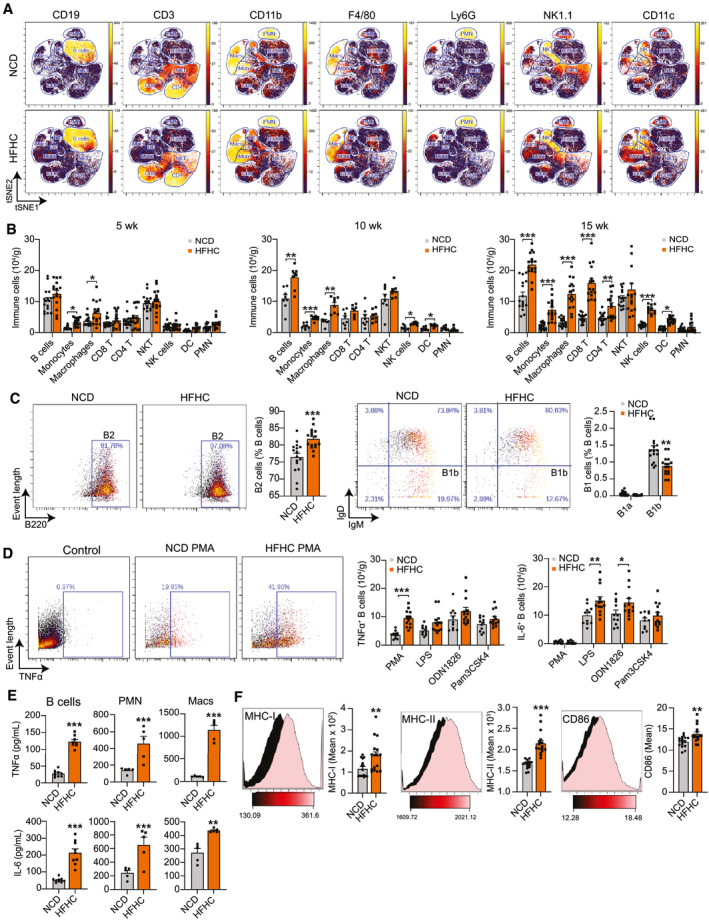
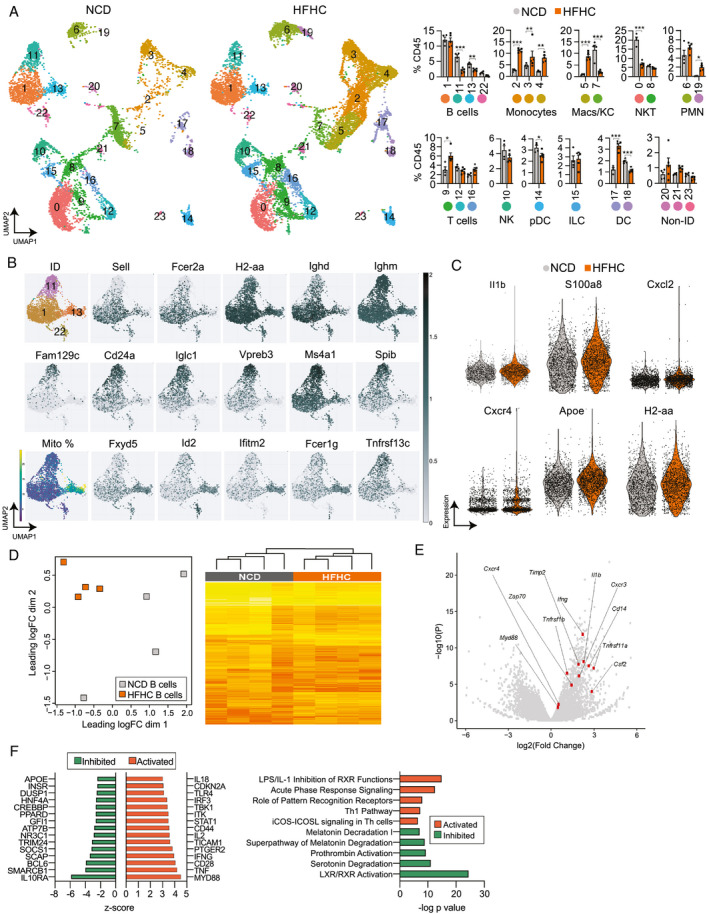
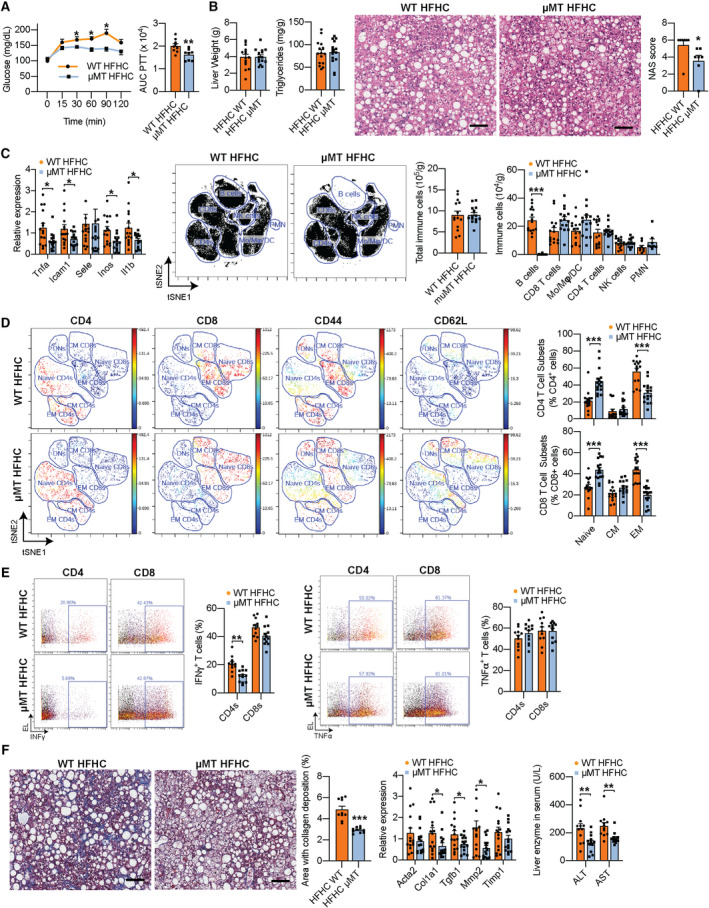
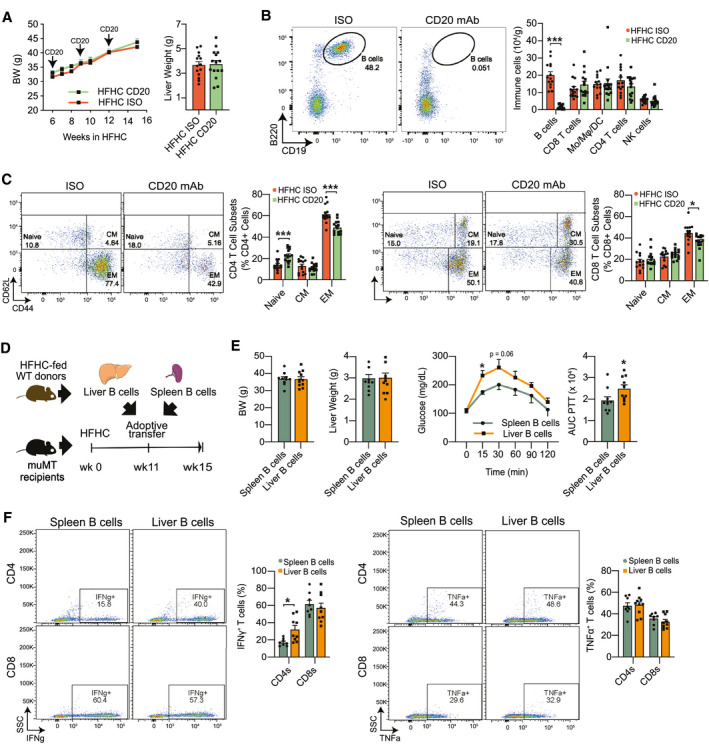
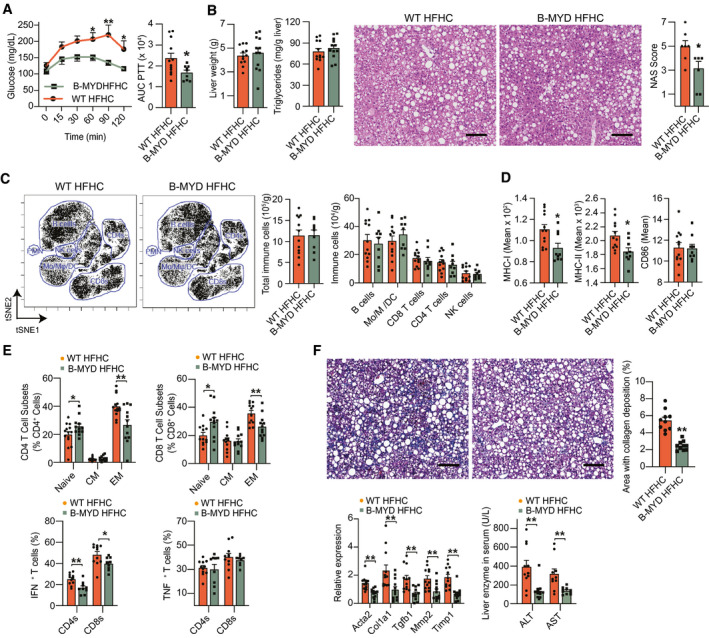
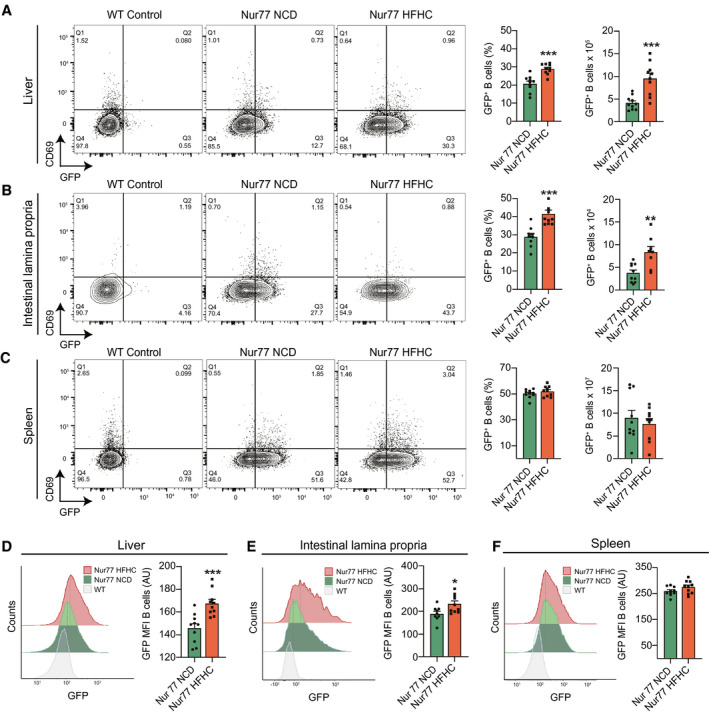
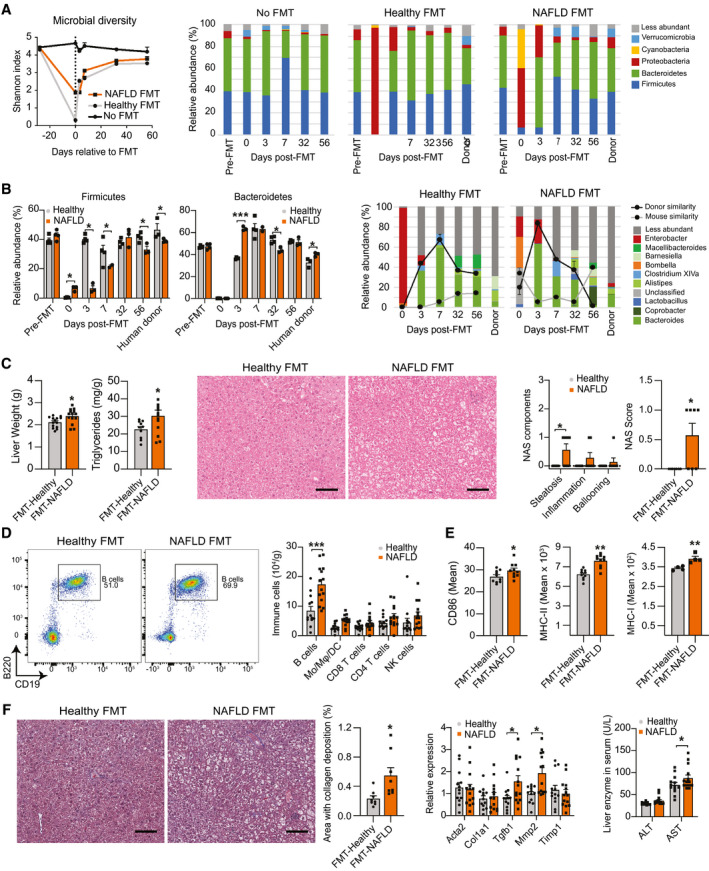
Approach and results: In this study, we report that NASH livers accumulate B cells with elevated pro-inflammatory cytokine secretion and antigen-presentation ability. Single-cell and bulk RNA sequencing of intrahepatic B cells from mice with NASH unveiled a transcriptional landscape that reflects their pro-inflammatory function. Accordingly, B-cell deficiency ameliorated NASH progression, and adoptively transferring B cells from NASH livers recapitulates the disease. Mechanistically, B-cell activation during NASH involves signaling through the innate adaptor myeloid differentiation primary response protein 88 (MyD88) as B cell-specific deletion of MyD88 reduced hepatic T cell-mediated inflammation and fibrosis, but not steatosis. In addition, activation of intrahepatic B cells implicates B cell-receptor signaling, delineating a synergy between innate and adaptive mechanisms of antigen recognition. Furthermore, fecal microbiota transplantation of human NAFLD gut microbiotas into recipient mice promoted the progression of NASH by increasing the accumulation and activation of intrahepatic B cells, suggesting that gut microbial factors drive the pathogenic function of B cells during NASH.

Conclusion: Our findings reveal that a gut microbiota-driven activation of intrahepatic B cells leads to hepatic inflammation and fibrosis during the progression of NASH through innate and adaptive immune mechanisms.


Figures

FIG. 1
FIG. 1
Pro‐Inflammatory B cells accumulate in the liver of mice with NASH. (A) Representative viSNE plots from CyTOF data showing unsupervised clustering and expression of CD19, CD3, CD11b, F4/80, Ly6G, NK1.1, and CD11c by intrahepatic immune cells from male mice fed either a NCD or HFHC diet for 15 weeks. Gates were drawn based on the expression of commonly used markers to distinguish B cells, monocytes, macrophages, CD8 and CD4 T cells, NKT cells, NK cells, DCs, and polymorphonuclear neutrophils. (B) Quantification of immune cell subsets from CyTOF data as in (A) in mice fed either an NCD or HFHC for 5 (n = 15 mice per group), 10 (n = 8 mice per group), or 15 weeks (n = 16 mice per group). (C) Representative CyTOF plot showing B2 cells (CD3 NK1.1 CD19+ CD23+ CD5 B220hi, far left) and their quantification expressed as a percentage of total B cells (middle left). Representative CyTOF plot showing B1b cells (CD3 NK1.1 CD19+ CD23 CD5 B220lo IgM+ IgD, middle right) and quantification of B1a and B1b cells expressed as a percentage of total B cells (far right). Mice were fed either an NCD or HFHC for 15 weeks (n = 16 mice per group). (D) Representative CyTOF plot showing TNFα+ B cells gated from CD3 NK1.1 CD19+ B220+ cells in unstimulated control and PMA conditions (left) and quantification of TNF‐α+ (middle) and IL‐6+ (right) B cells after a 5‐hour stimulation with PMA or the TLR agonists LPS (TLR4), ODN1826 (TLR9), and Pam3CSK4 (TLR1 and 2) in mice fed either an NCD or HFHC for 15 weeks (n = 12 mice per group). (E) Quantification of TNF‐α and IL‐6 secreted by purified intrahepatic B cells (n = 9 wells per group, 2 pooled mice per well), polymorphonuclear neutrophils (n = 5 wells per group, 2 pooled mice per well), and macrophages (n = 5 wells per group, 2 pooled mice per well) from mice fed either an NCD or HFHC for 15 weeks. (F) Representative CyTOF histograms and quantification of mean intensity showing the B‐cell expression of MHC‐I (left), MHC‐II (middle), and CD86 (right) in mice fed either an NCD or HFHC for 15 weeks (n = 16 mice per group). Data correspond to at least three independent experiments and are presented as mean ± SEM. Statistical significance is denoted by *P < 0.05, **P < 0.01, and ***P < 0.001. See also Supporting Fig. S1. Abbreviation: PMN, polymorphonuclear neutrophil.
FIG. 2
FIG. 2
Intrahepatic B cells display a pro‐inflammatory gene profile during NASH. (A‐C) Single‐cell RNA‐seq of intrahepatic immune cells from WT mice fed either a NCD (n = 4) or HFHC (n = 5) for 15 weeks. After quality control and de‐multiplexing, we identified 18,700 unique single cells including 6,972 and 11,728 cells from NCD and HFHC livers, respectively. (A) Uniform manifold approximation and projection of single cells clustered in 24 unique clusters with identification of immune cell identity. NCD‐derived and HFHC‐derived cells were plotted separately to visualize their abundance (left) and relative abundance of each cluster of cells (right) in NCD (n = 4) and HFHC (n = 5) conditions. (B) Identification of B cell clusters based on the expression of the mature (cluster 1: Sell, Fcer2a, H2‐aa, and Ighd) and immature (cluster 11: Fam129c, Cd24a, Iglc1, Ms4a1, and Spib) B‐cell genes. Cluster 13 was enriched in mitochondrial genes and Fxyd, Id2, Ifitm2, Fcer1g, and Tnfrsf13c. (C) Violin plots showing the expression of inflammatory (Il‐1b, S100a8, Cxcl2, Cxcr4, and Apoe) and activation genes (H2‐aa), which were differentially expressed (adj. P < 0.05) between NCD and HFHC B‐cell clusters. (D‐F) B cells were purified from the liver of WT mice fed either an NCD or HFHC for 15 weeks, and their gene expression assessed by bulk RNA‐seq (n = 4 mice per group). (D) Multidimensional scaling plot based on normalized RNA‐seq gene‐expression data showing the pattern of proximities among groups (left) and hierarchical heatmap showing expression changes for the top 500 variance genes in intrahepatic B cells (right). (E) Volcano plot representation of gene‐expression analysis showing normalized fold change (x‐axis) and P value (y‐axis), highlighting selected pro‐inflammatory and pro‐fibrotic genes in intrahepatic B cells. (F) Top predicted upstream regulators, either activated (positive Z‐score) or inhibited (negative Z‐score) from IPA of differentially expressed genes in HFHC B cells, relative to NCD B cells (left) and top canonical pathways based on log‐transformed P values, either activated (positive Z‐score) or inhibited (negative Z‐score) from IPA of differentially expressed genes in HFHC B cells, relative to NCD B cells from mice (right). See also Supporting Fig. S2, Table S3, and Files S1 and S2. Abbreviations: Apoe, Apolipoprotein E; Cxcl2, Chemokine (C‐X‐C motif) ligand 2; Cxcl4, Chemokine (C‐X‐C motif) ligand 4; CD24a, Cluster of differentiation 24; Fam129c, B cell novel protein 1 / Family with sequence similarity 129 member C; Fcer1g, High affinity immunoglobulin epsilon receptor subunit gamma; Fcer2a, Fc receptor, IgE, low affinity II, alpha polypeptide; Fxyd, Fxyd protein; H2‐aa, Histocompatabiltiy 2, class II antigen A, alpha; ID, Identified; Id2, DNA‐binding protein inhibitor ID‐2; Ifitm2, Interferon induced transmembrane protein 2; Ighd, Immunoglobulin heavy constant delta; Iglc1, Immunoglobulin lambda constant 1; IL‐1b, Interleukin 1 beta; ILC, innate lymphoid cell; LXR, liver X receptor; Macs, macrophages; Ms4a1, B‐lymphocyte antigen CD20; pDC, plasmacytoid dendritic cell; RXR, retinoid X receptor; S100a8, S100 calcium‐binding protein A8; Sell, L‐selectin; Spib, Transcription factor Spi‐B; Tnfsrsf13c, B‐cell activating factor receptor; UMAP, uniform manifold approximation and projection.
FIG. 3
FIG. 3
B‐cell deficiency ameliorates inflammation and fibrogenesis during NASH. (A‐F) WT and littermate μMT mice were fed the NASH‐inducing, HFHC diet for 15 weeks. (A) Pyruvate tolerance test (left) with corresponding areas under the curve (AUCs) (right; n = 12 mice per group). (B) Liver weight (far left; n = 15 mice per group), triglyceride content (middle left; n = 15 mice per group), and representative H&E liver stain (middle right; ×200 magnification; scale bar = 100 μm) with corresponding total NAS scores of H&E histology sections (far right, n = 7 mice per group). (C) Real‐time polymerase chain reaction gene‐expression analysis of liver pro‐inflammatory genes (far left; Tnfa, Icam1, Sele, Inos, and Il1b; n = 15 mice per group), representative viSNE plots from CyTOF data (middle left) showing unsupervised, uncolored clustering of intrahepatic B cells, monocytes, macrophages, DCs, CD4 and CD8 T cells, and NK cells with corresponding total immune cell count (middle right), and quantification of immune cell subsets (far right; n = 15 mice per group). (D) Representative viSNE plots from CyTOF data showing clustering of intrahepatic T cells with colored expression of CD4, CD8, CD44, and CD62L and gating of double‐negative T cells, naïve, EM, and CM CD4 and CD8 T cells (left), and quantification of naïve, CM, and EM CD4 and CD8 T cells (right; n = 15 mice per group). (E) Representative CyTOF plots and quantification of IFN‐γ+ CD4 and CD8 T cells (left) and TNF‐α+ CD4 and CD8 T cells (right) after a 5‐hour stimulation with PMA (n = 11 mice per group). (F) Representative trichrome liver stain (far left; ×200 magnification; scale bar = 100 μm) with quantification of the area with collagen deposition (middle left; n = 10 mice per group), RT‐PCR gene‐expression analysis of liver pro‐fibrotic genes (middle right; Acta2, Col1a1, Tgfb1, Mmp2, and Timp1; n = 15 mice per group), and serum ALT/AST levels (far right; n = 12 mice per group). Data correspond to at least three independent experiments and are presented as mean ± SEM. Statistical significance is denoted by *P < 0.05, **P < 0.01, and ***P < 0.001. See also Supporting Fig. S3. Abbreviations: Acta2, smooth muscle α actin; Col1a1, collagen type 1 alpha 1 chain; Mo, monocytes; Mφ, macrophages; RT‐PCR, real‐time polymerase chain reaction; Timp1, tissue inhibitor of metalloproteinase‐1.
FIG. 4
FIG. 4
Intrahepatic B cells stimulate effector memory and Th1 responses in NASH. (A‐C) WT mice were injected with three doses of either a CD20 mAb or isotype control at 6, 9, and 12 weeks after initiation of HFHC feeding. Experiments were performed 15 weeks after the initiation of HFHC feeding. (A) Body (left) and liver weight (right; n = 15 mice per group). (B) Representative flow cytometry plot showing CD19+ B220+ B cells (left) and quantification of intrahepatic B cells, Mo, Mφ, DCs, CD4 and CD8 T cells, and NK cells (right; n = 15 mice per group). (C) Representative flow cytometry plot and quantification of naïve, EM, and CM CD4 T cells (left; n = 15 mice per group) and CD8 T cells (right, n = 15 mice per group). (D‐F) B cells (1 × 106 cells) were purified from either the spleen or liver of WT donor mice fed the HFHC diet for 15 weeks and adoptively transferred via intraperitoneal injection into μMT recipient mice fed the HFHC diet for 11 weeks. Experiments were performed 4 weeks after adoptive transfer. (D) Adoptive transfer experimental design. (E) Body (far left) and liver weight (middle left; n = 10 mice per group). PTT (middle right) with corresponding AUCs (far right; n = 10 mice per group). (F) Representative flow cytometry plot and quantification of IFN‐γ+ (left) and TNF‐α+ (right) CD4 and CD8 T cells after a 5‐hour stimulation with PMA (n = 8 mice per group). Data correspond to at least three independent experiments and are presented as mean ± SEM. Statistical significance is denoted by *P < 0.05, **P < 0.01, and ***P < 0.001. See also Supporting Fig. S4. Abbreviations: BW, body weight; ISO, isotype control; SSC, side scatter; wk, week.
FIG. 5
FIG. 5
Cell‐intrinsic MyD88 mediates the inflammatory function of B cells in NASH. (A‐F) WT and littermate B‐MYD mice were fed the NASH‐inducing HFHC diet for 15 weeks. (A) PTT (left) with corresponding AUCs (right; n = 12 mice per group). (B) Liver weight (far left), liver triglyceride content (middle left; n = 12 mice per group), and representative H&E liver stain (middle right; ×200 magnification; scale bar = 100 μm) with corresponding total NAS scores (far right; n = 7 mice per group). (C) Representative viSNE plots from CyTOF data showing unsupervised, uncolored clustering of intrahepatic B cells, Mo, Mφ, DCs, CD4 and CD8 T cells, and NK cells (left), total immune cell count (middle), and quantification of immune cell subsets from CyTOF data (right; n = 12 mice per group). (D) Mean intensity of B‐cell expression of MHC‐I (left), MHC‐II (middle), and CD86 (right; n = 12 mice per group). (E) Frequency of naïve, EM, and CM CD4 (top left) and CD8 (top right) T cells determined by flow cytometry (n = 12 mice per group). Frequency of IFN‐γ+ (bottom left) and TNF‐α+(bottom right) CD4 and CD8 T cells after a 5‐hour stimulation with PMA (n = 10 mice per group). (F) Representative trichrome liver stain (top left; ×200 magnification; scale bar = 100 μm) and quantification of the area with collagen deposition (top right; n = 10 mice per group). RT‐PCR gene‐expression analysis of liver pro‐fibrotic genes (bottom left; Acta2, Col1a1, Tgfb1, Mmp2, and Timp1; n = 12 mice per group) and serum ALT (bottom right; n = 11 mice per group) and AST (n = 10 mice per group) levels. Data correspond to at least three independent experiments and are presented as mean ± SEM. Statistical significance is denoted by *P < 0.05, **P < 0.01, and ***P < 0.001. See also Supporting Fig. S5.
FIG. 6
FIG. 6
Intrahepatic B cells are activated through BCR in NASH. (A‐F) Nur77‐GFP mice were fed either a NCD or the HFHC diet for 15 weeks. WT mice were used as internal controls of GFP expression. (A) Representative flow cytometry plots (left), quantification (middle), and total number (right) of intrahepatic GFP+ CD69 B cells (n = 10 mice per group). (B) Representative flow cytometry plots (left), quantification (middle), and total number (right) of colonic lamina propria GFP+ CD69 B cells (n = 10 mice per group). (C) Representative flow cytometry plots (left), quantification (middle), and total number (right) of splenic GFP+ CD69 B cells (n = 10 mice per group). (D) Representative histograms (left) and mean fluorescence intensity quantification (right) of GFP in intrahepatic B cells (n = 10 mice per group). (E) Representative histograms (left) and mean fluorescence intensity quantification (right) of GFP in colon lamina propria B cells (n = 10 mice per group). (F) Representative histograms (left) and mean fluorescence intensity quantification (right) of GFP in splenic B cells (n = 10 mice per group). Data correspond to at least three independent experiments and are presented as mean ± SEM. Statistical significance is denoted by *P < 0.05, **P < 0.01, and ***P < 0.001. See also Supporting Fig. S6.
FIG. 7
FIG. 7
Intestinal‐derived microbial factors promote intrahepatic B‐cell activation. (A‐F) WT mice fed a NCD were left untreated (No FMT) or received antibiotics in the drinking water for 21 days followed by a single oral gavage with fecal material from a healthy lean (healthy FMT) or obese with NAFLD (NAFLD FMT) human donors. Fecal pellets from one cohort of recipient mice were collected for microbial analysis before antibiotic treatment (Pre‐FMT) and at 0, 3, 7, 32, and 56 days relative to the FMT. (A) Microbiota diversity determined by average Shannon indices in bacterial communities (left) and relative abundance of predominant phyla in fecal communities (right) of healthy FMT (n = 3 mice) and NAFLD FMT (donor A; n = 4 mice) donors and recipient mice at different time points relative to the FMT. (B) Relative abundance of Firmicutes and Bacteroidetes (left) and of predominant genera (right) in fecal communities of healthy FMT (n = 3 mice) and NAFLD FMT (donor A; n = 4 mice) donors and recipient mice at different time points relative to the FMT. The donor and mouse similarity at each time point were determined by SourceTracker analysis. The samples collected before FMT were used as the reference for mouse similarity analysis. (C) Liver weight and triglyceride content (left) of healthy FMT (n = 13 mice) and NAFLD FMT recipients (n = 14 mice) 10 weeks after FMT. Representative H&E liver stain (middle; ×200 magnification; scale bar = 100 μm) with individual component and total NAS score (right) of healthy and NAFLD FMT recipients (n = 7 mice per group) 10 weeks after FMT. (D) Representative flow cytometry plot showing CD19+ B220+ B cells (left), and total number of intrahepatic B cells, Mo, Mφ, DCs, CD4 and CD8 T cells, and NK cells (right) in healthy FMT (n = 13 mice) and NAFLD FMT recipients (n = 14 mice) 10 weeks after FMT. (E) Mean intensity of intrahepatic B‐cell expression of CD86 (left; n = 10 mice per group), MHC‐II (middle; n = 10 mice per group), and MHC‐I (right; n = 4 mice per group) in healthy FMT and NAFLD FMT recipient mice 10 weeks after FMT. (F) Representative trichrome liver stain (×200 magnification; scale bar = 100 μm) with quantification of the area with collagen deposition (left; n = 8 mice per group), RT‐PCR gene‐expression analysis of liver pro‐fibrotic genes (middle; Acta2, Col1a1, Tgfb1, Mmp2, and Timp1) of healthy FMT (n = 13) and NAFLD FMT (n = 14) recipient mice 10 weeks after FMT, and serum ALT and AST levels (right) of healthy FMT (n = 13) and NAFLD FMT (n = 14) recipient mice 10 weeks after FMT. Data shown in (E) and (F) represent three independent mouse experiments using three different NAFLD human donors (A, B, and C). Data are presented as mean ± SEM. Statistical significance is denoted by *P < 0.05, **P < 0.01, and ***P < 0.001. See also Supporting Fig. S7.

Comment in

References

    1. Younossi Z, Anstee QM, Marietti M, Hardy T, Henry L, Eslam M, et al. Global burden of NAFLD and NASH: trends, predictions, risk factors and prevention. Nat Rev Gastroenterol Hepatol 2018;15:11‐20. - PubMed
    1. Tilg H, Moschen AR. Evolution of inflammation in nonalcoholic fatty liver disease: the multiple parallel hits hypothesis. Hepatology 2010;52:1836‐1846. - PubMed
    1. Parthasarathy G, Revelo X, Malhi H. Pathogenesis of nonalcoholic steatohepatitis: an overview. Hepatol Commun 2020;4:478‐492. - PMC - PubMed
    1. Xiong X, Kuang H, Ansari S, Liu T, Gong J, Wang S, et al. Landscape of intercellular crosstalk in healthy and NASH liver revealed by single‐cell secretome gene analysis. Mol Cell 2019;75:644‐660.e645. - PMC - PubMed
    1. Remmerie A, Martens L, Thoné T, Castoldi A, Seurinck R, Pavie B, et al. Osteopontin expression identifies a subset of recruited macrophages distinct from Kupffer cells in the fatty liver. Immunity 2020;53:641‐657.e614. - PMC - PubMed

Publication types

MeSH terms

Substances