. 2021 May 4;33(5):1013-1026.e6.
doi: 10.1016/j.cmet.2021.02.001. Epub 2021 Feb 19.

Asparagine couples mitochondrial respiration to ATF4 activity and tumor growth

Affiliations

Asparagine couples mitochondrial respiration to ATF4 activity and tumor growth

Abigail S Krall et al. Cell Metab. .

Abstract

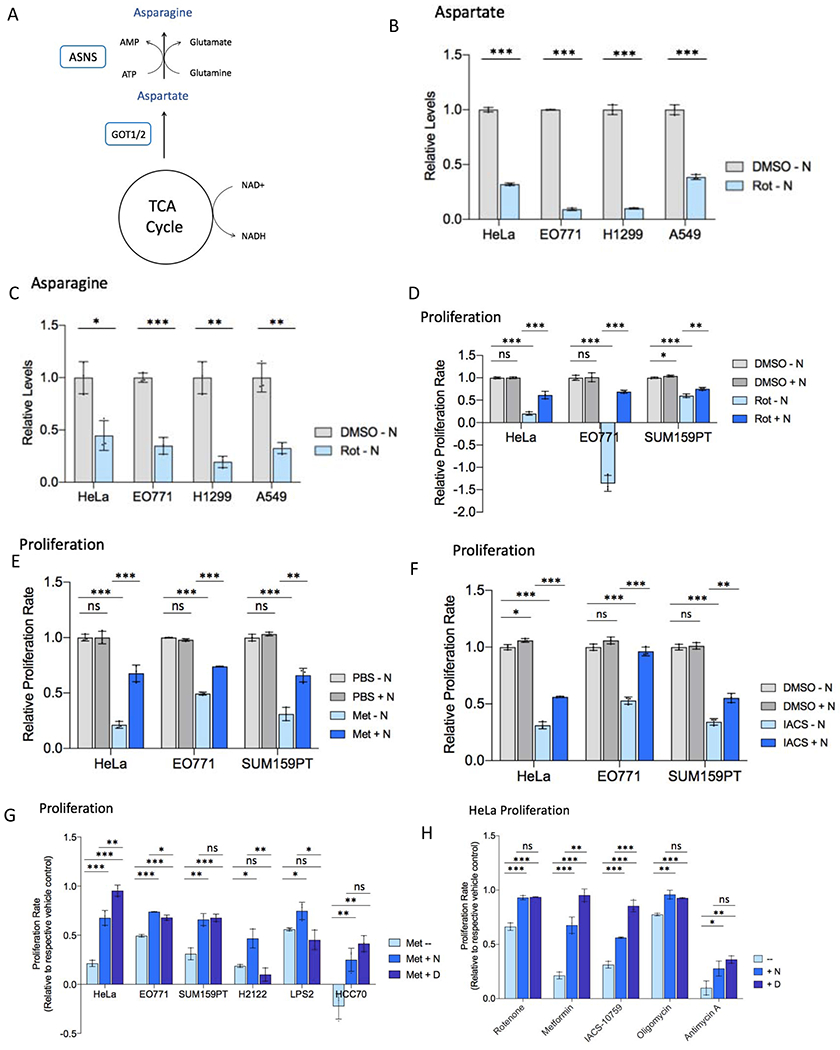
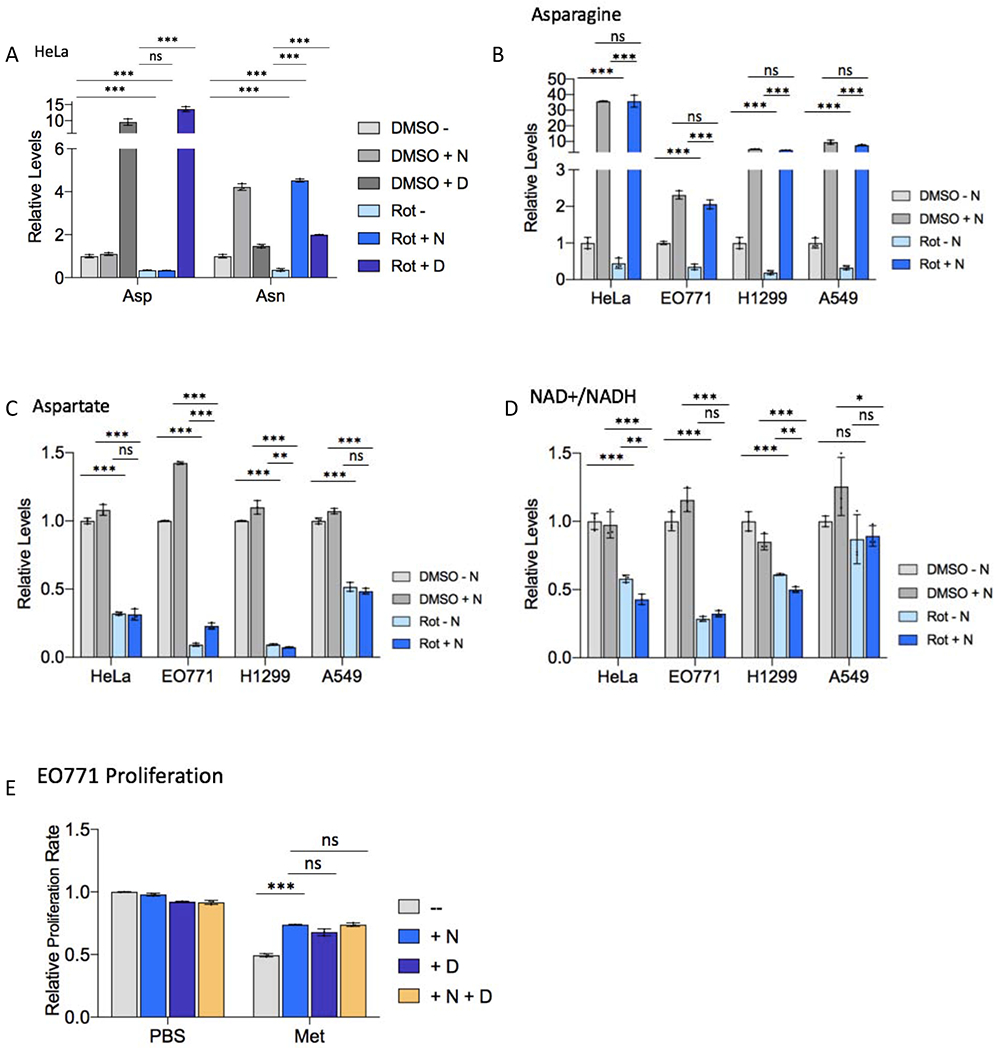
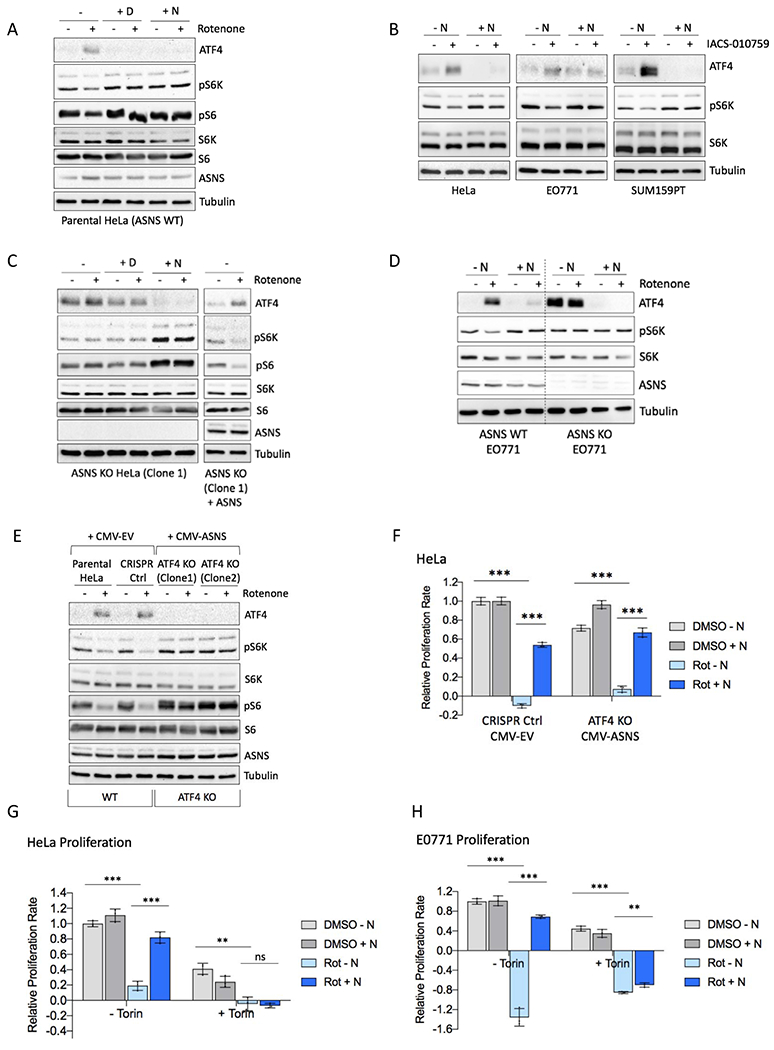
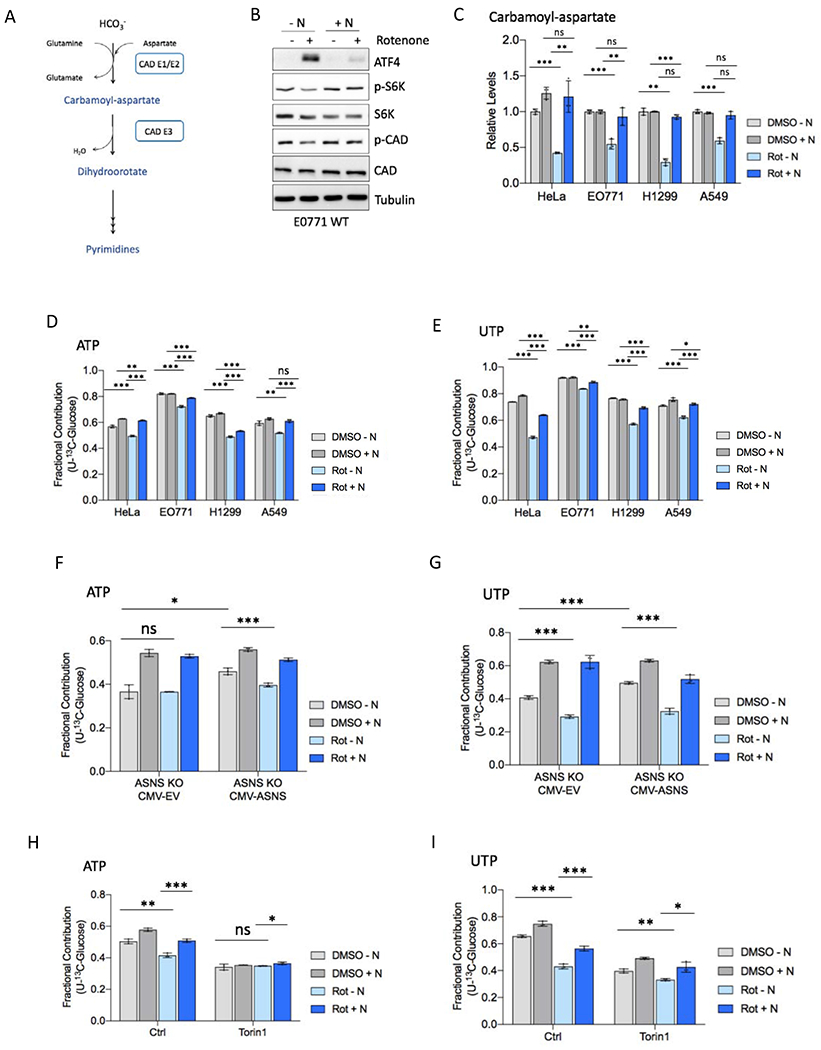
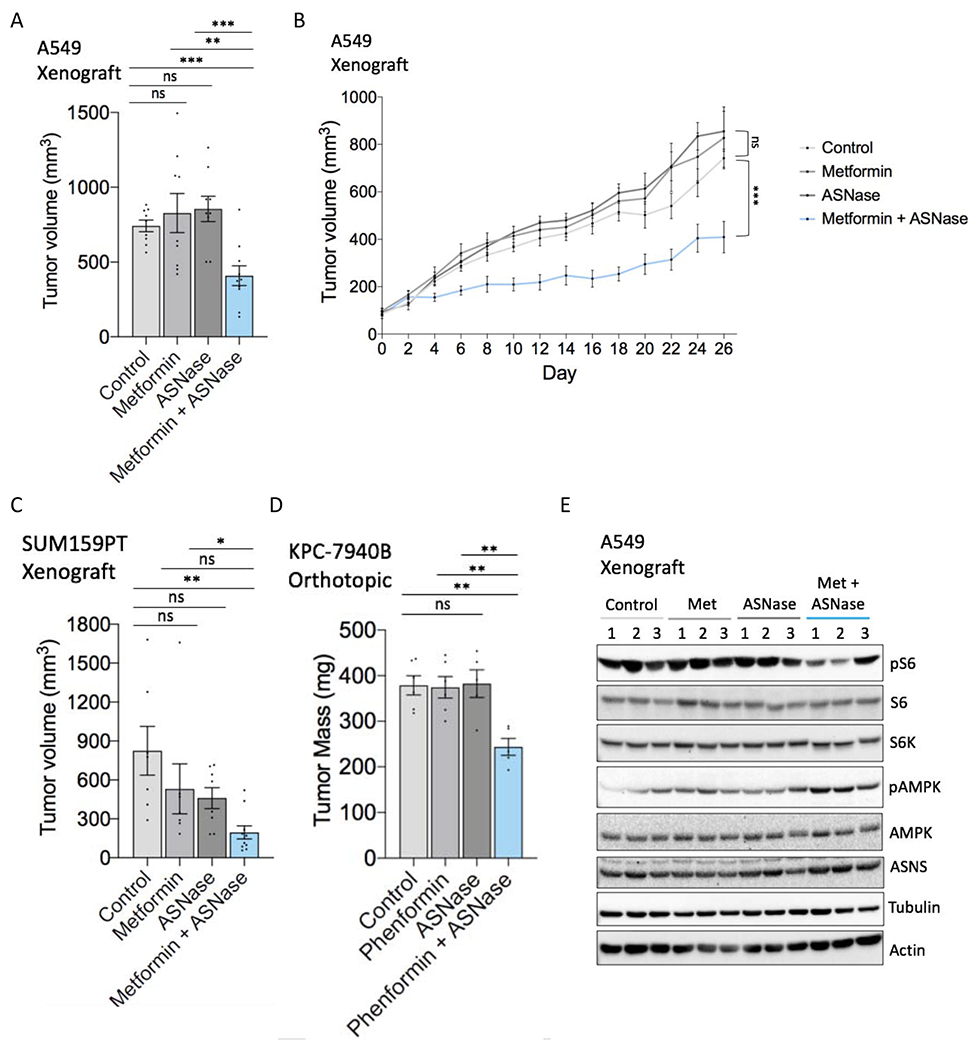
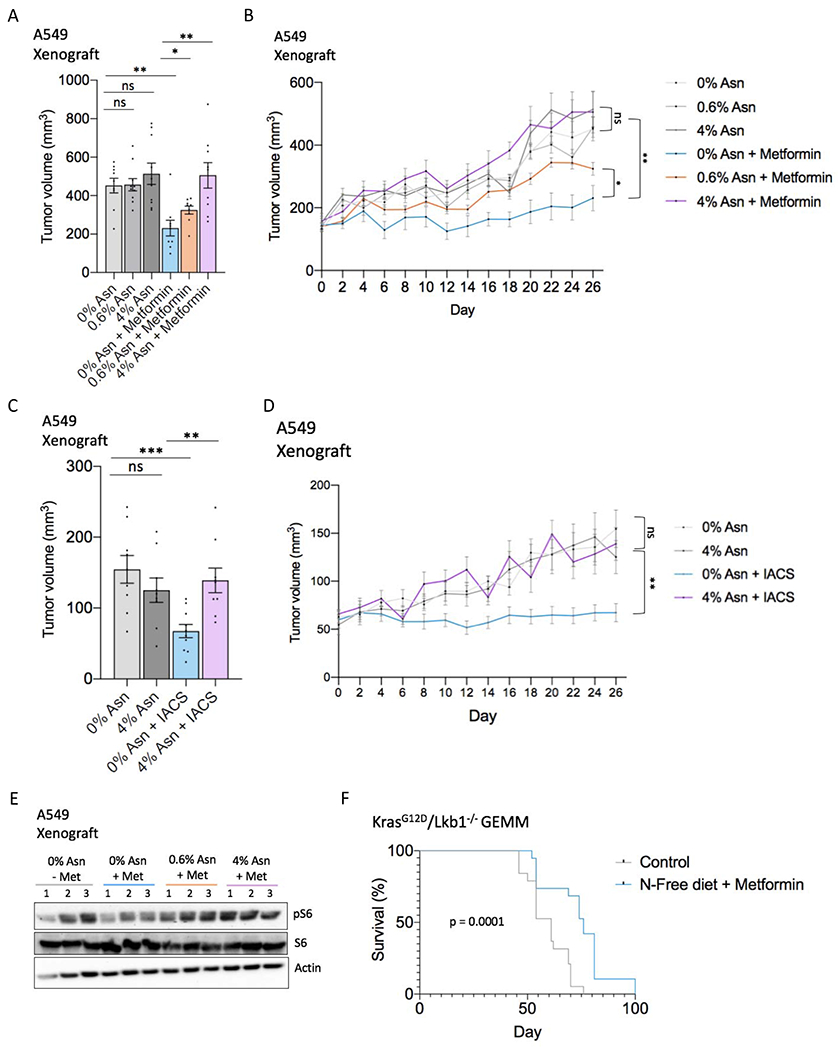
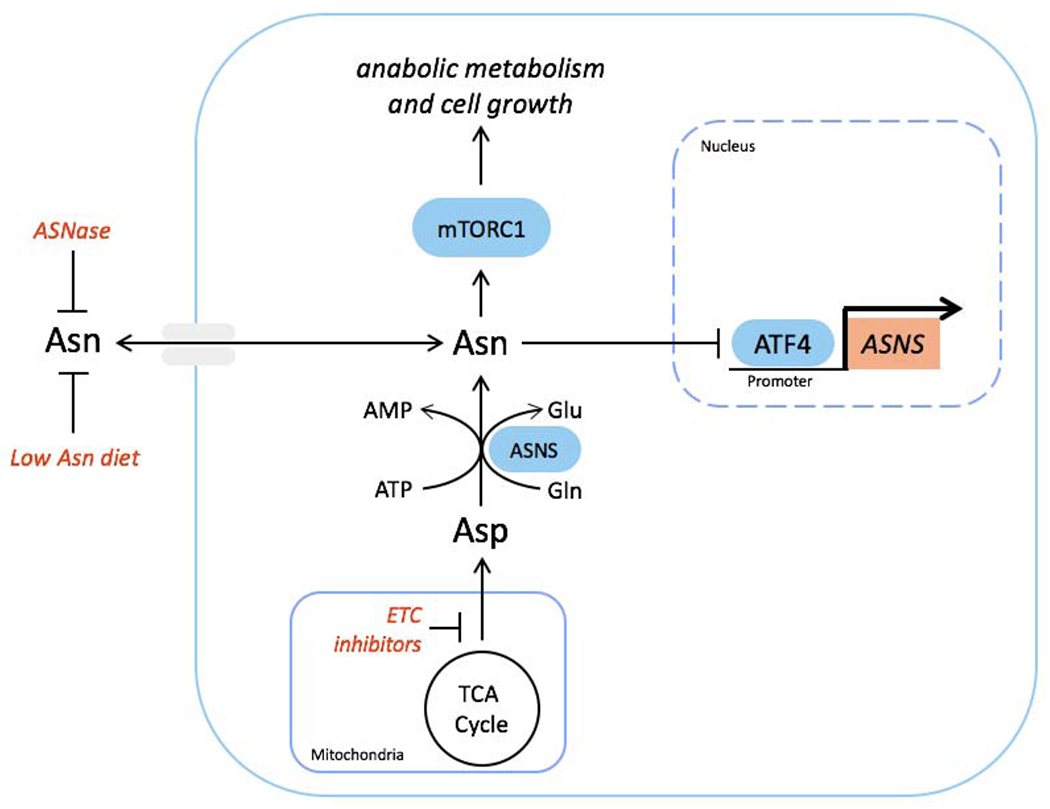
Mitochondrial respiration is critical for cell proliferation. In addition to producing ATP, respiration generates biosynthetic precursors, such as aspartate, an essential substrate for nucleotide synthesis. Here, we show that in addition to depleting intracellular aspartate, electron transport chain (ETC) inhibition depletes aspartate-derived asparagine, increases ATF4 levels, and impairs mTOR complex I (mTORC1) activity. Exogenous asparagine restores proliferation, ATF4 and mTORC1 activities, and mTORC1-dependent nucleotide synthesis in the context of ETC inhibition, suggesting that asparagine communicates active respiration to ATF4 and mTORC1. Finally, we show that combination of the ETC inhibitor metformin, which limits tumor asparagine synthesis, and either asparaginase or dietary asparagine restriction, which limit tumor asparagine consumption, effectively impairs tumor growth in multiple mouse models of cancer. Because environmental asparagine is sufficient to restore tumor growth in the context of respiration impairment, our findings suggest that asparagine synthesis is a fundamental purpose of tumor mitochondrial respiration, which can be harnessed for therapeutic benefit to cancer patients.

Keywords: asparaginase; asparagine; cancer metabolism; cancer treatment; dietary restriction; metformin; respiration.


Conflict of interest statement

Declaration of interests H.R.C. is a co-founder and Scientific Advisory Board member of Pelage Pharmaceuticals, a Scientific Advisory Board member of Faeth Therapeutics, and a member of the Cell Metabolism Advisory Board. This research was funded in part by Jazz Pharmaceuticals.

Figures

Figure 1.
Figure 1.. Asparagine restores proliferation during ETC inhibition.
(A) Schematic diagramming asparagine synthesis from TCA cycle-derived aspartate. (B) Relative levels of intracellular aspartate 6 hours post-treatment with rotenone (Rot) or vehicle (DMSO) in asparagine-free medium. (C) Relative levels of intracellular asparagine 6 hours post-treatment with rotenone or DMSO in asparagine-free medium. (D) Relative proliferation rate of indicated cell lines with rotenone or DMSO treatment in the presence or absence of 0.1 mM exogenous asparagine (N). (E) Relative proliferation rate of indicated cell lines with metformin (Met) or vehicle control (PBS) treatment in the presence or absence of 0.1 mM exogenous asparagine (N). (F) Relative proliferation rate of indicated cell lines with IACS-010759 (IACS) or vehicle control (DMSO) treatment in the presence or absence of 0.1 mM exogenous asparagine (N). (G) Proliferation rate of indicated cell lines with metformin treatment in the presence or absence of 0.1 mM exogenous asparagine (N) or 20 mM aspartate, relative to respective PBS control proliferation in unsupplemented DMEM. (H) Relative HeLa cell proliferation rate with the indicated ETC inhibitor in the presence or absence of 0.1 mM exogenous asparagine (N) or 20 mM aspartate. Proliferation with antimycin A is in medium lacking uridine. Data are mean +/− s.d. (n = 3 independent experiments). P value determined by unpaired two-tailed t-test: *p<0.05; **p<0.01; ***p<0.001; ns, not significant. See also Figure S1.
Figure 2.
Figure 2.. Asparagine supplementation does not restore cellular redox or aspartate with ETC inhibition.
(A) Relative levels of intracellular asparagine (Asn) and aspartate (Asp) in HeLa cells 48 hours post-treatment with 50 nM rotenone (Rot) or DMSO presence or absence of 0.1 mM exogenous asparagine (N) or 20 mM aspartate (D). (B-D) Relative levels of intracellular asparagine (B), aspartate (C), and relative NAD+/NADH ratio (D) in the indicated cell line 6 hours post-treatment with rotenone or DMSO in the presence or absence of 0.1 mM exogenous asparagine (N). (E) Relative E0771 cell proliferation rate with 5 mM metformin (Met) or PBS treatment in the presence or absence of 0.1 mM exogenous asparagine (N), 20 mM aspartate (D), or a combination of 0.1 mM asparagine and 20 mM aspartate. Data are mean +/− s.d. (n = 3 independent experiments). P value determined by unpaired two-tailed t-test: *p<0.05; **p<0.01; ***p<0.001; ns, not significant.
Figure 3.
Figure 3.. Asparagine relays mitochondrial respiration to ATF4 and mTORC1.
(A) Immunoblot of HeLa lysates 6 hours post-treatment with 50 nM rotenone (Rot) or DMSO in the presence or absence of 20 mM aspartate (D) or 0.1 mM asparagine (N). Lysates were immunoblotted for ATF4, mTORC1 activation markers phospho-Thr389 S6K and phospho-Ser235/6 S6, total S6K and S6, ASNS, and tubulin. (B) Immunoblot of lysates after IACS-010759 (IACS) or DMSO treatment of HeLa (6 hours), E0771 (3 hours), and SUM159PT (6 hours) cells. (C) Left, Immunoblot of HeLa ASNS KO (clone 1; see Figure S2E for ASNS KO clone 2) lysates 6 hours post-treatment with 50 nM rotenone or DMSO in the presence or absence of 20 mM aspartate (D) or 0.1 mM asparagine (N); Right, ASNS was restored in HeLa ASNS KO cells with CMV-driven ectopic expression. Immunoblot shows lysates 6 hours post-treatment with 50 nM rotenone or DMSO in unsupplemented DMEM. (D) Immunoblot of E0771 WT or ASNS KO lysates 3 hours post-treatment with 50 nM rotenone or DMSO in the presence or absence of 0.1 mM asparagine (N). (E) Immunoblot of HeLa parental and wildtype clone (CRISPR control) with empty vector (CMV-EV) and two ATF4 knockout clones stably expressing ASNS (CMV-ASNS). Immunoblot shows levels of ATF4, pS6K (T389), total S6K, pS6 (S235/6), total S6, ASNS, and tubulin 6 hours post-treatment with 50 nM rotenone. (F) Relative proliferation rate of wildtype and ATF4 knockout cells shown in (E). (G-H) Relative proliferation rate of HeLa (G) and E0771 (H) with rotenone or DMSO treatment in the presence or absence of 0.1 mM exogenous asparagine (N) and in the presence or absence of 250 nM Torin1. P value determined by unpaired two-tailed t-test: *p<0.05; **p<0.01; ***p<0.001; ns, not significant. See also Figure S2.
Figure 4.
Figure 4.. Asparagine restores nucleotide synthesis with ETC inhibition.
(A) Schematic diagramming carbamoyl-phosphate synthetase 2 (CAD) activity in pyrimidine synthesis. (B) Immunoblot of E0771 WT lysates 3 hours post-treatment with 50 nM rotenone or DMSO in the presence or absence of 0.1 mM asparagine (N). Lysates were immunoblotted for ATF4, mTORC1 activation markers phospho-Thr389 S6K and phospho-Ser1859 CAD, total S6K and CAD, and tubulin. (C) Relative levels of CAD product carbamoyl-aspartate in the indicated cell line 6 hours post-treatment with rotenone or DMSO in the presence or absence of 0.1 mM exogenous asparagine (N). (D-E) Fractional contribution of U-13C-glucose to ATP (D) and UTP (E) in the indicated cell line 6 hours post-treatment with rotenone or DMSO in the presence or absence of 0.1 mM exogenous asparagine. Medium was replaced with DMEM containing 10 mM U-13C-glucose at the same time as rotenone treatment. (F-G) Fractional contribution of U-13C-glucose to ATP (F) and UTP (G) in ASNS knockout HeLa cells stably expressing ASNS (CMV-ASNS) or empty vector (CMV-EV) 6 hours post-treatment with rotenone or DMSO presence or absence of 0.1 mM exogenous asparagine, as in D-E. (H-I) Fractional contribution of U-13C-glucose to ATP (H) and UTP (I) in HeLa cells 6 hours post-treatment with rotenone or DMSO in the presence or absence of 0.1 mM exogenous asparagine and in the presence of DMSO (Ctrl) or 250 nM Torin1, as in D-E. See also Figure S3. Data are mean +/− s.d. (n = 3 independent experiments). P value determined by unpaired two-tailed t-test: *p<0.05; **p<0.01; ***p<0.001; ns, not significant.
Figure 5.
Figure 5.. Combining metformin with asparaginase impairs tumor growth.
(A) Endpoint tumor volume (mm3) (day 26 of treatment) of A549 subcutaneous tumor xenografts in mice treated with metformin (250 mg/kg/day), asparaginase (ASNase) (5 IU/kg), the combination, or vehicle controls as determined by caliper measurements (n = 9-10). (B) A549 tumor xenograft growth curves from metformin/asparaginase treatment start date through endpoint. (C) Endpoint tumor volume (mm3) (day 21 of treatment) of SUM159PT subcutaneous tumor xenografts in mice treated with metformin (250 mg/kg/day), asparaginase (ASNase) (5 IU/kg), the combination, or vehicle controls as determined by caliper measurements. n = 7-10. (D) Endpoint tumor mass of KPC-7940B orthotopic tumors treated with phenformin (1.7mg/mL), asparaginase (ASNase) (2 IU), the combination, or vehicle controls. n = 5-6. (E) Immunoblot of lysates from metformin/asparaginase-treated A549 tumor xenografts shown in (A-B). Lysates were immunoblotted for mTORC1 activation marker phospho-Ser235/6 S6, total S6K, total S6, phospho-Thr172 AMPK, total AMPK, ASNS, tubulin, and actin. The three middle-sized tumors of each treatment group were chosen as representatives. Data are mean +/− s.e.; P value determined by unpaired two-tailed t-test: *p<0.05; **p<0.01; ***p<0.001; ns, not significant. See also Figure S4.
Figure 6.
Figure 6.. Combining metformin with dietary asparagine restriction impairs tumor growth.
(A) Endpoint tumor volume (mm3) (day 26 of treatment) of A549 subcutaneous tumor xenografts in mice treated with or without metformin and fed a diet containing 0%, 0.6%, or 4% asparagine, as determined by caliper measurements. n = 9-10. (B) A549 tumor xenograft growth curve from metformin/asparagine diet start date through endpoint. (C) Endpoint tumor volume (mm3) (day 26 of treatment) of A549 subcutaneous tumor xenografts in mice treated with IACS-010759 (IACS) (1 mg/kg) or vehicle and fed a 0% or 4% asparagine diet, as determined by caliper measurements. n = 9-10. (D) A549 tumor xenograft growth curve from IACS-010759/asparagine diet start date through endpoint. (E) Immunoblot of lysates from metformin/dietary asparagine restriction-treated A549 tumor xenografts shown in (A-B). Lysates were immunoblotted for mTORC1 activation marker phospho-Ser235/6 S6, total S6, and actin. The three middle-sized tumors of the indicated treatment groups were chosen as representatives. (F) Kaplan-Meier survival curve indicating percentage of mice with KrasG12D/Lkb1−/−-driven non-small cell lung cancer surviving over 100 days. Control mice were fed a 0.6% asparagine diet without metformin in the drinking water; the treatment group (N-free diet + metformin) was fed a 0% asparagine diet and treated with 250 mg/kg/day metformin in the drinking water. Treatment was initiated (day 0) two weeks after Cre-mediated tumor induction (see methods). n = 19; Error bars denote s.e. of the mean. For (A-D) data are mean +/− s.e.; P value determined by unpaired two-tailed t-test. For (F), P-value was calculated by Mantel-Cox test. *p<0.05; **p<0.01; ***p<0.001; ns, not significant. See also Figures S5 and S6.
Figure 7.
Figure 7.. Asparagine signals mitochondrial respiration to mTORC1 and ATF4 and can be targeted to impair tumor growth.
Schematic showing communication of mitochondrial respiration to mTORC1 and ATF4 by aspartate-derived asparagine. Tumor growth can be impaired by combining ETC inhibition, which blocks de novo asparagine synthesis, with either asparaginase or dietary asparagine restriction, which limit asparagine consumption.

Comment in

References

    1. al-Jebawi AF, Lassman MN, and Abourizk NN (1998). Lactic acidosis with therapeutic metformin blood level in a low-risk diabetic patient. Diabetes Care 21, 1364–1365. - PubMed
    1. Balsa E, Soustek MS, Thomas A, Cogliati S, Garcia-Poyatos C, Martin-Garcia E, Jedrychowski M, Gygi SP, Enriquez JA, and Puigserver P (2019). ER and Nutrient Stress Promote Assembly of Respiratory Chain Supercomplexes through the PERK-eIF2alpha Axis. Mol Cell 74, 877–890 e876. - PMC - PubMed
    1. Ben-Sahra I, Howell JJ, Asara JM, and Manning BD (2013). Stimulation of de novo pyrimidine synthesis by growth signaling through mTOR and S6K1. Science 339, 1323–1328. - PMC - PubMed
    1. Birsoy K, Wang T, Chen WW, Freinkman E, Abu-Remaileh M, and Sabatini DM (2015). An Essential Role of the Mitochondrial Electron Transport Chain in Cell Proliferation Is to Enable Aspartate Synthesis. Cell 162, 540–551. - PMC - PubMed
    1. Braas D, Ahler E, Tam B, Nathanson D, Riedinger M, Benz MR, Smith KB, Eilber FC, Witte ON, Tap WD, et al. (2012). Metabolomics strategy reveals subpopulation of liposarcomas sensitive to gemcitabine treatment. Cancer Discov 2, 1109–1117. - PMC - PubMed

Publication types

MeSH terms