. 2021 Apr 26;31(8):1762-1770.e4.
doi: 10.1016/j.cub.2021.01.076. Epub 2021 Feb 19.

Inverted central auditory hierarchies for encoding local intervals and global temporal patterns

Affiliations

Inverted central auditory hierarchies for encoding local intervals and global temporal patterns

Meenakshi M Asokan et al. Curr Biol. .

Abstract

In sensory systems, representational features of increasing complexity emerge at successive stages of processing. In the mammalian auditory pathway, the clearest change from brainstem to cortex is defined by what is lost, not by what is gained, in that high-fidelity temporal coding becomes increasingly restricted to slower acoustic modulation rates.1,2 Here, we explore the idea that sluggish temporal processing is more than just an inability for fast processing, but instead reflects an emergent specialization for encoding sound features that unfold on very slow timescales.3,4 We performed simultaneous single unit ensemble recordings from three hierarchical stages of auditory processing in awake mice - the inferior colliculus (IC), medial geniculate body of the thalamus (MGB) and primary auditory cortex (A1). As expected, temporal coding of brief local intervals (0.001 - 0.1 s) separating consecutive noise bursts was robust in the IC and declined across MGB and A1. By contrast, slowly developing (∼1 s period) global rhythmic patterns of inter-burst interval sequences strongly modulated A1 spiking, were weakly captured by MGB neurons, and not at all by IC neurons. Shifts in stimulus regularity were not represented by changes in A1 spike rates, but rather in how the spikes were arranged in time. These findings show that low-level auditory neurons with fast timescales encode isolated sound features but not the longer gestalt, while the extended timescales in higher-level areas can facilitate sensitivity to slower contextual changes in the sensory environment.

Keywords: auditory cortex; hierarchical organization; inferior colliculus; medial geniculate body; neural timescales; patterns; predictive coding; rhythm; temporal coding; thalamus.


Conflict of interest statement

Declaration of interests The authors have no competing interests to declare.

Figures
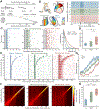
Figure 1:
Figure 1:. Across the midbrain to cortex hierarchy, neural timescales expand as temporal interval decoding accuracy declines.
A) Top: Acoustic features supporting the perception of speech, music and auditory scene analysis are inherently organized on a wide range of timescales. Bottom: The typical synchronization limit for neurons at each stage of auditory processing. Each word is roughly centered on the typical synchronization limit to amplitude modulated sound, as reviewed in Reference . B) Left: Schematic of simultaneous multi-regional extracellular recordings from the IC, MGB and A1 of awake, head-fixed mice. One- or two-shanked 64-channel probe positioning relative to a schematic of the best frequency tonotopic gradients in each structure. Right: A single sweep of 192-channel multiunit activity across the IC, MGB and A1 before and after presentation of a 20ms white noise burst to the contralateral ear at 70 dB SPL. C) Left: Spike rasters from representative single units in the IC, MGB and A1. Gray shaded area denotes the timing of the 20ms white noise burst. Right: Autocorrelation function for each unit with exponential fit and computed decay constant. D) Neural timescale measurements from the IC (5/48, mice/single units), MGB (5/131), and A1 (4/140). Neural timescales significantly increased across the hierarchy (Kruskal-Wallis, 1.7x10⁻¹⁰; post-hoc pairwise comparisons with Bonferroni correction for multiple comparisons, IC vs MGB, 1/0.05; IC vs A1, 1x10⁻⁶/0.51; MGB vs A1, 1x10⁻⁸/0.41 for p-value/Cliff’s delta). Box-and-whisker plots show median values in solid gray line and 25th and 75th percentiles. Whiskers = range of non-outlier values. Circles = mean. E) Spike rasters for three representative single units for paired noise bursts. Alternating colors are presented for ease of visualization. Vertical gray lines = timing of 20ms noise bursts. F) Mean confusion matrices for single-trial PSTH-based classification of inter-burst interval for the same IC, MGB, and A1 single units in E. G) Mean ± SEM probability of veridical interval classification (the upward diagonal from the confusion matrices in F) for all IC, MGB and A1 units. Interval classification accuracy is significantly reduced at successive stages of the IC-MGB-A1 hierarchy (Mixed design ANOVA, main effect for structure, F = 20.95, p = 6x10⁻⁹). H) Decoder accuracy threshold in IC (n = 5/48, mice/single units), MGB (5/111) and A1 (4/109). Threshold increases across the hierarchy (Kruskal-Wallis, 8x10⁻¹⁷; post-hoc pairwise comparisons with Bonferroni correction for multiple comparisons, IC vs MGB, 3.7x10⁻⁶/0.50; IC vs A1, 6x10⁻¹⁷/0.83; MGB vs A1, 8x10⁻⁶/0.37 for p-value/Cliff’s delta). Box-and-whisker plots show median values in solid gray line and 25th and 75th percentiles. Whiskers = range of non-outlier values. Circles = mean.
Figure 2:
Figure 2:. Accurate decoding of random or regular temporal interval arrangements observed in A1, not subcortically
A) Top: Schematic of rhythmic and random noise burst sequences. A single cycle is composed from four intervals which are joined by the gray line. The four intervals are presented in a stereotyped order to form a rhythm, or in a random order during the baseline and random periods. Bottom: Six cycles from the rhythmic and random epochs are presented with the single unit spike rasters from 68 simultaneously recorded units in the IC, MGB and A1. Vertical gray bars denote the timing of individual noise bursts. See also supplemental audio files presenting examples of regular and rhythmic stimulus sequences. Refer to Audio S1 and Audio S2 for audio excerpts of random and rhythmic interval sequences. B) Top: Evoked response over a 100ms period beginning at stimulus onset for the top three principal components in each region averaged across all 100 noise bursts in each stimulus context (4 bursts per cycle, 25 cycles per epoch). Bottom: Amplitude of the first principal component’s response for each of 25 cycles within the rhythmic and random contexts. C) A SVM was used to classify the ensemble spiking for each cycle to random or rhythmic contexts, as shown from an example mouse with simultaneous IC, MGB, and A1 recordings. Solid line represents sigmoidal fit of the cycle-by-cycle decoding. D) Decoder output for ensembles in IC (N=5, mice), MGB (N=6) and A1 (N=5). Gray lines indicate the mean random cycle shuffled control from each recording. Thick line with shading = mean ± SEM. Classification accuracy increases along the IC-MGB-A1 hierarchy (Two-way repeated measures ANOVAs, main effect for classification over cycles: IC [F = 0.5, p = 0.99], MGB [F = 0.69, p = 0.93], A1 [F = 18.81, p = 0]; interaction term for classification × condition, IC [F = 1.23, p = 0.15], MGB [F = 1.55, p = 0.01], A1, [F = 21.28, p = 0]).
Figure 3:
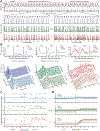
Figure 3:. A top-down representation of global temporal patterns via spike timing dynamics, not spike rate
A) Representative spike rasters from IC, MGB, and A1 units for 100 noise bursts presented in random and rhythmic sequences. Gray shading = 20ms noise burst. B) Post-stimulus firing rate histograms and autocorrelation functions for the example units in A. See also Figure S1 for quantification of first spike latency variability during random and rhythmic epochs. C) Neural timescale measurements from sound-evoked spiking during random and rhythmic epochs in IC (n=5/50, mice/single units), MGB (6/154), and A1 (5/164). Inset: Mean ± SEM neural timescale from each region. Asterisk denotes statistical significance with a paired t-test (p < 0.05 and Cohen’s d > 0.5); (IC, 0.7/0.05; MGB, 0.00009/0.33; A1, 3x10⁻¹⁴/0.65 for p-value/Cohen’s d). See also Figure S2 for spike timescale changes across layers and Figure S3 for spike timescale changes between regular- and fast-spiking units. D) Histogram of neural timescale asymmetry index ([random – rhythm] / [random + rhythm]), where values < 0 indicate more dampened responses during random intervals and values > 0 indicate more dampened responses during rhythmic intervals. Arrows denote sample means. Neural timescales are significantly reduced during rhythmic epochs in A1, slightly reduced in the MGB, but not affected in the IC (one-sample t-test against a population mean of 0; IC, 0.27/0.08; MGB, 0.00002/0.33; A1, 8x10⁻¹³/0.59 for p-value/Cohen’s d). See also Figure S4 for a characterization of a control experiments in which the stimulus remained random for all 50 post-baseline cycles. E) Sound-evoked firing measured from random and rhythmic epochs. Inset: Mean ± SEM spike rate from each region. NS = not significant. Asterisk denotes statistical significance with a paired t-test (p < 0.05 and Cohen’s d > 0.5); (IC, 0.68/−0.06; MGB, 1x10⁻⁵/0.36; A1, 0.47/−0.06 for p-value/Cohen’s d). F) Firing rate asymmetry during random and rhythmic stimulus epochs. Plotting conventions match D. Mean firing rates are only weakly modulated by stimulus context in all brain areas (one-sample t-test against a population mean of 0; IC, 0.6/0.07; MGB, 1x10⁻⁵/0.36; A1, 0.97/0.00, for p-value/Cohen’s d).
Figure 4:
Figure 4:. Dampened A1 neural timescales occur with short repeating rhythms, not with longer rhythms.
A) Sequences of baseline-rhythm-random interval arrangements where individual cycles are composed of 4, 8 or 12 noise burst intervals. Refer to Audio S3 and Audio S4 for audio excerpts of rhythmic interval sequences comprised of eight and twelve intervals per cycle. B) Spike rasters from representative A1 single units recorded with sequences of varying cycle size. Random and rhythmic epochs present 100, 200 or 300 epochs (25 cycles per epoch × 4/8/12 noise burst intervals per cycle). C) Post-stimulus firing rate histograms and autocorrelation functions for the example units in B. D) Neural timescale measurements from the random and rhythmic epochs are presented for 164 single units, each recorded with a cycle size of 4,8 and 12 noise burst intervals. Inset: Mean ± SEM neural timescale for each cycle length. NS = not significant. Asterisk denotes statistical significance with a paired t-test (p < 0.05 and Cohen’s d > 0.5); (4 intervals, 3x10⁻¹⁴/0.65; 8 intervals, 0.003/0.23; 12 intervals, 0.03/0.17 for p-value/Cohen’s d). E) Histogram of neural timescale asymmetry index ([random – rhythm] / [random + rhythm]), where values < 0 indicate more dampened responses during random intervals and values > 0 indicate more dampened responses during rhythmic intervals. Arrows denote sample means. Neural timescales are significantly reduced when noise bursts form rhythms than during random arrangements with cycle sizes of 4, but not 8 or 12 (one-sample t-test against a population mean of 0, 4 intervals, 2x10⁻¹²/0.59; 8 intervals, 0.002/0.24; 12 intervals, 0.31/0.08, for p-value/Cohen’s d).

References

    1. Joris PX, Schreiner CE, and Rees A (2004). Neural processing of amplitude-modulated sounds. Physiol. Rev 84, 541–577. - PubMed
    1. Wang X, Lu T, Bendor D, and Bartlett E (2008). Neural coding of temporal information in auditory thalamus and cortex. Neuroscience 157, 484–493. - PubMed
    1. King AJ, and Nelken I (2009). Unraveling the principles of auditory cortical processing: can we learn from the visual system? Nat. Neurosci 12, 698–701. - PMC - PubMed
    1. Casseday JH, and Covey E (1996). A neuroethological theory of the operation of the inferior colliculus. Brain. Behav. Evol 47, 311–322. - PubMed
    1. Yin TCT, Smith PH, and Joris PX (2019). Neural mechanisms of binaural processing in the auditory brainstem. Compr. Physiol, 1503–1575. - PubMed

Publication types