Review
. 2021 Apr:205:108508.
doi: 10.1016/j.exer.2021.108508. Epub 2021 Feb 18.

Corneal biomechanics: Measurement and structural correlations

Affiliations
Review

Corneal biomechanics: Measurement and structural correlations

Jillian Chong et al. Exp Eye Res. 2021 Apr.

Abstract

The characterization of corneal biomechanical properties has important implications for the management of ocular disease and prediction of surgical responses. Corneal refractive surgery outcomes, progression or stabilization of ectatic disease, and intraocular pressure determination are just examples of the many key clinical problems that depend highly upon corneal biomechanical characteristics. However, to date there is no gold standard measurement technique. Since the advent of a 1-dimensional (1D) air-puff based technique for measuring the corneal surface response in 2005, advances in clinical imaging technology have yielded increasingly sophisticated approaches to characterizing the biomechanical properties of the cornea. Novel analyses of 1D responses are expanding the clinical utility of commercially-available air-puff-based instruments, and other imaging modalities-including optical coherence elastography (OCE), Brillouin microscopy and phase-decorrelation ocular coherence tomography (PhD-OCT)-offer new opportunities for probing local biomechanical behavior in 3-dimensional space and drawing new inferences about the relationships between corneal structure, mechanical behavior, and corneal refractive function. These advances are likely to drive greater clinical adoption of in vivo biomechanical analysis and to support more personalized medical and surgical decision-making.

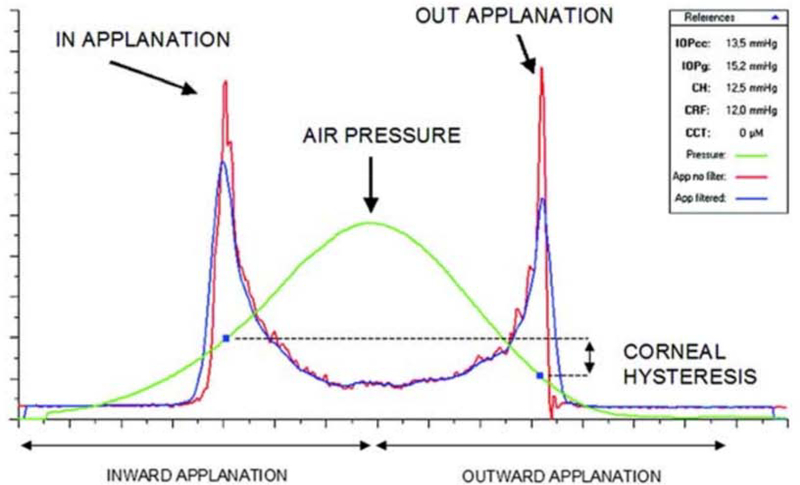
Keywords: Brillouin microscopy; Corneal biomechanics; Corneal hysteresis; Corvis ST; Ocular coherence elastography; Ocular response analyzer.


Conflict of interest statement

COI Statement. Dr. Dupps is listed on intellectual property held by Cleveland Clinic for computational modeling of the cornea and corneal biomechanical measurement with optical coherence elastography. He is a consultant for Alcon and Glaukos. Dr. Chong has no relevant conflicts.

Figures

Figure 1:
Figure 1:
A. Stress-strain curve derived from measured displacement over variable load (1,2,3) in a horizontal strip of donor cornea. This process allows for ex vivo calculation of Young’s modulus. B. Viscoelastic stress relaxation in donor corneal tissue in which load is applied (4) and removed (5). Adapted from Dupps and Wilson 2006.
Figure 2:
Figure 2:
Example of a graph obtained from the ORA. Infrared signal peaks represent inward and outward applanation points. The corresponding points on the air pressure curve, P1 and P2, are used to calculate CH and CRF.
Figure 3:
Figure 3:
Example of the Ambrósio, Roberts & Vinciguerra (ARV) Display of an ectatic eye obtained on the Corvis ST and Pentacam devices. Pentacam Axial and Pachymetry maps and the Belin-Ambrósio display are shown on the right. Corvis ST variables Stiffness Parameter (SP-A1), Ambrósio Relational Thickness (ARTh), Integrated Radius and Deformation Amplitude (DA) Radius are shown on the upper left. Images of the cornea at inward (A1) and outward (A2) applanation and at the point of highest concavity (HC) can be displayed on the lower left. Bottom bars represent the Corneal Biomechanical Index (CBI), Total Biomechanical Index (TBI) and Belin-Ambrósio display (BAD) D values for the cornea under study. The BAD D score is a morphological metric based on static Scheimpflug tomography that increases in value as ectasia risk increases, CBI is a dynamic metric based on air puff response variables that increases with ectasia risk, and TBI is a machine-learning derived variable that incorporates multiple static and dynamic in a single measure of ectasia risk.
Figure 4:
Figure 4:
Example set up for OCE, with schematic displayed on the left and prototype to the right. From De Stefano 2018.
Figure 5:
Figure 5:
Example data from Applanation OCE. A Two-dimensional OCT image at the point of maximum compression, with anterior (blue) and posterior (red) regions of interest identified. B Force versus displacement plot demonstrating differences in axial stiffness between anterior (blue) and posterior (red) stromal regions. Steeper slopes correspond to stiffer behavior. C Map of cumulative displacement in the central cornea (μm). D Plot of depth-dependent cumulative displacement of the central cornea (laterally averaged over 100 μm band). E Elastography map overlaid on (A), representing local values for the slope of the force v. displacement curves as represented in (B). Cooler colors represent less displacement, corresponding to higher slope values and greater stiffness behavior. F Plot of depth-dependent k values, representative of local stiffness behavior (laterally averaged over 100μm band). Adapted from De Stefano, 2018.
Figure 6:
Figure 6:
Example data from Brillouin microscopy. Sample Brillouin images from normal (a) and cross-linked (b) porcine corneas with warmer colors representing a greater shift and increased stiffness. c Plot of depth-dependent Brillouin shift in cross-linked versus untreated control corneas. d Comparison of mean Brillouin modulus for the anterior, central and posterior cornea in crosslinked versus untreated control corneas.
Figure 7:
Figure 7:
Example PhD-OCT data cross-linked (A) versus sham-treated (B) porcine corneas, with the anterior third of the cornea demarcated by the black dotted line. Note the CXL demarcation line visible on the OCT reflectance in A post-CXL. C Comparison of average change in Γ in the anterior third of sham-treated versus post-CXL corneas. D Three representative eyes demonstrating change in Γ during CXL at 10-minute intervals over a 30-minute period of UV irradiation.

Similar articles

Cited by

References

    1. Ali NQ, et al. 2014. Biomechanical responses of healthy and keratoconic corneas measured using a noncontact scheimpflug-based tonometer. Invest Ophthalmol Vis Sci. 55: 3651–3659. doi: 10.1167/iovs.13-13715. - DOI - PubMed
    1. Ambrósio R Jr, et al. 2017. Integration of Scheimpflug-Based Corneal Tomography and Biomechanical Assessments for Enhancing Ectasia Detection. J Refract Surg. 33, 434–443. doi: 10.3928/1081597X-20170426-02. - DOI - PubMed
    1. Blackburn BJ, et al. 2019. Noninvasive Assessment of Corneal Crosslinking With Phase-Decorrelation Optical Coherence Tomography. Invest Ophthalmol Vis Sci. 60, 41–51. doi: 10.1167/iovs.18-25535. - DOI - PMC - PubMed
    1. Chan TCY, et al. 2018. Comparison of corneal tomography and a new combined tomographic biomechanical index in subclinical keratoconus. J Refract Surg. 34, 616–621. doi: 10.3928/1081597X-20180705-02. - DOI - PubMed
    1. Congdon NG, et al. 2006. Central corneal thickness and corneal hysteresis associated with glaucoma damage. Am J Ophthalmol. 141, 868–875. doi: 10.1016/j.ajo.2005.12.007. - DOI - PubMed

Publication types

MeSH terms