. 2021 Feb:64:103233.
doi: 10.1016/j.ebiom.2021.103233. Epub 2021 Feb 18.

Immune profiling of Mycobacterium tuberculosis-specific T cells in recent and remote infection

Affiliations

Immune profiling of Mycobacterium tuberculosis-specific T cells in recent and remote infection

Cheleka A M Mpande et al. EBioMedicine. 2021 Feb.

Abstract

Background: Recent Mycobacterium tuberculosis (M.tb) infection is associated with a higher risk of progression to tuberculosis disease, compared to persistent infection after remote exposure. However, current immunodiagnostic tools fail to distinguish between recent and remote infection. We aimed to characterise the immunobiology associated with acquisition of M.tb infection and identify a biomarker that can distinguish recent from remote infection.

Methods: Healthy South African adolescents were serially tested with QuantiFERON-TB Gold to define recent (QuantiFERON-TB conversion <6 months) and persistent (QuantiFERON-TB+ for >1.5 year) infection. We characterised M.tb-specific CD4 T cell functional (IFN-γ, TNF, IL-2, CD107, CD154), memory (CD45RA, CCR7, CD27, KLRG-1) and activation (HLA-DR) profiles by flow cytometry after CFP-10/ESAT-6 peptide pool or M.tb lysate stimulation. We then assessed the diagnostic performance of immune profiles that were differentially expressed between individuals with recent or persistent QuantiFERON-TB+.

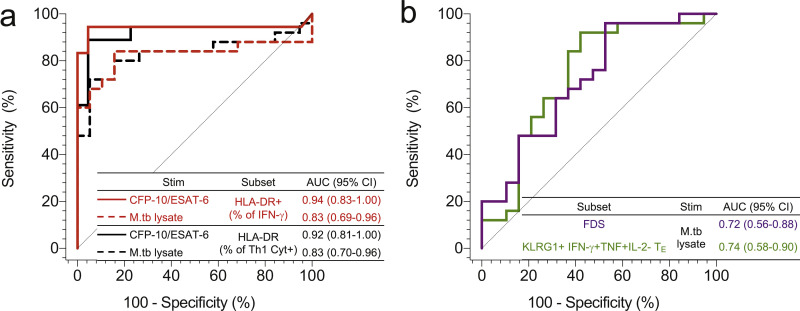
Findings: CFP-10/ESAT-6-specific CD4 T cell activation but not functional or memory phenotypes distinguished between individuals with recent and persistent QuantiFERON-TB+. In response to M.tb lysate, recent QuantiFERON-TB+ individuals had lower proportions of highly differentiated IFN-γ+TNF+ CD4 T cells expressing a KLRG-1+ effector phenotype and higher proportions of early differentiated IFN-γ-TNF+IL-2+ and activated CD4 T cells compared to persistent QuantiFERON-TB+ individuals. Among all differentially expressed T cell features CFP-10/ESAT-6-specific CD4 T cell activation was the best performing diagnostic biomarker of recent infection.

Interpretation: Recent M.tb infection is associated with highly activated and moderately differentiated functional M.tb-specific T cell subsets, that can be used as biomarkers to distinguish between recent and remote infection.

Funding: US National Institutes of Health (NIH), Bill and Melinda Gates Foundation, South African National Research Foundation, South African Medical Research Council, and Aeras.

Keywords: Biomarker; Recent infection; T cell activation; T cell differentiation; Tuberculosis.


Conflict of interest statement

Declaration of Interests EN reports grants to the University of Cape Town from AERAS, Bill & Melinda Gates Foundation and NIH during the conduct of the study. TJS reports grants to the University of Cape Town from AERAS, Bill & Melinda Gates Foundation, and NIH during the conduct of the study. All other authors declare no competing interests.

Figures

Fig 1
Fig. 1
Longitudinal QFT (and TST) kinetics in the biomarker discovery and tetramer cohorts. M.tb infection was defined using longitudinal (a) QFT (only) results for the biomarker discovery cohort [recent QFT+ (red symbols, n=30 for all time points) and persistent QFT+ (black symbols, n= 30 for all time points)], and (b) both QFT (green) and TST (magenta) results for the tetramer cohort (n=11 for all time points). Longitudinal QFT+ and TST results are depicted as median with an interquartile range (IQR). Dotted lines indicate the assay positivity cut-offs. Only samples collected at time points marked with “X” were analysed in this study. The image in (a) depicts comparisons that were performed on the biomarker discovery cohort: (i) QFT− vs recent QFT+ and (ii) recent vs persistent QFT+.
Fig 2
Fig. 2
Recent QFT conversion induces similar CFP-10/ESAT-6-specific CD4 T cell cytokine co-expression profiles as in persistent QFT+ individuals. (a) Frequencies of background subtracted CFP-10/ESAT-6-specific IFN-γ+, TNF+, IL-2+, CD154+ and CD107+ CD4 T cells and (b) COMPASS analysis results [functionality scores, polyfunctionality scores and posterior probability heat map (CFP-10-ESAT-6 stimulation)] of M.tb-specific CD4 T cells detected before (QFT−, blue, CFP-10/ESAT-6, n=26; M.tb lysate, n=22), after (recent QFT+, red, CFP-10/ESAT-6, n=26; M.tb lysate, n=26) and during persistent M.tb infection (persistent QFT+, black, CFP-10/ESAT-6, n=25; M.tb lysate, n=20). P-values were calculated using the Wilcoxon-signed rank test for paired (QFT− versus recent QFT+) or the Mann–Whitney U test for unpaired (recent versus persistent QFT+) comparisons and corrected for multiple comparison using the Benjamini–Hochberg method with a false discovery rate (FDR) of 0.05. P-values highlighted in red, bold text were considered significant.
Fig 3
Fig. 3
Recent QFT+ is associated with lower proportions of M.tb lysate-specific functionally differentiated CD4 T cell subsets than persistent QFT+. (a) Proportions of M.tb lysate-specific Th1 polyfunctional profiles detected before (QFT−, n= 16), after (recent QFT+, n=25) and during persistent M.tb infection (persistent QFT+, n=22) in responders only. (b) Functional differentiation scores of M.tb-specific CD4 T cells before (QFT−, M.tb lysate, n= 16), after (recent QFT+, CFP-10/ESAT-6, n= 18; M.tb lysate, n=25), and during persistent M.tb infection (black symbols, CFP-10/ESAT-6, n= 22; M.tb lysate, n=19) in responders only. P-values were calculated using the Wilcoxon-signed rank test for paired (QFT− versus recent QFT+) or the Mann–Whitney U test for unpaired (recent versus persistent QFT+) comparisons and corrected for multiple comparison using the Benjamini–Hochberg method with a false discovery rate (FDR) of 0.05. P-values highlighted in red, bold text were considered significant.
Fig 4
Fig. 4
Induction of highly differentiated polyfunctional TE cells upon recent QFT conversion at the expense of less differentiated IFN-γ-independent TSCM and TCM subsets. Proportions of (a) M.tb lysate-specific and CFP-10/ESAT6-specific memory/cytokine co-expression subsets before (QFT−, blue, M.tb lysate, n= 16), after (recent QFT+, red, CFP-10/ESAT-6, n= 18; M.tb lysate, n=25), and during persistent M.tb infection (persistent QFT+, black, CFP-10/ESAT-6, n= 22; M.tb lysate, n=19). The CITRUS cluster number corresponding to the manually gated populations is shown. (b) Proportions of TE TNF only M.tb lysate-specific and CFP-10/ESAT-6-specific CD4 T cells detected before, after and during persistent M.tb infection (number of participants is as in A). Statistical analysis was conducted as in Fig. 2, clusters and p-values highlighted in red, bold text were considered significantly different.
Fig 5
Fig. 5
Recent QFT+ is associated with higher levels of T cell activation than persistent QFT+. (a) Graphs depict proportions of HLA-DR+ CFP-10/ESAT-6- and M.tb lysate-specific IFN-γ+ or Total Th1 cytokine+ (IFN-γ±TNF±IL-2±) CD4 T cells before (QFT−, blue, M.tb lysate: n= 16), after (recent QFT+, red, CFP-10/ESAT-6: n=18; M.tb lysate: n= 25), and during persistent M.tb infection (persistent QFT+, black, CFP-10/ESAT-6: n=22; M.tb lysate: n=19). Statistical analysis was conducted as in Fig. 2. (b) Proportions of HLA-DR+ M.tb-specific tetramer+ (green), bulk naïve (grey, CD45RA+CCR7+CD27+CD95-) and bulk memory (brown, non-naïve T cells) CD4+ T cells are represented by median (symbol) and IQRs (bars) in recent QFT+ (tetramer cohort, Month 0: n = 11; Month 6: n=12; Month 11: n=17; Month 18: n=12) individuals. Some individuals were stained with more than one tetramer. P-values for (b) were calculated with the Wilcoxon signed-rank test. P-values <0.016 (for a) and < 0.05 (for b), highlighted in bold were considered significant.
Fig 6
Fig. 6
T cell activation is a biomarker of recent M.tb infection. ROC analysis of the diagnostic potential of M.tb-specific CD4 T cells subsets: (a) IFN-γ+ and Th1 cytokine+ T cell activation and (b) polyfunctional/memory subsets. All populations are significant based on 95% confidence intervals (CI) that do not cross 0.5.

References

    1. World Health Organisation. Global tuberculosis report 2020. Licence: CC BY-NC-SA 3.0 IGO. Available from: https://www.who.int/tb/publications/global_report/en/ (Accessed October 15 2020).
    1. Behr MA, Edelstein PH, Ramakrishnan L. Revisiting the timetable of tuberculosis. BMJ. 2018;362:k2738. doi: 10.1136/bmj.k2738. - DOI - PMC - PubMed
    1. Erkens CGM, Slump E, Verhagen M, Schimmel H, Cobelens F, Hof S van den. Risk of developing tuberculosis disease among persons diagnosed with latent tuberculosis infection in the Netherlands. Eur Respir J. 2016;48:1420–1428. doi: 10.1183/13993003.01157-2016. - DOI - PubMed
    1. Morán-Mendoza O, Marion SA, Elwood K, Patrick D, FitzGerald JM. Risk factors for developing tuberculosis: a 12-year follow-up of contacts of tuberculosis cases. Int J Tuberc Lung Dis Off J Int Union Against Tuberc Lung Dis. 2010;14:1112–1119. - PubMed
    1. Trauer JM, Moyo N, Tay E-L, Dale K, Ragonnet R, McBryde ES. Risk of active tuberculosis in the five years following infection . . . 15%? Chest. 2016;149:516–525. doi: 10.1016/j.chest.2015.11.017. - DOI - PubMed

MeSH terms