. 2021 Jan-Jun:296:100437.
doi: 10.1016/j.jbc.2021.100437. Epub 2021 Feb 19.

An animal model for mitochondrial tyrosyl-tRNA synthetase deficiency reveals links between oxidative phosphorylation and retinal function

Affiliations

An animal model for mitochondrial tyrosyl-tRNA synthetase deficiency reveals links between oxidative phosphorylation and retinal function

Xiaofen Jin et al. J Biol Chem. 2021 Jan-Jun.

Abstract

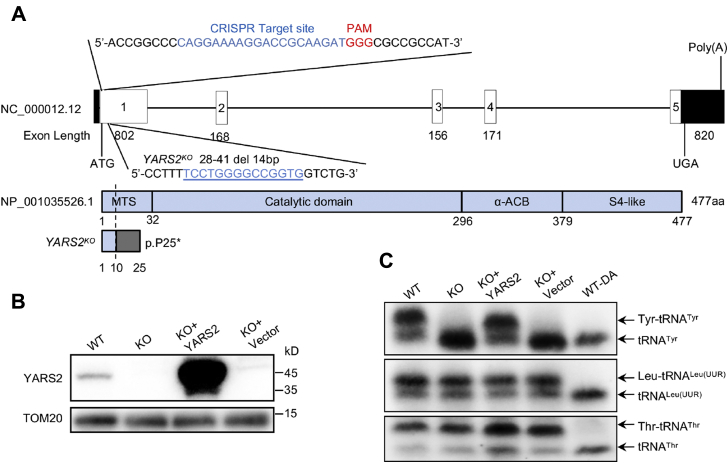
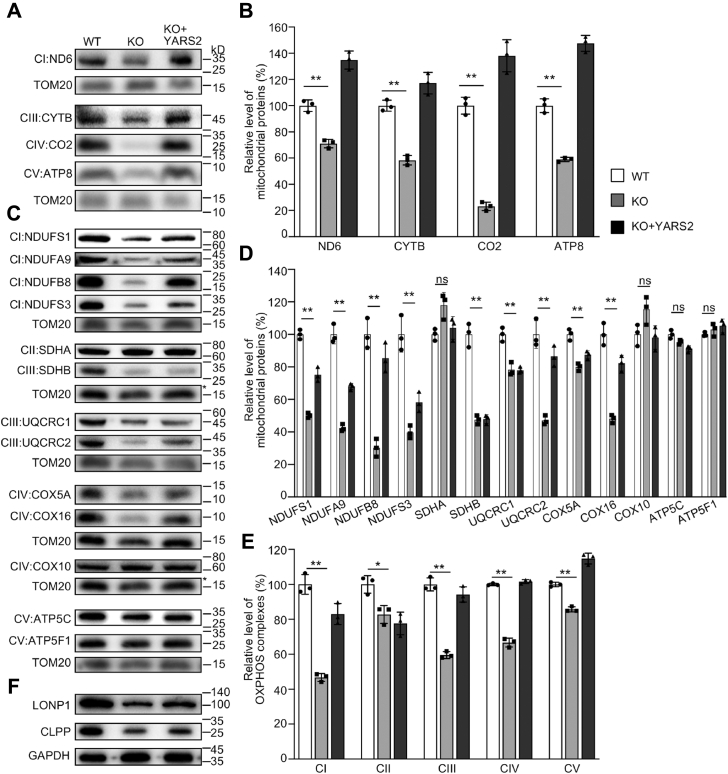
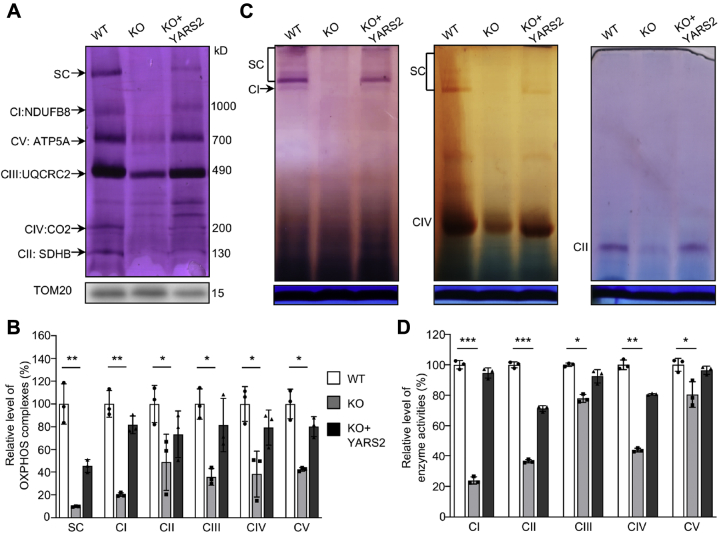
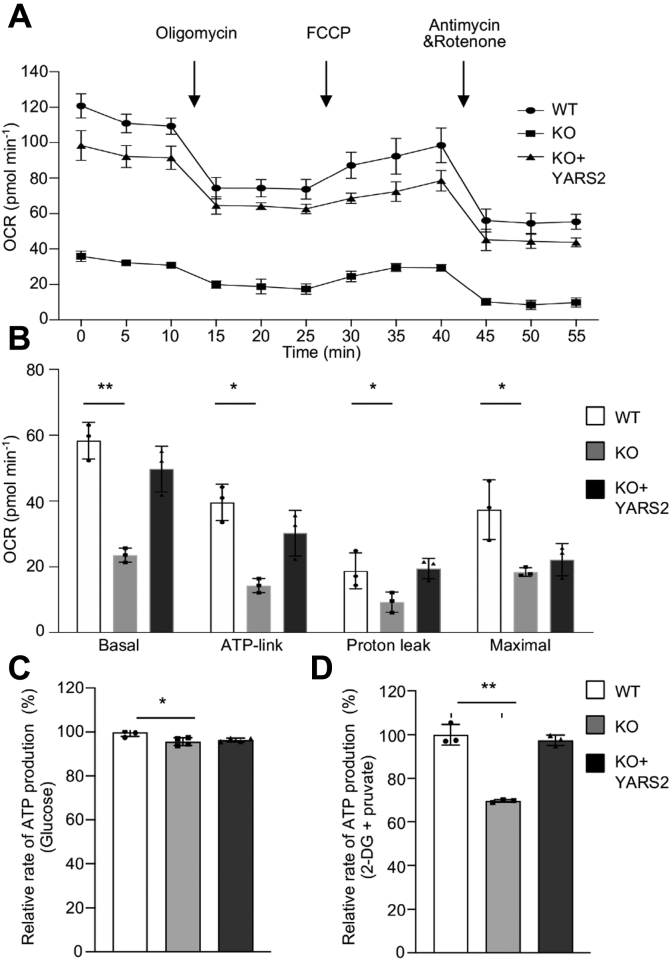
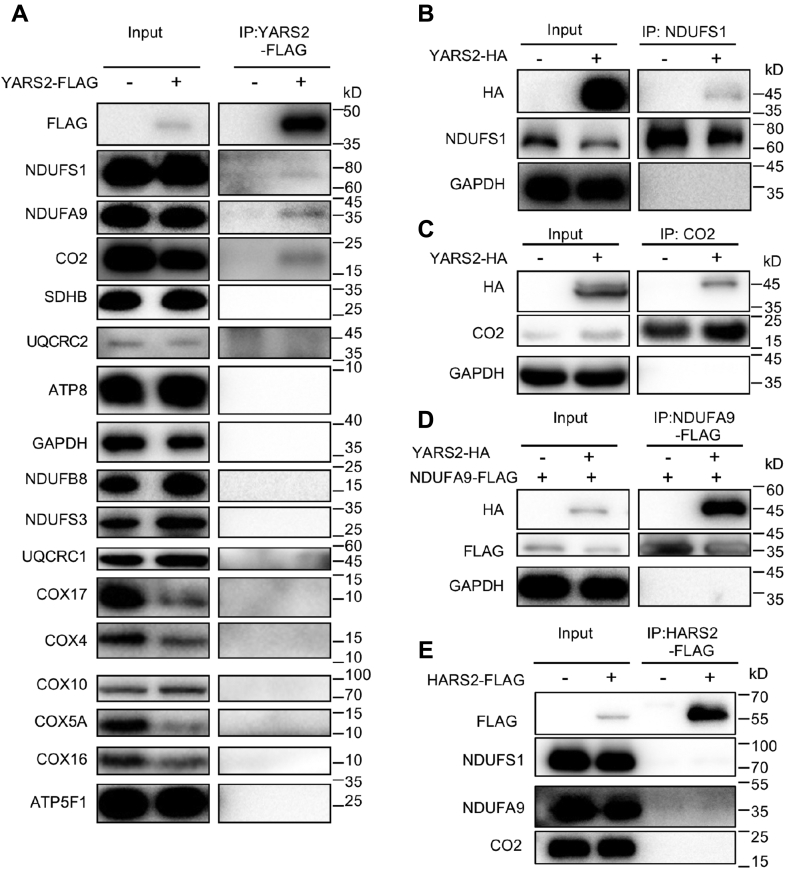
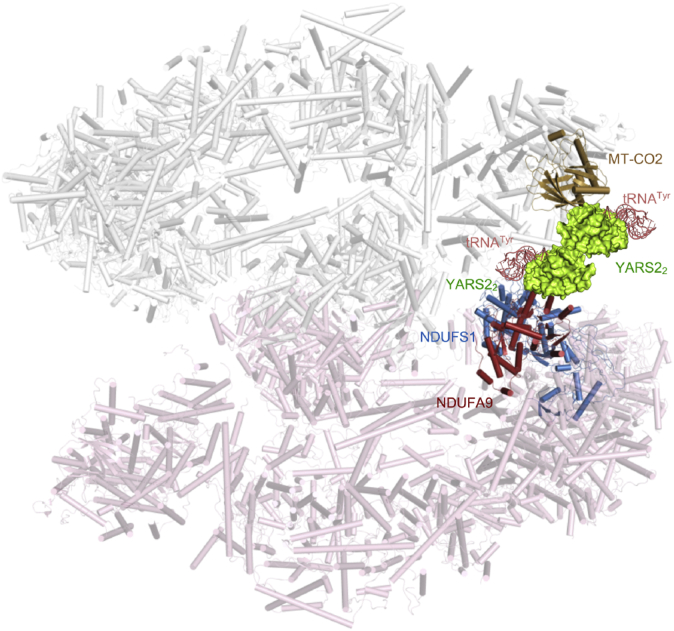
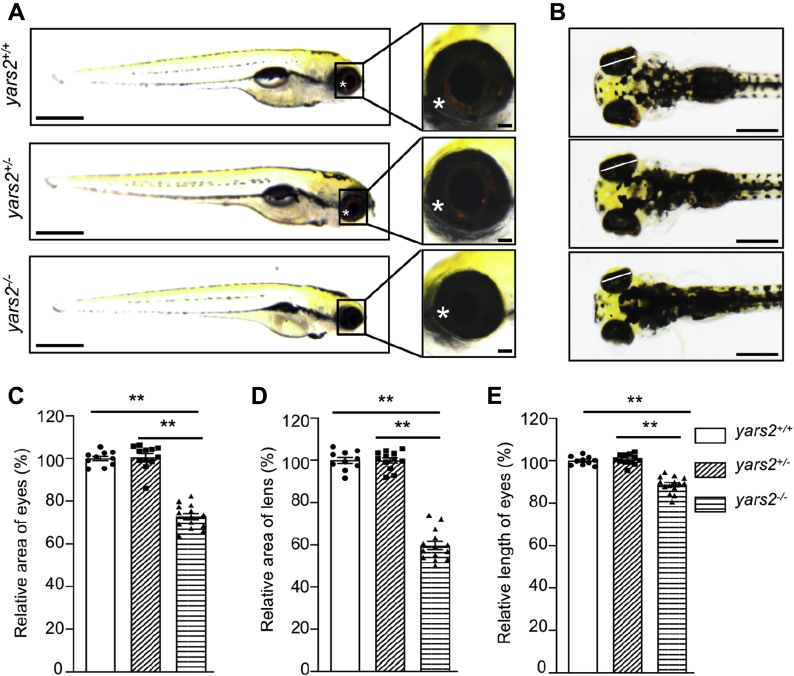
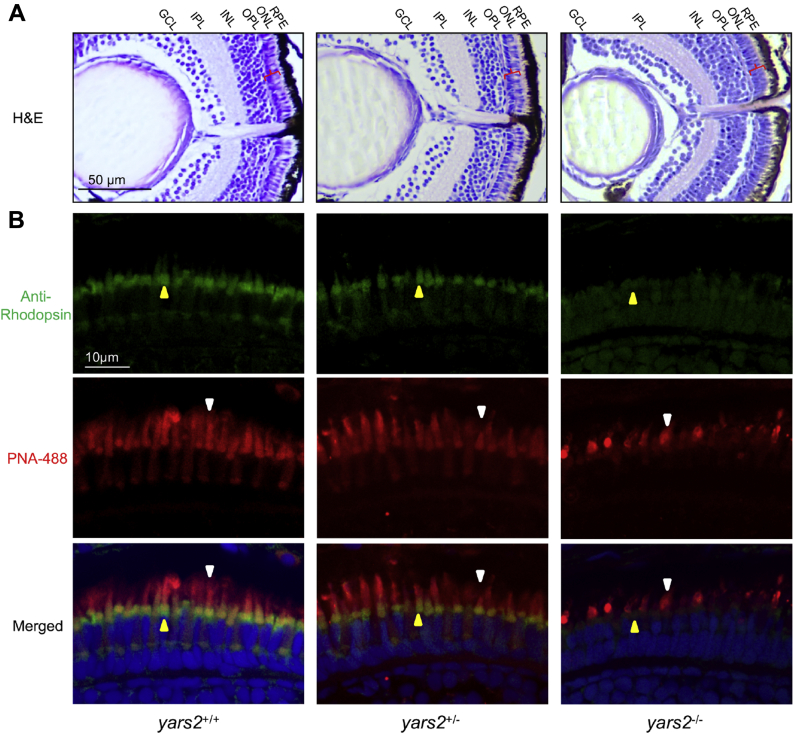
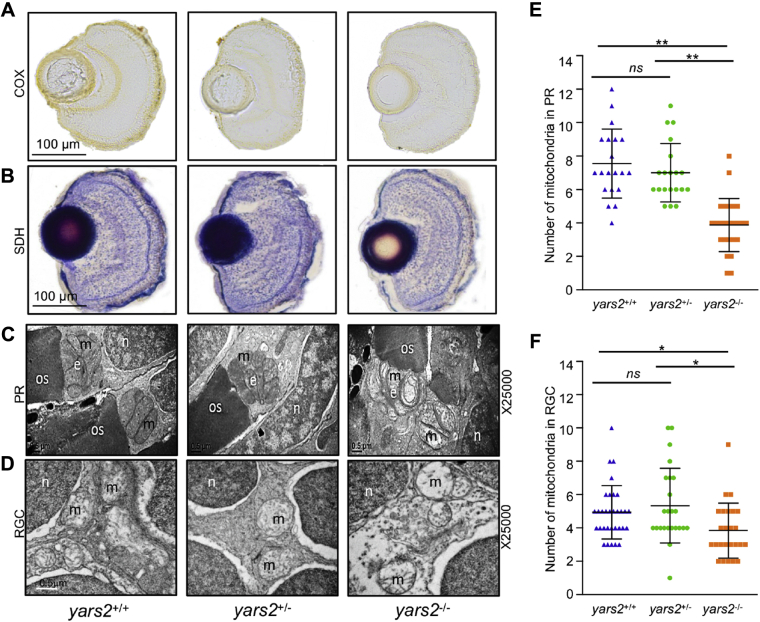
Mitochondria maintain a distinct pool of ribosomal machinery, including tRNAs and tRNAs activating enzymes, such as mitochondrial tyrosyl-tRNA synthetase (YARS2). Mutations in YARS2, which typically lead to the impairment of mitochondrial protein synthesis, have been linked to an array of human diseases including optic neuropathy. However, the lack of YARS2 mutation animal model makes us difficult to elucidate the pathophysiology underlying YARS2 deficiency. To explore this system, we generated YARS2 knockout (KO) HeLa cells and zebrafish using CRISPR/Cas9 technology. We observed the aberrant tRNATyr aminoacylation overall and reductions in the levels in mitochondrion- and nucleus-encoding subunits of oxidative phosphorylation system (OXPHOS), which were especially pronounced effects in the subunits of complex I and complex IV. These deficiencies manifested the decreased levels of intact supercomplexes overall. Immunoprecipitation assays showed that YARS2 bound to specific subunits of complex I and complex IV, suggesting the posttranslational stabilization of OXPHOS. Furthermore, YARS2 ablation caused defects in the stability and activities of OXPHOS complexes. These biochemical defects could be rescued by the overexpression of YARS2 cDNA in the YARS2KO cells. In zebrafish, the yars2KO larva conferred deficient COX activities in the retina, abnormal mitochondrial morphology, and numbers in the photoreceptor and retinal ganglion cells. The zebrafish further exhibited the retinal defects affecting both rods and cones. Vision defects in yars2KO zebrafish recapitulated the clinical phenotypes in the optic neuropathy patients carrying the YARS2 mutations. Our findings highlighted the critical role of YARS2 in the stability and activity of OXPHOS and its pathological consequence in vision impairments.

Keywords: animal disease model; mitochondrial tyrosyl-tRNA synthetase; oxidative phosphorylation; retina; vision function.


Conflict of interest statement

Conflict of interest All the authors declare that they have no conflict of interest with the contents of this article.

Figures

Figure 1
Figure 1
Generation of YARS2 knockout HeLa cell lines using CRISPR/Cas9 system.A, schematic representation of CRISPR/Cas9 target site at exon 1 as used in this study. An allele, YARS2del14bp was produced by a 14 bp delete in the exon 1 and a truncated nonfunctional protein with 24 amino acids. B, western blot analysis of YARS2 in various cells. Twenty micrograms of total cellular proteins of each cell line was electrophoresed through and hybridized with antibodies specific for YARS2 (1:1000 dilution) and with TOM20 (1:2000 dilution) as a loading control. WT, wild-type cells; KO, YARS2KO; KO+YARS2, exogenous YARS2 expression in YARS2KO; KO+vector, vector transfected in YARS2KO. Three independent experiments were performed. C, in vivo aminoacylation of mitochondrial tRNA assays. Ten micrograms of total cellular RNAs purified from various cell lines under acid conditions was electrophoresed through an acid (pH 5.2) 10% polyacrylamide-7 M urea gel, electroblotted, and hybridized with DIG-labeled oligonucleotide probe specific for the tRNATyr, tRNALeu(UUR), and tRNAThr, respectively. Samples for WT cells were deacylated (DA) by heating for 10 min at 60 °C at pH 8.3, electrophoresed, and hybridized with DIG-labeled oligonucleotide probes as described above. Three independent experiments were performed.
Figure 2
Figure 2
Western blotting analysis of mitochondrial proteins. A and C, twenty micrograms of total cellular proteins from various cell lines was electrophoresed through a denaturing polyacrylamide gel, electroblotted, and hybridized with antibodies for 17 subunits of OXPHOS (4 encoded by mtDNA and 13 encoded by nuclear genes), and TOM20 as a loading control, respectively. B and D, quantification of mitochondrial proteins: four mtDNA-encoding subunits (B) and 13 nucleus-encoding subunits (D). Average relative each polypeptide content per cell was normalized to the average content per cell of Tom20 in each cell line. The values for the latter are expressed as percentages of the average values for the WT HeLa cell line. The calculations were based on three independent determinations. The error bars indicate two standard deviations (SD) of the means. p indicates the significance, according to the t-test, of the differences between mutant and control cell lines. ∗p < 0.05; ∗∗p < 0.001; ∗∗∗p < 0.0001; ns, not significant. E, average levels of subunits from each complex of OXPHOS (5 of complexes I, 2 of II, 3 of III, 4 of IV, and 3 of V). The calculations were based on three independent determinations. Graph details and symbols are explained as above. F, western blot analysis of Clpp involved in mitochondrial ribosome assembly and LONP1 that is a nuclear-encoded mitochondrial protease.
Figure 3
Figure 3
Analysis of stability and activity of OXPHOS complexes.A, assembly and stability of OXPHOS complexes. Mitochondria extracted from various cell lines were solubilized with n-dodecyl-β-D-maltoside, electroblotted, and hybridized with antibody cocktail specific for subunits of five OXPHOS complexes and with TOM20 as a loading control. B, quantification of the levels of complexes I, II, III, IV, V and supercomplexes (SC) in mutant and wild-type cell lines. The calculations were based on three independent determinations. C, in-gel activity of respiratory chain complexes I, II, and IV. A total of 20 μg of mitochondrial proteins (8 g/g digitonin/protein ratio) from various cell lines was used for BN-PAGE, and the activities of complexes were measured in the presence of specific substrates (NADH and NTB for complex I, sodium succinate, phenazine methosulfate, and NTB for complex II, DAB and cytochrome c for complex IV). Coomassie staining was used as a loading control. D, enzymatic activities of respiratory chain complexes. The activities of respiratory complexes were investigated by enzymatic assay on complexes I, II, III, IV, and V in mitochondria isolated from various cell lines. The calculations were based on three independent experiments. Graph details and symbols are explained in the legend to Figure 2.
Figure 4
Figure 4
Deficient oxidative phosphorylation.A, an analysis of O2 consumption in the various cell lines using different inhibitors. The rates of O2 (OCR) were first measured on 2 × 104 cells of each cell line under basal condition and then sequentially added to oligomycin (1.5 mM), carbonyl cyanide p-(trifluoromethoxy) phenylhydrazone (FCCP) (0.5 mM), rotenone (1.0 mM), and antimycin A (1.0 mM) at indicated times to determine different parameters of mitochondrial functions. B, graphs presented the basal OCR, ATP-linked OCR, proton leak OCR, and maximal OCR in cell lines. Basal OCR was determined as OCR before oligomycin minus OCR after rotenone/antimycin A. ATP-lined OCR was determined as OCR before oligomycin minus OCR after oligomycin. Proton leak was determined as Basal OCR minus ATP-linked OCR. Maximal was determined as the OCR after FCCP minus nonmitochondrial OCR. C and D, measurement of whole-cell and mitochondrial ATP levels using bioluminescence assay. Cells were incubated with 10 mM glucose or 5 mM 2-deoxy-d-glucose plus 5 mM pyruvate to determine ATP generation under mitochondrial ATP synthesis. Average rates of ATP level per cell line and are shown: (C) ATP levels in total cells. D, ATP levels in mitochondria. Three independent experiments were made for each cell line. Graph details and symbols are explained in the legend to Figure 2.
Figure 5
Figure 5
Immunoprecipitation analysis of YARS2 with subunits of OXPHOS complexes. A, co-immunoprecipitation of YARS2-FLAG and subunits of OXPHOS. HeLa cells transiently expressing with or without YARS2-FLAG were solubilized with a lysis buffer and lysate proteins were immunoprecipitated with immunocapture buffer (left) (input) and FLAG-antibody (right) (IP), respectively. Immunoprecipitates were analyzed by SDS-PAGE and western blotting using anti-FLAG, anti-subunits of OXPHOS (NDUFS1, NDUFS3, NDUFA9 and NDUFB8 for complex I, SDHB for complex II, UQCRC1 and UQCRC2 for complex III, CO2, COX4, COX5A, COX10, COX16, and COX17 for complex IV, ATP8 and ATP5F1 for complex V) and GAPDH antibodies, respectively. B and C, co-immunoprecipitation of YARS2-HA and NDUFS1, CO2 using anti-HA, anti-NDUFS1, CO2, and GAPDH antibodies, respectively. D, co-immunoprecipitation of YARS2-HA and NDUFS9A-FLAG using anti-HA, anti-FLAG, and GAPDH antibodies, respectively. E, co-immunoprecipitation of HARS2-FLAG and NDUFS1, NDUFA9, CO2 in lysates of HeLa cells transfected with plasmids containing HARS2 using anti-FLAG, anti-NDUFS1, NDUFA9, and CO2 antibodies respectively.
Figure 6
Figure 6
The proposed model of YARS2 interacting with the OXPHOS supercomplex. The partial OXPHOS supercomplex was derived from (MCI2III2IV2, PDB: 5XTI) (41). The structure of Thermus thermophilus tryosyl-tRNA synthetase and tRNATyr complex (PDB ID: 1H3E) was used as an original templet for construction of the model of humanYARS2-tRNATyr complex. The structure of YARS2 was extracted from the crystal structures of human mitochondrial tyrosyl-tRNA synthetase (PDB ID: 2PID) (42). The model of human YARS2-tRNATyr complex was generated using PyMOL molecular visualization system (PyMOL Molecular Graphics System, Version 2.3.3, Schrödinger, LLC). A model of YARS2 interacting with the OXPHOS supercomplex was proposed as the YARS2 homodimer–tRNATyr complex interacts with CO2 of CIV, NDUFS1 and NDUFA9 of membrane arm of CI in the megacomplexes I2III2IV2, respectively.
Figure 7
Figure 7
Deletion of yars2 caused the eye defects in zebrafish.A, the lateral views of yars2−/−, yars2+/−, and yars2+/+ zebrafish at 5 dpf, and the eye morphologies of zebrafish were illustrated under a Leica microscope with an objective magnification of 20×. Asterisk indicated the eye pigments. B, the dorsal views of the yars2+/+, yars2+/−, and yars2−/− zebrafish at 5 dpf. CE, quantification of the area and length of eyes as well as area of lens of yars2+/+ (n = 10), yars2+/− (n = 12), and yars2−/− (n = 14) zebrafish, as detailed elsewhere (47). The values for the mutants were expressed as percentages of the average values for the wild type. Graph details and symbols are explained in the legend to Figure 2.
Figure 8
Figure 8
Retina defects in zebrafish. A, hematoxylin and eosin (HE) staining of retinas in the yars2+/+, yars2+/−, and yars2−/− zebrafish at 5 dpf. GCL, ganglion cell layer; INL, inner nuclear layer; IPL, inner plexiform layer; ONL, outer nuclear layer; OPL, outer plexiform layer; RPE, retinal pigment epithelium. The angle brackets colored in red denoted the ONL. Scale bar, 50 μm. Shorter outer segments in the cones and rods were indicated. B, cones and rods in the retinal cross sections of yars2+/+, yars2+/−, and yars2−/− zebrafish at 5 dpf, stained with lectin PNA-488 (green, yellow arrows) and 1D4/Rhodopsin (red, white arrows) and DAPI (blue) staining for nuclei. Scale bar, 10 μm.
Figure 9
Figure 9
Mitochondrial defects in the zebrafish retina.A and B, assessment of mitochondrial function in the retina by enzyme histochemistry (EHC) staining for COX (A) and SDH (B) in the frozen sections of retina in the yars2+/+, yars2+/−, and yars2−/− larvae at 5 dpf. Scale bar, 100 μm. C and D, mitochondrial morphology from photoreceptors (PR) (C) and RGC (D) of transmission electron microscopy. Ultrathin sections were visualized with 25,000× magnification. Scale bar, 1 μm. e, ellipsoid; m, mitochondrion; n, nucleus; os, outer segment of photoreceptors. E and F, quantification of mitochondrial numbers of photoreceptors (E) from yars2+/+ (n = 20), yars2+/− (n = 20), and yars2−/− (n = 25) and RGC (F) from yars2+/+ (n = 32), yars2+/− (n = 24), and yars2−/− (n = 25) zebrafish at 5dpf. Graph details and symbols are explained in the legend to Figure 2.

Similar articles

Cited by

References

    1. Wallace D.C. Mitochondrial genetic medicine. Nat. Genet. 2018;50:1642–1649. - PubMed
    1. Craven L., Alston C.L., Taylor R.W., Turnbull D.M. Recent advances in mitochondrial disease. Annu. Rev. Genomics Hum. Genet. 2017;18:257–275. - PubMed
    1. DiMauro S., Schon E.A. Mitochondrial disorders in the nervous system. Annu. Rev. Neurosci. 2008;31:91–123. - PubMed
    1. Suzuki T., Nagao A., Suzuki T. Human mitochondrial tRNAs: Biogenesis, function, structural aspects, and diseases. Annu. Rev. Genet. 2011;45:299–329. - PubMed
    1. Guan M.X. Mitochondrial 12S rRNA mutations associated with aminoglycoside ototoxicity. Mitochondrion. 2011;11:237–245. - PubMed

Publication types

MeSH terms