. 2021 Apr 16;433(8):166878.
doi: 10.1016/j.jmb.2021.166878. Epub 2021 Feb 19.

Brazilin Removes Toxic Alpha-Synuclein and Seeding Competent Assemblies from Parkinson Brain by Altering Conformational Equilibrium

Affiliations

Brazilin Removes Toxic Alpha-Synuclein and Seeding Competent Assemblies from Parkinson Brain by Altering Conformational Equilibrium

George R Nahass et al. J Mol Biol. .

Abstract

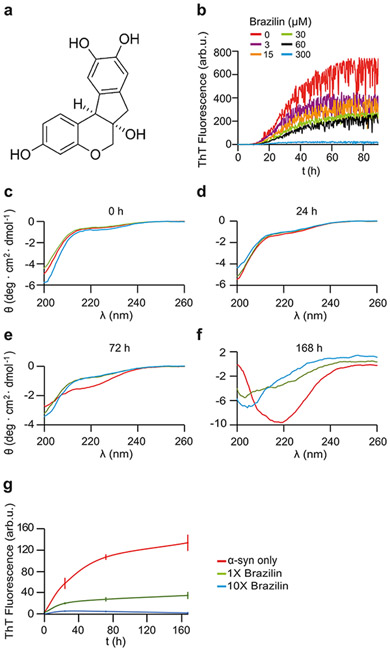
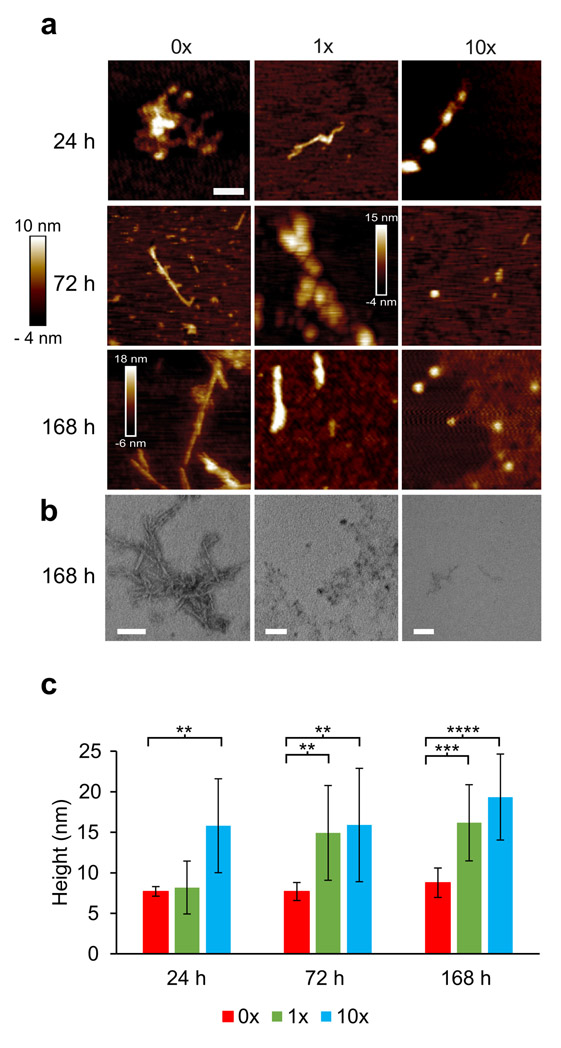
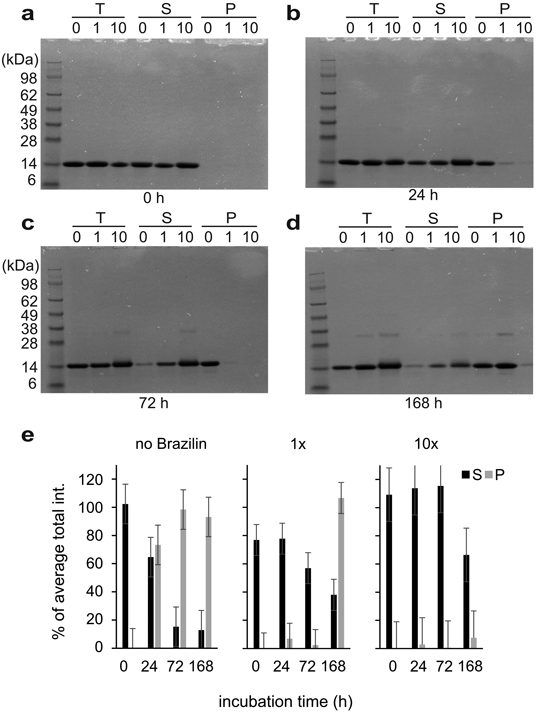
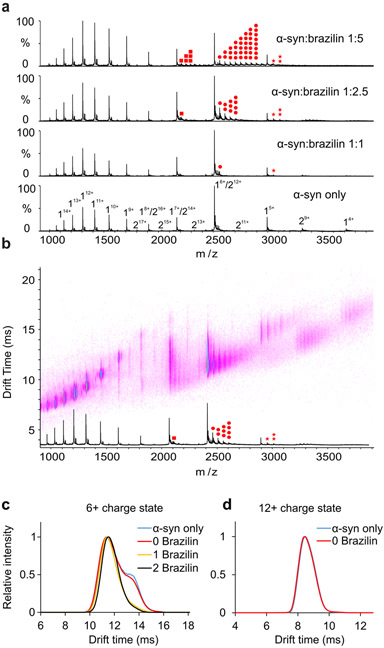
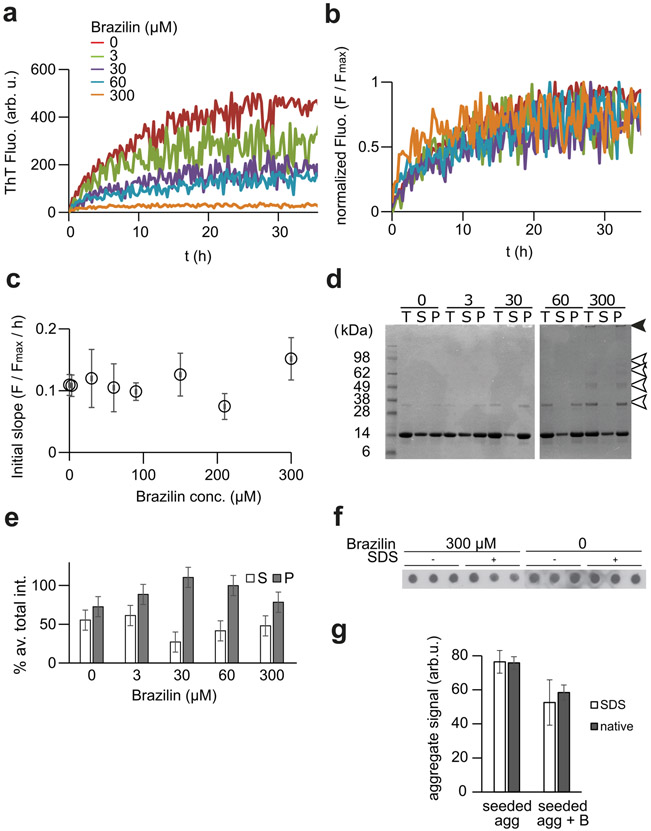
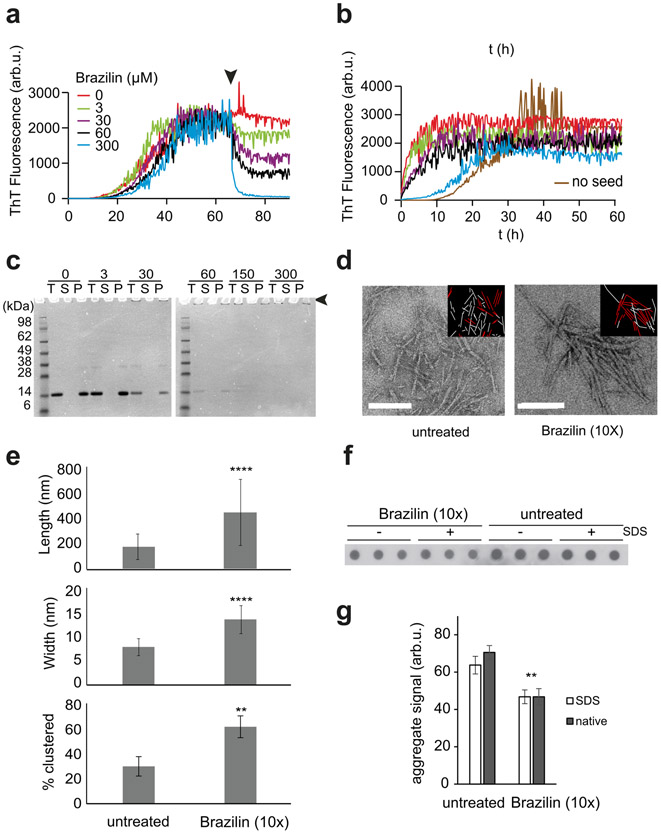
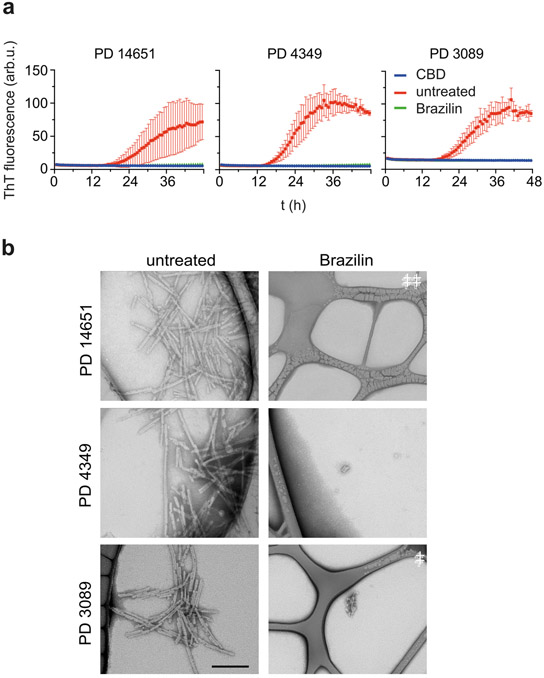
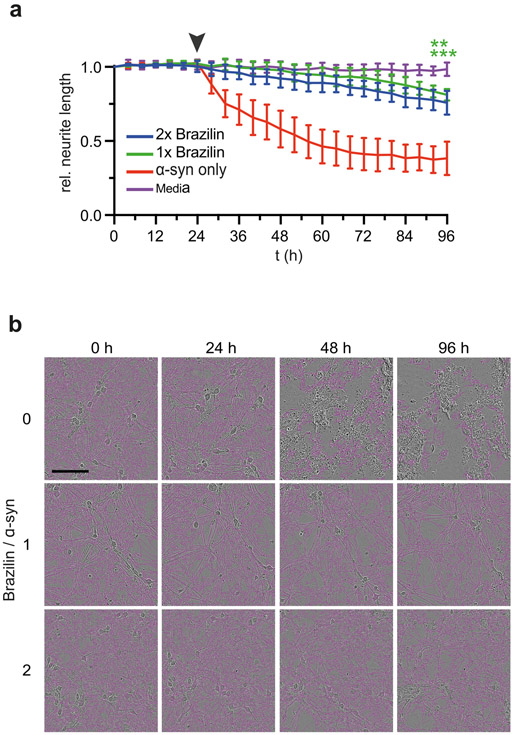
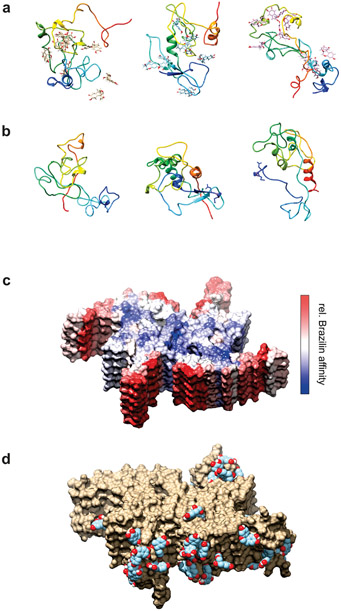
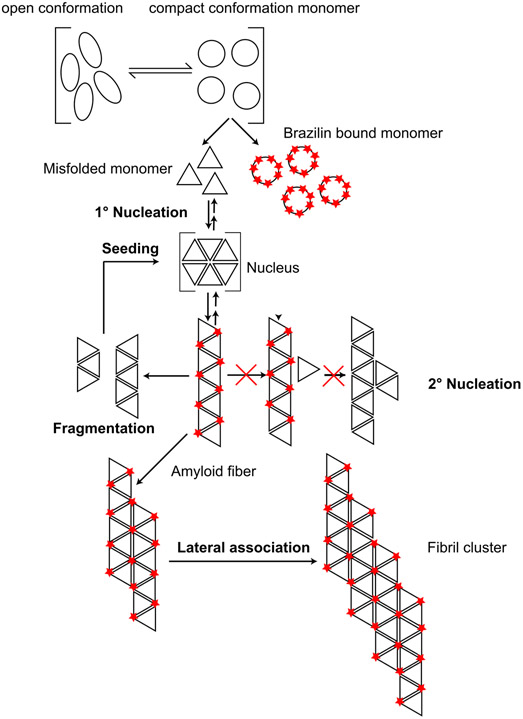
Alpha-synuclein (α-syn) fibrils, a major constituent of the neurotoxic Lewy Bodies in Parkinson's disease, form via nucleation dependent polymerization and can replicate by a seeding mechanism. Brazilin, a small molecule derived from red cedarwood trees in Brazil, has been shown to inhibit the fibrillogenesis of amyloid-beta (Aβ) and α-syn as well as remodel mature fibrils and reduce cytotoxicity. Here we test the effects of Brazilin on both seeded and unseeded α-syn fibril formation and show that the natural polyphenol inhibits fibrillogenesis of α-syn by a unique mechanism that alters conformational equilibria in two separate points of the assembly mechanism: Brazilin preserves the natively unfolded state of α-syn by specifically binding to the compact conformation of the α-syn monomer. Brazilin also eliminates seeding competence of α-syn assemblies from Parkinson's disease patient brain tissue, and reduces toxicity of pre-formed assemblies in primary neurons by inducing the formation of large fibril clusters. Molecular docking of Brazilin shows the molecule to interact both with unfolded α-syn monomers and with the cross-β sheet structure of α-syn fibrils. Our findings suggest that Brazilin has substantial potential as a neuroprotective and therapeutic agent for Parkinson's disease.

Keywords: Amyloid; Molecular Modelling; Neurdegeneration; Parkinson’s disease; Polyphenol.


Conflict of interest statement

Declaration of Competing Interest The authors declare that they have no known competing financial interests or personal relationships that could have appeared to influence the work reported in this paper.

Figures

Figure 1:
Figure 1:
a) Structure of Brazilin molecule. b) Buffer subtracted ThT kinetic aggregation data of α-syn and Brazilin. Graphs represent averages of triplicate curves with Brazilin concentrations from 0 - 300 μM as indicated by the color coding of graphs. c-f) Circular dichroism (CD) spectra of 50 μM α-syn in ThT buffer with 0x (red), 1x (green), 10x (blue) molar ratio Brazilin at 0 h (c), 24 h (d), 72 h (e), and 168 h (f). g) ThT kinetics of CD samples after 2 minutes of sonication; means ± SD, n = 3.
Figure 2:
Figure 2:
a) Atomic force microscopy (AFM) and transmission electron microscopy images taken at 24 h, 72 h, and 168 h time points of α-syn (50 μM) incubated with Brazilin (0x, 1x, 10x); scale bar is 200 nm. b) TEM images of α-syn (50 μM) incubated with Brazilin (0x, 1x, 10x) for 168 h; scale bar is 100 nm. c) Analysis of aggregate heights of α-syn from AFM; bar graphs denote means ± SD, n = 6, ** p < 0.01, *** p < 0.001, **** p < 0.0001.
Figure 3:
Figure 3:
SDS PAGE gel electrophoresis of α-syn incubated with various concentrations of Brazilin (0x, 1x, and 10x) at 0 h (a), 24 h (b), 72 h (c), and 168 h (d). The T represents total, S represents supernatant taken after ultracentrifugation at 100,000 xg at 4°C for 30 minutes, and P represents the pellet after ultracentrifugation after a wash with 1x PBS resuspended in an equal buffer volume. e) Densitometric quantification of SDS-PAGE bands from supernatant (S) and pellet (P) fractions. Total (T) fractions from untreated α-syn samples from each gel were set as 100% and mean densities and SD were calculated from these data (n = 4).
Figure 4:
Figure 4:
a) Positive-ion ESI mass spectra of α-syn in the absence (DMSO) or in the presence of 20 μM, 50 μM or 100 μM Brazilin in 50 mM ammonium acetate buffer. Brazilin binds to the 5+, 6+ and 7+ charge states of α-syn monomer. The monomer of α-syn is designated by “1”, the dimer by “2”. Brazilin copies are highlighted in red dots (7+: square, 6+: circle, 5+: star; the number of dots represents the number of ligands bound). b) Native ESI-IM-MS driftscope plot of different charge states of α-syn in the presence of 50 μM Brazilin (molar ratio of protein and small molecule is 1:2.5). The ESI-IM-MS driftscope shows IMS drift time versus m/z, and the corresponding ESI mass spectrum is shown at the bottom. Brazilin copies are highlighted in red dots as shown in Figure 4a. c) Arrival time distributions of the 6+ charge state of monomeric α-syn and its different Brazilin adducts as indicated in the inset (number of small molecules bound) obtained in the absence or presence of 50 μM Brazilin (α-syn: Brazilin molar ratio of 1:2.5. Blue line: monomer only; red line: monomer remaining ligand-free in the presence of Brazilin; yellow line: 1 Brazilin bound; black line: 2 Brazilin bound). Two distinct conformations of α-syn were observed for the unbound 6+ monomeric α-syn; while only one conformation was observed for the small molecule-bound ions. d) Arrival time distributions of the 12+ charge state of monomeric α-syn in the absence or presence of 50 μM Brazilin (α-syn:Brazilin molar ratio of 1:2.5. Blue line: monomer only; red line: monomer remaining ligand free in the presence of Brazilin).
Figure 5:
Figure 5:
a) Buffer subtracted ThT kinetic aggregation data of α-syn (30μM) in ThT buffer with various concentrations of Brazilin in the presence of 5% fibrillar seed. Seeds were generated by sonication of mature fibrils for 10 minutes. b) ThT aggregation data from (a) normalized to plateau signals. c) Average initial slopes of the normalized ThT kinetic data were calculated by linear regression the first two hours of fluorescent readings. The graph represents means ± SD from two independent experiments each performed in triplicate. d) SDS-PAGE of seeded α-syn aggregation in the presence of various Brazilin concentrations. The T represents total, S represents a fraction of the supernatant taken after ultracentrifugation of the total at 100,000 xg at 4°C for 30 minutes, and P represents the pellet left after ultracentrifugation dissolved in 1:1 NaP:Loading buffer after a wash with 1x PBS. Arrows indicate SDS-resistant HMW aggregates (black) and di- and oligomers (white) f) e) Densitometric quantification of SDS-PAGE bands from supernatant (S) and pellet (P) fractions. Total (T) fractions were set as 100% and mean densities and SD were calculated from these data (n = 4). f, g) Quantification of aggregates in a filter retardation assay. α-Syn (30μM) were incubated for 72 h without or with 300 μM Brazilin in the presence of 5% seed as in (a). Samples were either boiled in 2% SDS for 5 min or not SDS-treated to quantify SDS-resistant and total aggregates were filtered through a cellulose acetate membrane, stained with anti-α-syn mAb 211 (1:2000) and quantified densitometrically. Bar graphs in g) represent mean ± SD, n = 3.
Figure 6:
Figure 6:
a) Buffer subtracted ThT kinetic aggregation data of α-syn (30μM) in ThT buffer with various concentrations of Brazilin added to mature fibrils at t = 72 h. Graphs represent averages of triplicate curves, and the arrow represents the time of Brazilin addition. b) Buffer subtracted seeded aggregation of α-syn using various concentrations of Brazilin remodeled fibrils from (a) as seeds (5%) in ThT buffer. Seeds were created by sonication on ice in a water bath for 15 minutes. c) SDS-PAGE of mature α-syn fibrils remodeled with various concentrations of Brazilin; end-point samples from (a). T represents total, S represents a fraction of the supernatant taken after ultracentrifugation of the total at 100,000 xg at 4°C for 30 minutes, and P represents the pellet left after ultracentrifugation dissolved in 1:1 NaP:Loading buffer after a wash with 1x PBS. The arrow denotes SDS resistant aggregates, which did not enter the gel. d) Negative stain TEM images of mature α-syn fibrils treated with 0 μM Brazilin or 300 μM Brazilin for 24 h; scale bar is 200 nm. The insets represent the result of fibril clustering analysis. Clustered fibrils are shown in red, non-clustered fibrils in white. e) Quantitative analysis of lengths, widths and clustering of mature α-syn fibers incubated for 24 h in the presence or absence of 300 μM Brazilin as in (c); n = 60 fibrils from three fields of view for each condition. Error bars represent standard deviation, ** denotes p < 0.01, **** p < 0.0001. f, g) Quantification of aggregates in a filter retardation assay. Mature α-syn fibrils treated with 0 μM Brazilin or 300 μM Brazilin for 24 h as in (a). Samples were either boiled in 2% SDS for 5 min or not SDS-treated to quantify SDS-resistant and total aggregates, respectively. Bar graphs in g) represent densitometric means ± SD, n = 3.
Figure 7:
Figure 7:
a) Inhibition of α-syn seeding activity by Brazilin in RT-QuIC using 2 μL of BH from three PD patient isolated post-mortem from the pre-frontal cortex and 6 μM K23Q mutant α-syn as substrate in ThT Buffer. Graphs represent average ± SD of quadruplicate curves and each reaction was performed using brain dilution of 10−4. CBD represents BH from post mortem confirmed corticobasal degeneration cases b) Transmission electron microscopy images of RT-QuIC end products from various PD patient brains. Scale bar is 200 nm.
Figure 8:
Figure 8:
a) Neurite length of primary mouse hippocampal neurons monitored by live cell imaging after incubation with Brazilin remodeled α-syn fibrils; ** denotes p ≤ 0.01, ***denotes p ≤ 0.001), means ± SD, n = 4. The arrow denotes the time of addition of α-syn to neurons. b) Live cell images of primary mouse neurons during incubation. Pink overlays represent neurites counted. Scale bar is 100 μm.
Figure 9:
Figure 9:
a), b) Simulated α-syn structures after 100 ns equilibration from three of the trajectories with Brazilin (a) and without (b). Each vertical pair started from the same initial structure. Protein chains are illustrated in rainbow coloring (N-term blue → C-term red). c), d) Simulated α-syn fibril fragment (PDB 6a6b) in the presence of ~100 mM Brazilin. (c) Structure colored according to the logarithm of the number of contacts between Brazilin and the protein. Red represents maximum contacts (highest affinity) through white to blue representing minimum contacts (lowest affinity). The upper blue face (and the lower blue face, not visible) are the directions in which addition of new monomers would extend the fiber. (d) Examples of Brazilin molecules bound to highest affinity areas of the fibril model.
Figure 10:
Figure 10:
Schematic representation of proposed Brazilin inhibition mechanism. Brazilin attacks the self-assembly mechanism at two points: a) it specifically binds to the compact, aggregation competent monomer conformation of monomeric α-syn, b) it stabilizes α-syn fibrils and promotes their lateral assembly, which inhibits replication though fibril breakage and surface-catalyzed secondary nucleation.

Similar articles

Cited by

References

    1. Hoyer W, Antony T, Cherny D, Heim G, Jovin TM, Subramaniam V, Dependence of α-synuclein aggregate morphology on solution conditions, J. Mol. Biol (2002). 10.1016/S0022-2836(02)00775-1. - DOI - PubMed
    1. Roberts RF, Wade-Martins R, Alegre-Abarrategui J, Direct visualization of alpha-synuclein oligomers reveals previously undetected pathology in Parkinson’s disease brain, Brain. (2015). 10.1093/brain/awv040. - DOI - PMC - PubMed
    1. Stuendl A, Kunadt M, Kruse N, Bartels C, Moebius W, Danzer KM, Mollenhauer B, Schneider A, Induction of α-synuclein aggregate formation by CSF exosomes from patients with Parkinson’s disease and dementia with Lewy bodies, Brain. (2016). 10.1093/brain/awv346. - DOI - PMC - PubMed
    1. Lam HT, Graber MC, Gentry KA, Bieschke J, Stabilization of α-Synuclein Fibril Clusters Prevents Fragmentation and Reduces Seeding Activity and Toxicity, Biochemistry. (2016). 10.1021/acs.biochem.5b01168. - DOI - PMC - PubMed
    1. Burré J, Sharma M, Tsetsenis T, Buchman V, Etherton MR, Südhof TC, α-Synuclein promotes SNARE-complex assembly in vivo and in vitro, Science (80-. ). (2010). 10.1126/science.1195227. - DOI - PMC - PubMed

Publication types