. 2021 Jun;213(2):107709.
doi: 10.1016/j.jsb.2021.107709. Epub 2021 Feb 18.

CorRelator: Interactive software for real-time high precision cryo-correlative light and electron microscopy

Affiliations

CorRelator: Interactive software for real-time high precision cryo-correlative light and electron microscopy

Jie E Yang et al. J Struct Biol. 2021 Jun.

Abstract

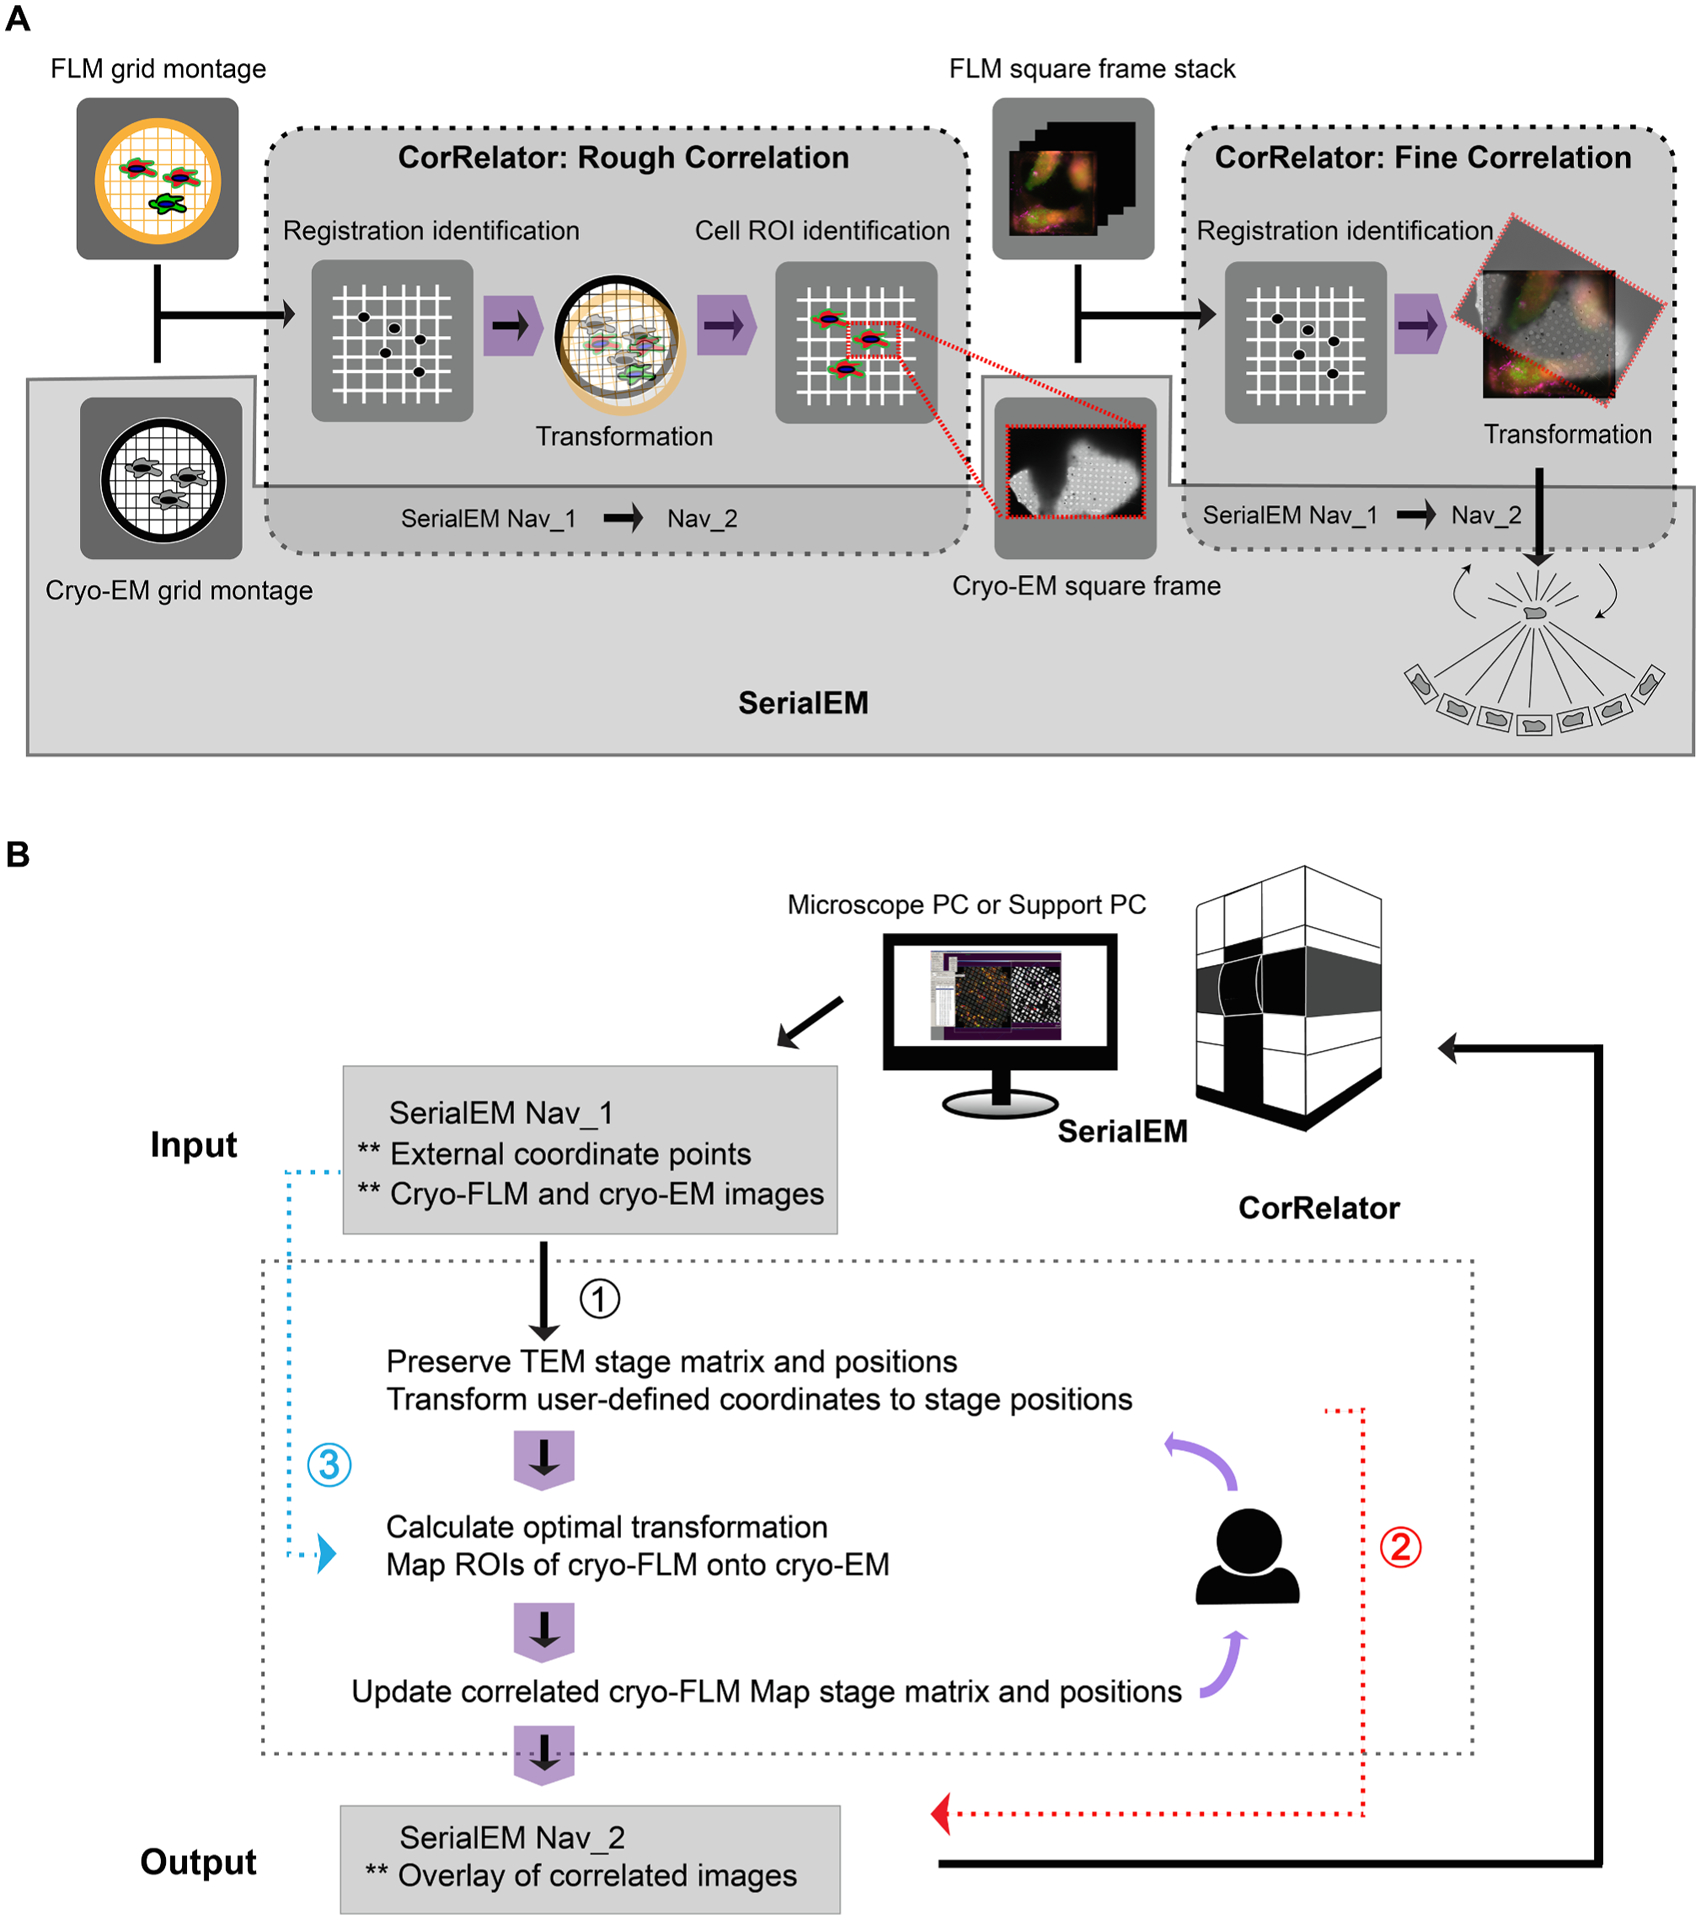
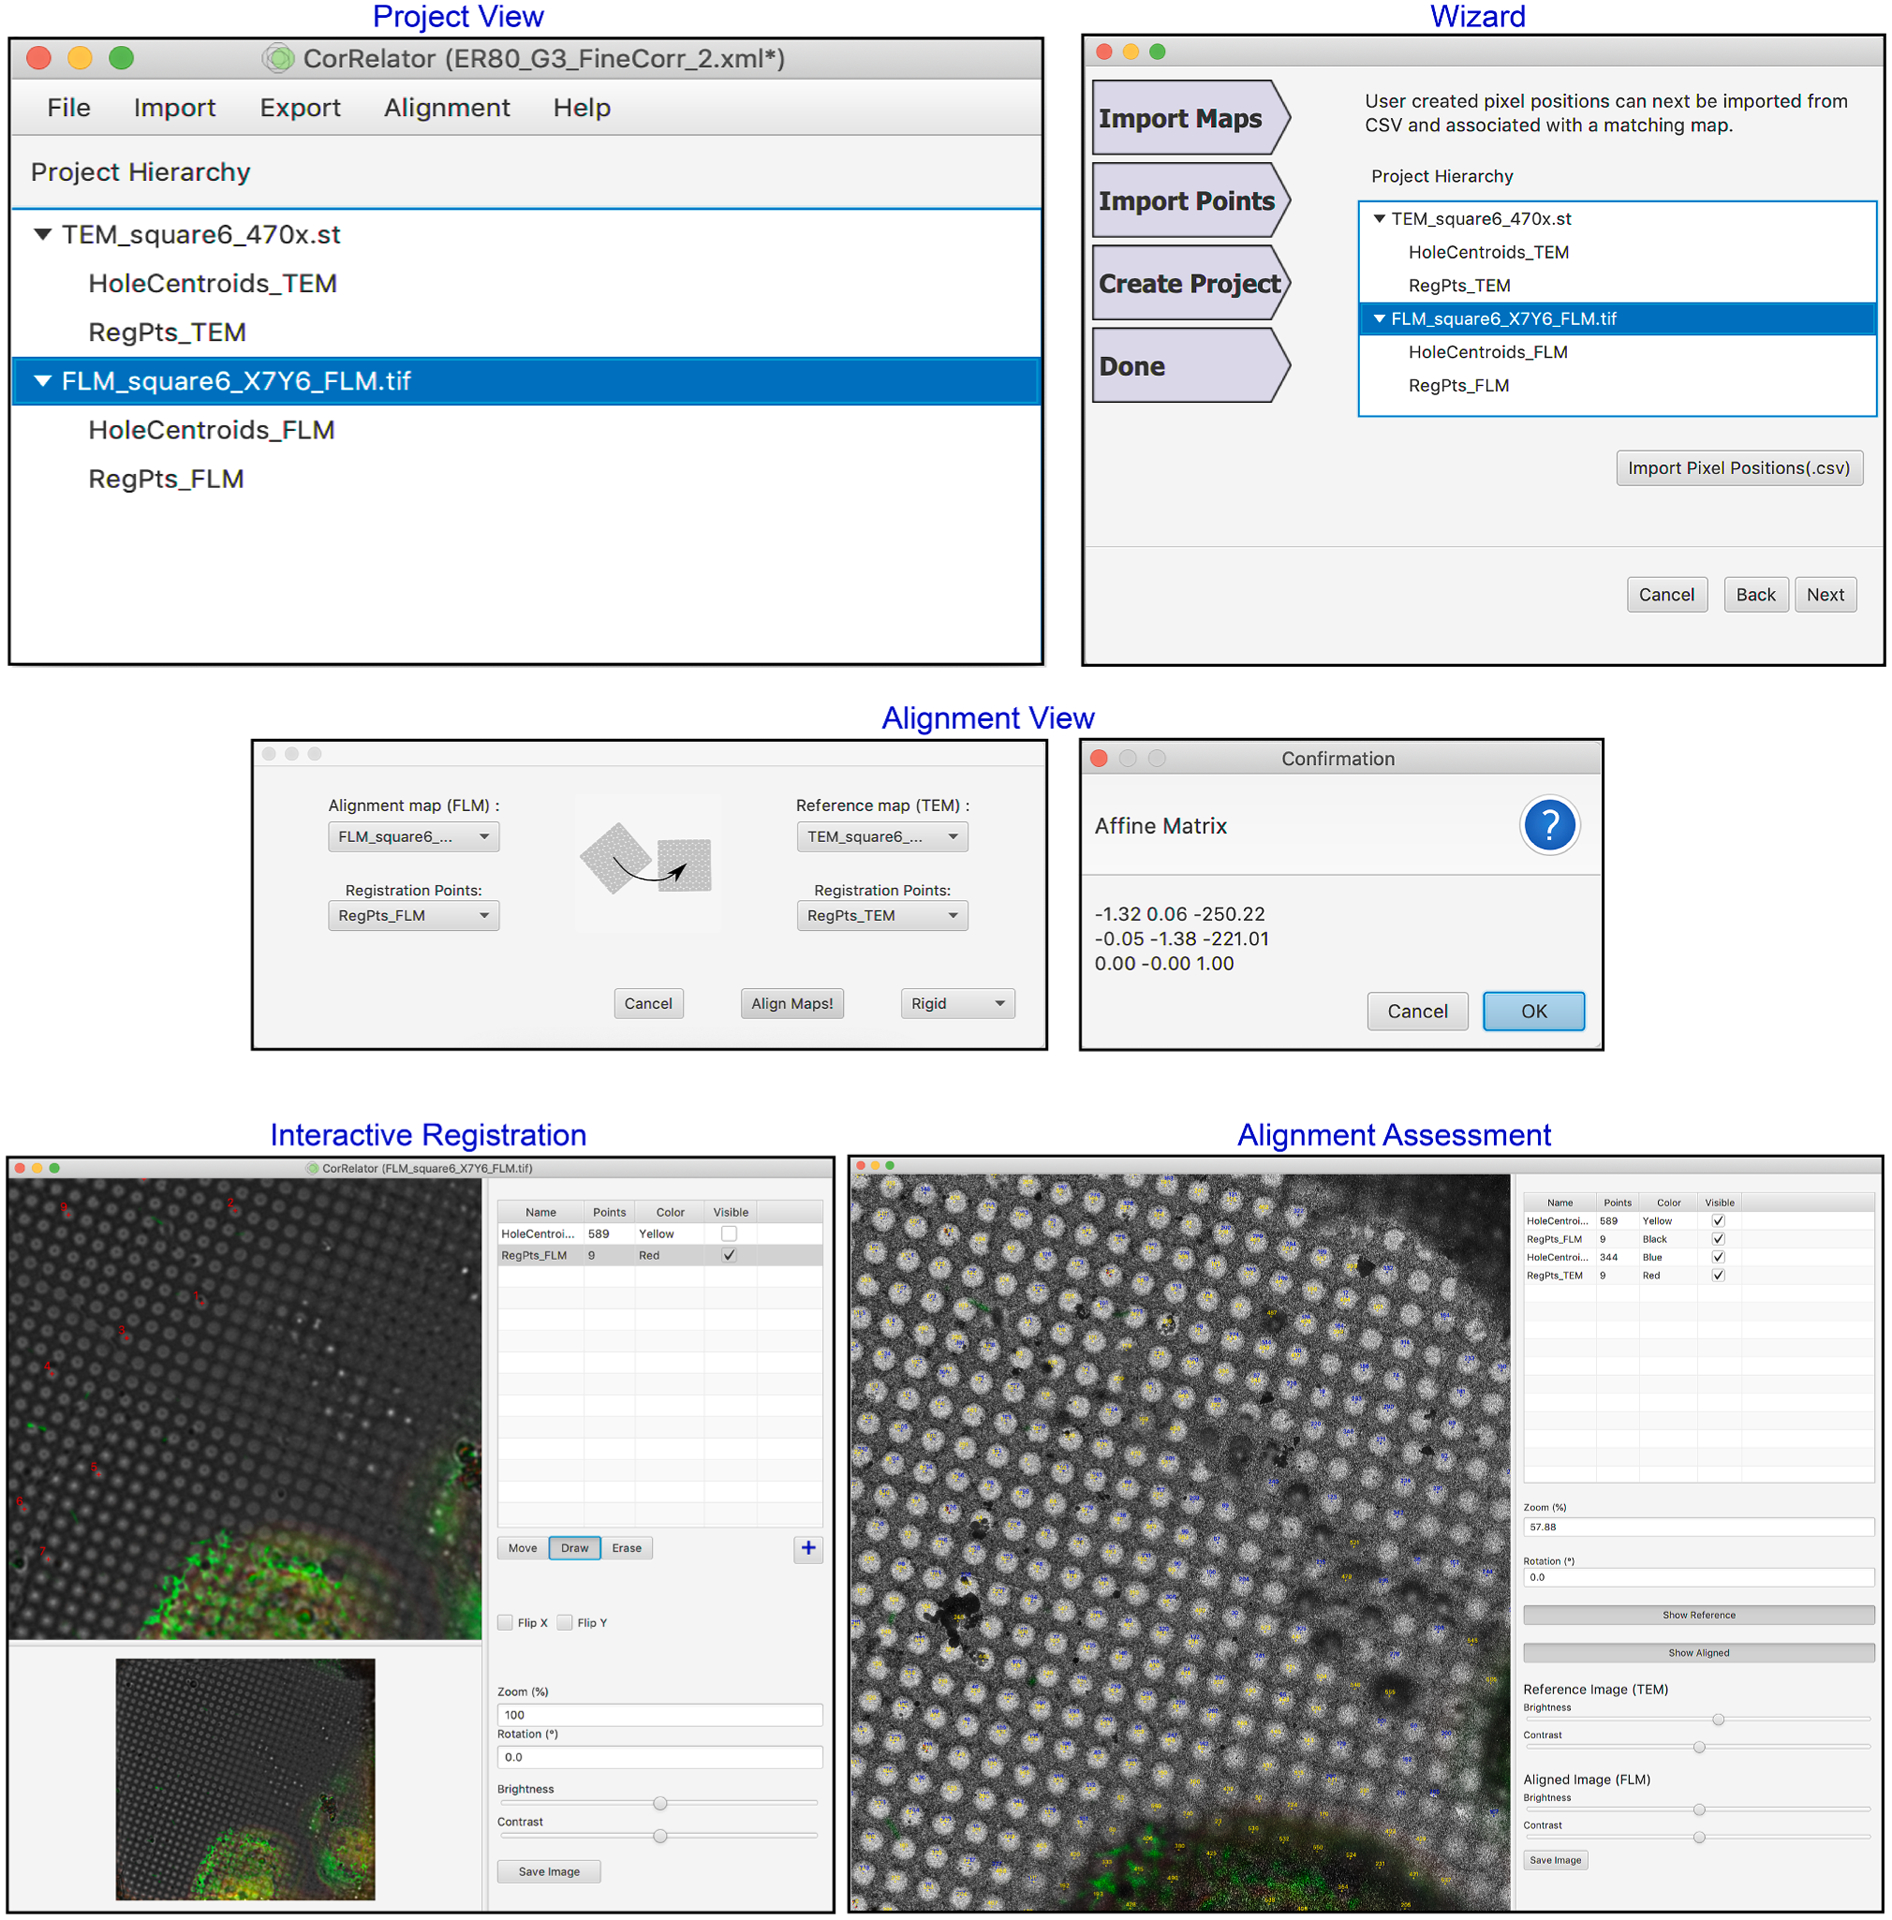
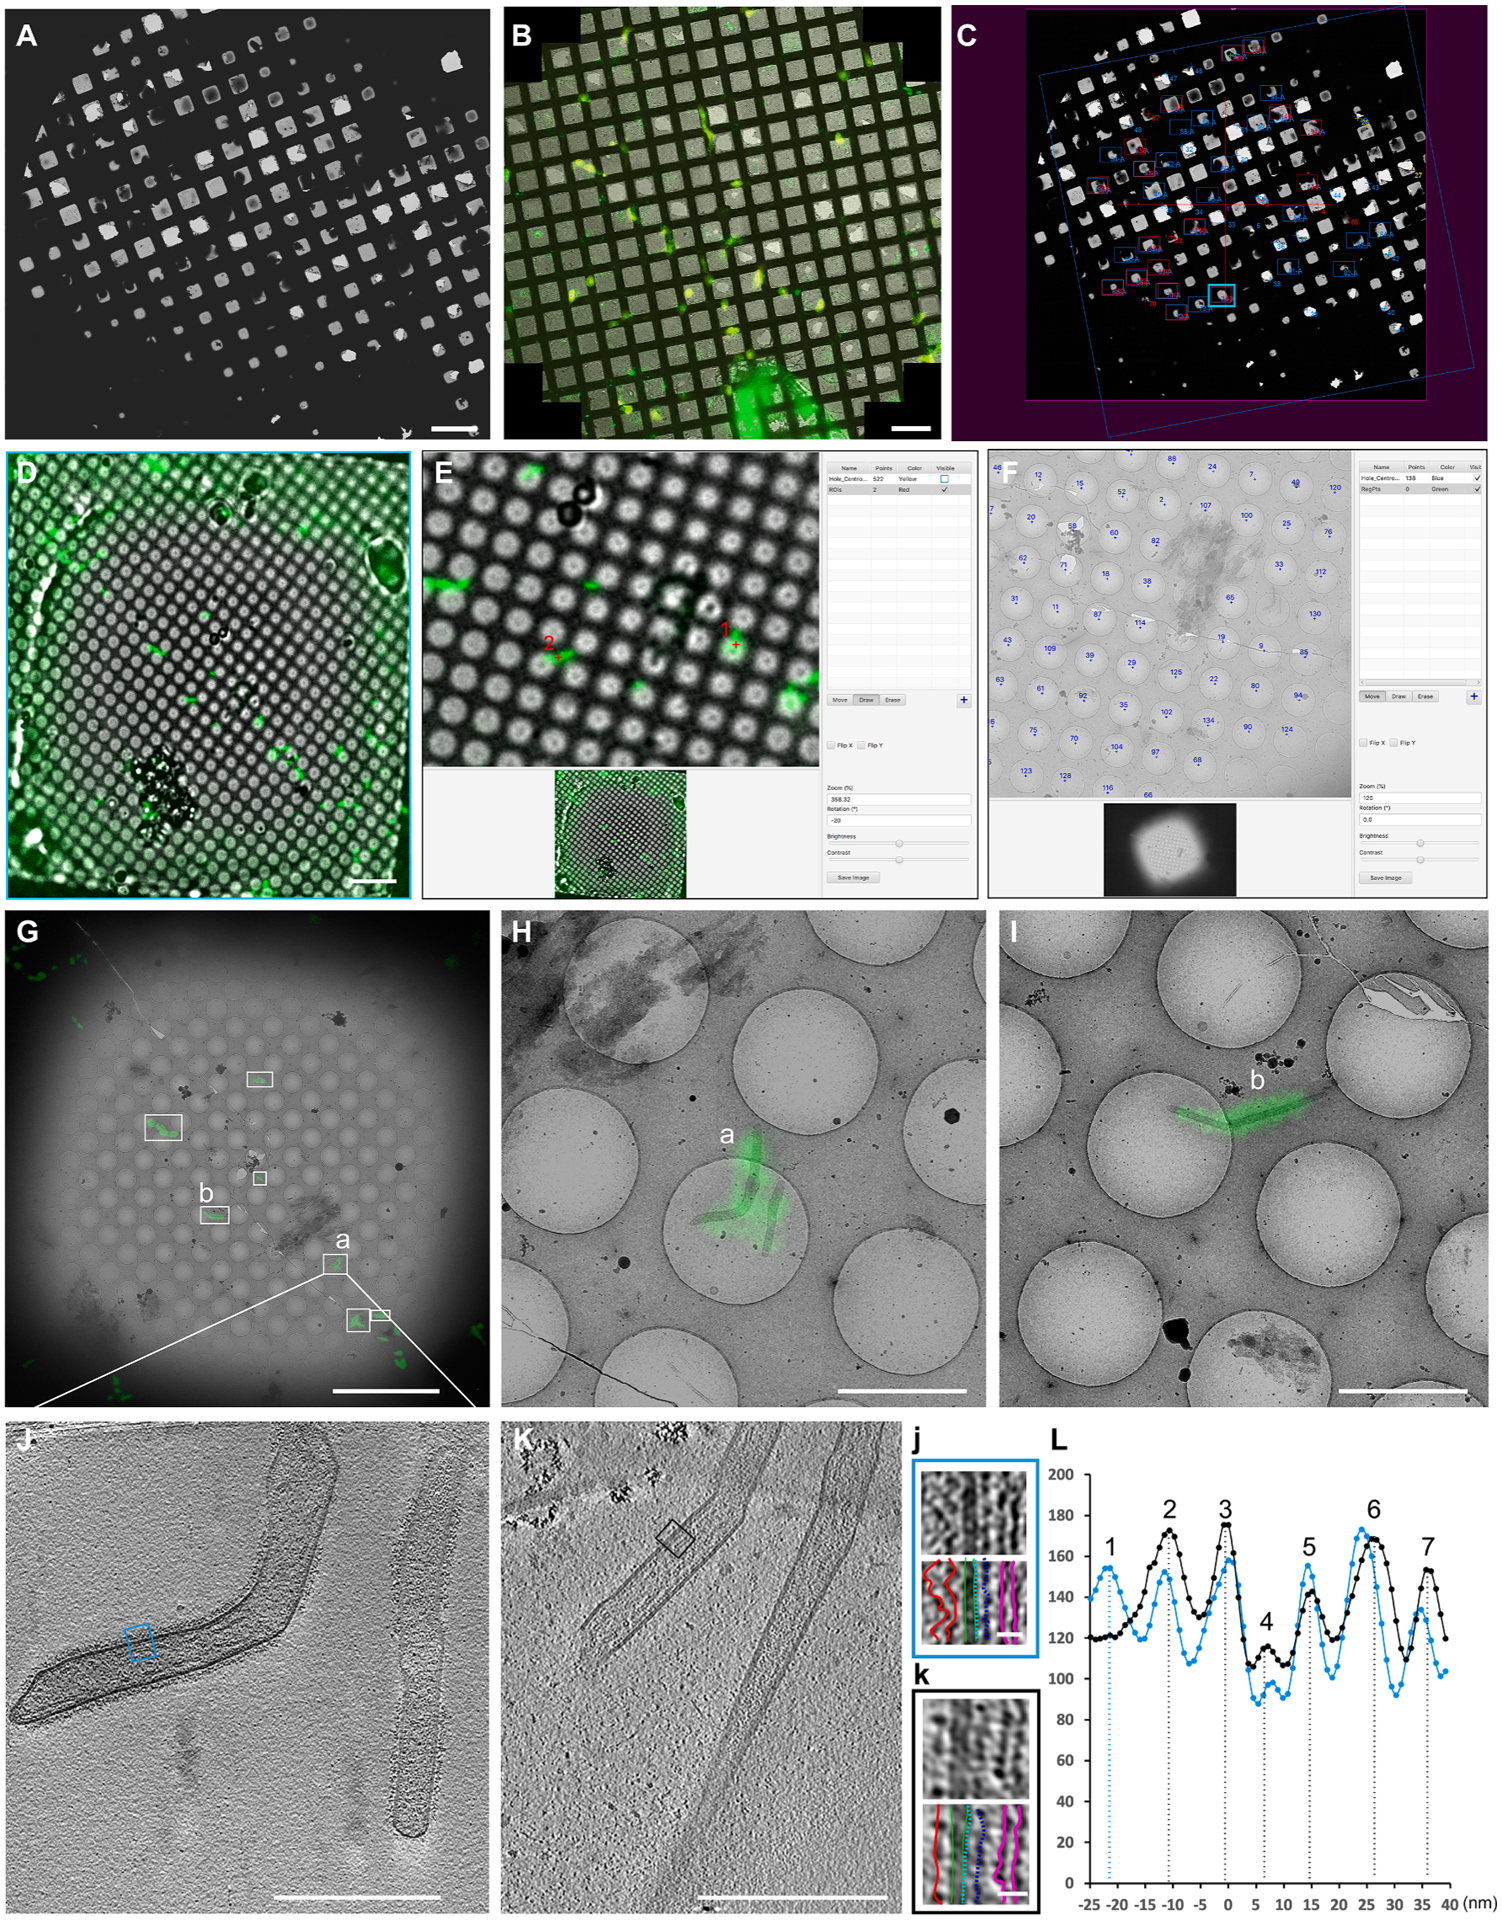
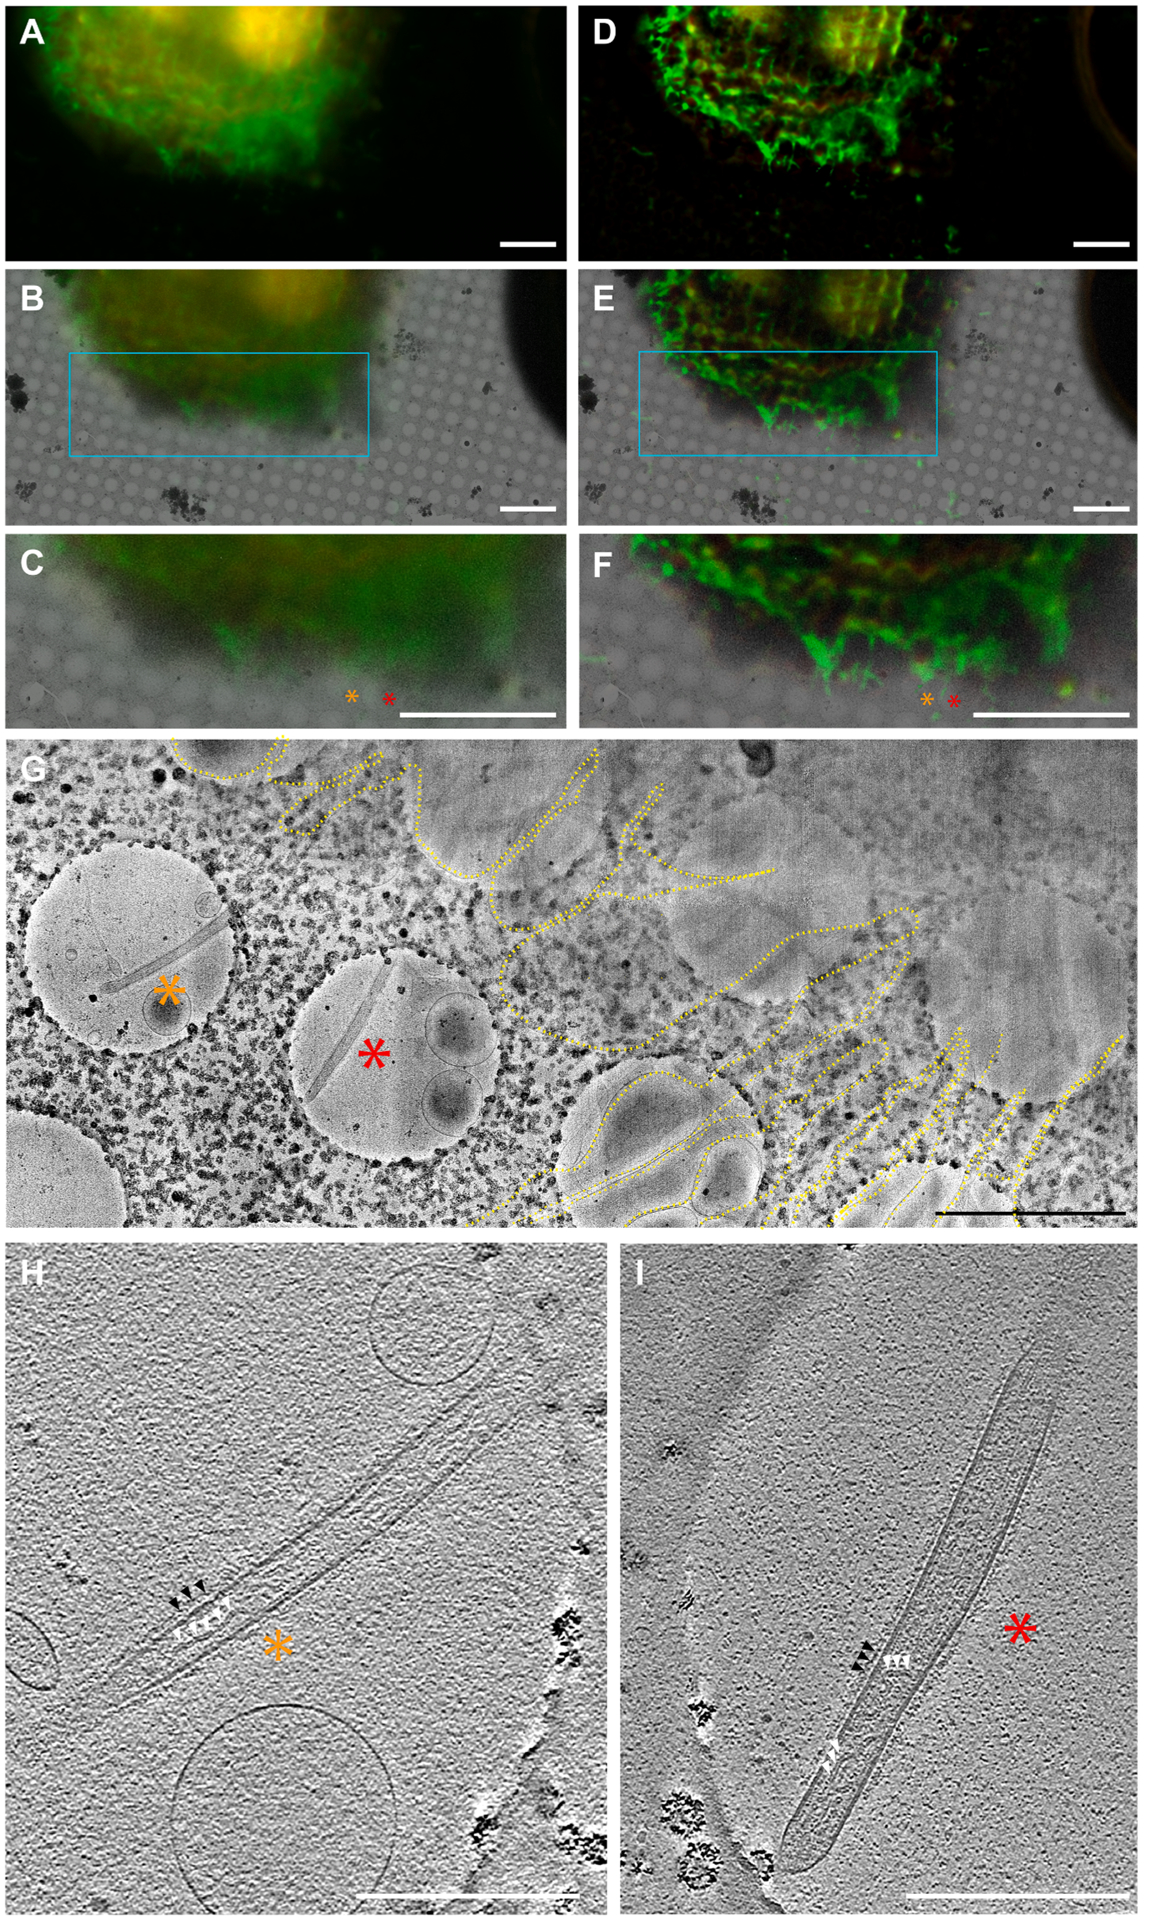
Cryo-correlative light and electron microscopy (CLEM) is a technique that uses the spatiotemporal cues from fluorescence light microscopy (FLM) to investigate the high-resolution ultrastructure of biological samples by cryo-electron microscopy (cryo-EM). Cryo-CLEM provides advantages for identifying and distinguishing fluorescently labeled proteins, macromolecular complexes, and organelles from the cellular environment. Challenges remain on how correlation workflows and software tools are implemented on different microscope platforms to support automated cryo-EM data acquisition. Here, we present CorRelator: an open-source desktop application that bridges between cryo-FLM and real-time cryo-EM/ET automated data collection. CorRelator implements a pixel-coordinate-to-stage-position transformation for flexible, high accuracy on-the-fly and post-acquisition correlation. CorRelator can be integrated into cryo-CLEM workflows and easily adapted to standard fluorescence and transmission electron microscope (TEM) system configurations. CorRelator was benchmarked under live-cell and cryogenic conditions using several FLM and TEM instruments, demonstrating that CorRelator reliably supports real-time, automated correlative cryo-EM/ET acquisition, through a combination of software-aided and interactive alignment. CorRelator is a cross-platform software package featuring an intuitive Graphical User Interface (GUI) that guides the user through the correlation process. CorRelator source code is available at: https://github.com/wright-cemrc-projects/corr.

Keywords: Algorithm; Alignment; Correlative light and electron microscopy; Cryo-electron microscopy; Cryo-electron tomography; Cryo-fluorescence microscopy.


Conflict of interest statement

Declaration of Competing Interest

The authors declare that they have no known competing financial interests or personal relationships that could have appeared to influence the work reported in this paper.

Figures

Fig. 1.
Fig. 1.
Overview of the cryo-CLEM workflow with CorRelator and SerialEM. (A) Integration of a feedback-based alignment loop in CorRelator with SerialEM. (B) Flowchart for the algorithm implemented in CorRelator that supports three applications for flexible correlations, labeled as ① or ② for on-the-fly cryo-CLEM operation, and ③ for post-acquisition correlation. ** is indicative of optional inputs (e.g., independent csv files, cryo-FLM/EM frames for post-acquisition correlation) and optional outputs (e.g., overlay of correlated cryo-FLM/EM images). The dashed grey box (A and B) highlights the main operations performed in CorRelator, the solid grey box (A) for the main operations in SerialEM, overlap areas for SerialEM navigator file 1(Nav_1) and file 2 (Nav_2) that link CorRelator and SerialEM. Purple arrows (A and B) indicate the iterative flow of user-in-the-loop alignment until an optimal accurate correlation is achieved.
Fig. 2.
Fig. 2.
Intuitive graphical user interfaces (GUI) of CorRelator. The main GUI features include a Project view, Wizard view, Alignment windows, iterative registration and aligned image views. To start, the user can choose to begin the alignment either in the main Project window or through step-by-step Wizard route accessible in the Project window. Once import of images, navigator file and or coordinate files is done, the user can choose alignment algorithms and transform FLM to TEM. At any time, the user can edit, add, or delete new coordinates for registration reference or ROIs in an interactive image viewing window. The alignment results are quickly accessible for precision assessment and a new round of registration can be initiated until a satisfying transformation is reached.
Fig. 3.
Fig. 3.
High accuracy cryo-CLEM with CorRelator. (A-C) Rough correlation: Cryo-EM grid map (A) was correlated with the Cryo-FLM mosaic (B) in CorRelator. (C) Screenshot of SerialEM after rough correlation. Squares of interest (blue and red boxes in C) were acquired TEM square maps. (D-G) Fine correlation: In CorRelator, representative cryo-FLM (D, cyan boxed in C) of a square was correlated with the TEM square map using hole centroids (visible in blue, F) for registration. (G) Superposition of the two correlated images. White boxed areas (a and b) indicate the transformed fluorescent ROIs corresponding to red numbers 1 and 2 in E, respectively. High magnification images and cryo-tilt series were recorded. (H-I) Higher magnification correlated overlays of a and b in (G). (J-K) A tomographic slice view (thickness of ~ 9 nm, J) of the position a in (G) and (H), and slice view of an un-labeled RSV particle (thickness of ~ 9 nm, K). (j) and (k) are a magnified view of the blue- and black-boxed areas in J and K. (L) The linear profiles of j (blue line) and k (black line) that highlight various RSV structural components. Scale bars: 200 μm in A, B, D, 10 μm in E, G, 2 μm in H, I, 500 nm in J, K, 20 nm in j and k.
Fig. 4.
Fig. 4.
Cryo-CLEM-CorRelator with THUNDER-processed cryo-FLM images. (A) Raw widefield cryo-FLM image of a RSV-infected cell displaying a fluorescent reporter gene in RSV-infected cells (red) and labeled RSV F glycoprotein (green). (B) Overlay of a cryo-EM image and the transformed fluorescence image. (C) Magnified view of the cyan boxed area marked in B. (D-F) the same images (A-C) processed with THUNDER Small Volume Computational Clearance (SVCC). The orange and red asterisks indicate RSV glycoprotein fluorescent signals marked as ROIs on pre- and post-SVCC. (G) Magnified cryo-EM montage view of the star ROIs in E and F of the immuno-labeled RSV particles (green). The RSV filaments extend from the cell plasma membrane and cell protrusions (dashed yellow line). (H-I) Central sections (thickness of ~ 9 nm) through the tomograms collected at the marked ROIs. White triangles indicate the RSV ribonucleoprotein (RNP) inside the RSV filament. The black arrows note the RSV glycoproteins bound to antibodies and 6-nm gold (peak 1 in Fig. 3I). Scale bars: 10 μm in A-F, 2 μm in G, 500 nm in H and I.
Fig. 5.
Fig. 5.
Accuracy performance of on-the-fly (Cryo)-CLEM with CorRelator. (A-G) Cryo-CLEM-CorRelator application on vitrified HeLa cells infected by RSV viral particles. (A) Bright-field and fluorescent channel merged FLM map used to provide a representative ROI (pink cross in the white box). The labeled RSV filaments appear green. (B) SerialEM screenshot of the post-correlated FLM map of (A) after reloading the Nav_2. (C) Higher magnification cryo-EM image of the ROI after moving the TEM stage to the identified ROI (pink cross in A and B). (D-F) For three other areas, the center coordinate (yellow cross in D-F) of each TEM frame corresponds to the predicted stage position by CorRelator (pink across) after moving the stage. (G-M) RT-CLEM-CorRelator application on Tetraspeck beads. (G) Superposition of the correlated TEM and FLM map. (H-M) Acquired high-magnification images at the pink ROIs in (G) after moving the stage to the predicted positions (yellow cross). The pink circle was centered on the actual ROIs using the 2D Gaussian fit. (L) Distribution plot of the coordinate deviation by CorRelator between the actual ROIs (pink) and predicated positions (yellow) under cryogenic (n = 50) and ambient conditions (n = 19). Scale bars: 10 μm in A and a, 2 μm in C-D, 500 nm in E-G, 10 μm in H, 500 nm in I-N.
Fig. 6.
Fig. 6.
Comparison of registration point selections on the alignment accuracy of different algorithms. (A) Five registration points and nine target points (leave-oneout method) picked on a 2D cryo-FLM image of vitrified cells and used for comparison of predicted errors shown (B). Adequately dispersed reference points are red (n = 5); locally clustered reference points are cyan (n = 5); target points are magenta (n = 9). (B) Comparison of predicted errors of the picked targets (magenta, A) in X and Y by several software tools. From left to right: X/Y and X**/Y** (black boxed) are errors predicted by CorRelator using dispersed (white) and locally clustered (blue, **) registration points, Xaff /Yaff and Xaff**/ Yaff** by MATLAB affine transformation, Xpro/Ypro and Xproc**/Yproc** by MATLAB projective transformation, XicyR/YicyR and XicyR**/YicyR** by eC-CLEM (ICY package) transformation, X3DCT/Y3DCT and X3DCT**/Y3DCT** by 3DCT (3D Correlation Toolbox). (C) Adequately dispersed reference points (red, numbered) and targets (magenta) picked to monitor the predicted error as the reference points increase. (D) Predicted errors on monitored three magenta targets (represented by circles, hollow circles, and triangles, repectively) in (C). The X axis is number of points used for the reference, labeled in (C). Scale bars = 10 μm.
Fig. 7.
Fig. 7.
CorRelator adaptability for cryo-CLEM imaging of RSV. (A) A schematic diagram to apply both (a) ambient oil immersion objective lens at magnification of 63 × (live-cell-FLM) prior to plunge-freezing, and (b) cryogenic objective lens at magnification of 50 × and cryo-stage (cryo-FLM) to study vitrified RSV-infected cells on a gold TEM grid. (B) Cryo-EM grid map. (C) Live-cell-FLM mosaic (workflow a in A) of the same whole grid, fluorescent signals from RSV-infected cells (red), the RSV F glycoprotein on RSV-infected cells or released particles (green), and cellular DNA Hoechst stain (blue). (D) SerialEM screenshot of cryo-TEM map of (B) after being correlated with live-cell-FLM map of (C) in CorRelator. The maps for ROI squares were identified and collected (blue box). (E-G) live-cell-FLM square image (workflow a), SVCC-processed cryo-FLM image (workflow b), and cryo-EM map of 470 × of the region (G) corresponding to the green boxed and zoomed-in square in D. (H-I) Superimpositions of the correlated live-cell-FLM image (E, H) and processed cryo-FLM image (F, I) with EM map in G, respectively. The same ROIs of RSV particles were present and identified in both FLM modalities, highlighted in matching colored boxes. (J) Central section (thickness of ~ 9 nm) through the tomogram of RSV collected at the red boxed region. Scale bars: 100 μm in B-C, 10 μm in E-I, 200 nm in J.

Similar articles

Cited by

References

    1. Afzelius BA, Maunsbach AB, 2004. Biological ultrastructure research; the first 50 years. Tissue and Cell 36 (2), 83–94. 10.1016/j.tice:2003.11.001. - DOI - PubMed
    1. Agronskaia AV, Valentijn JA, van Driel LF, Schneijdenberg CTWM, Humbel BM, van Bergen en Henegouwen PMP, Verkleij AJ, Koster AJ, Gerritsen HC, 2008. Integrated fluorescence and transmission electron microscopy. Journal of Structural Biology 164 (2), 183–189. 10.1016/j.jsb:2008.07.003. - DOI - PubMed
    1. Al-Amoudi A, Chang J-J, Leforestier A, McDowall A, Salamin LM, Norlén LPO, Richter K, Blanc NS, Studer D, Dubochet J, 2004. Cryo-electron microscopy of vitreous sections. EMBO J 23 (18), 3583–3588. 10.1038/sj.emboj.7600366. - DOI - PMC - PubMed
    1. Anderson KL, Page C, Swift MF, Hanein D, Volkmann N, 2018. Marker-free method for accurate alignment between correlated light, cryo-light, and electron cryo-microscopy data using sample support features. Journal of Structural Biology 201 (1), 46–51. 10.1016/j.jsb:2017.11.001. - DOI - PMC - PubMed
    1. Arnold J, Mahamid J, Lucic V, de Marco A, Fernandez J-J, Laugks T, Mayer T, Hyman AA, Baumeister W, Plitzko Jürgen.M., 2016. Site-Specific Cryo-focused Ion Beam Sample Preparation Guided by 3D Correlative Microscopy. Biophys. J 110 (4), 860–869. 10.1016/j.bpj.2015.10.053. - DOI - PMC - PubMed

Publication types

LinkOut - more resources