. 2021 Aug;15(8):2233-2247.
doi: 10.1038/s41396-021-00919-9. Epub 2021 Feb 21.

Synergistic epistasis enhances the co-operativity of mutualistic interspecies interactions

Affiliations

Synergistic epistasis enhances the co-operativity of mutualistic interspecies interactions

Serdar Turkarslan et al. ISME J. 2021 Aug.

Abstract

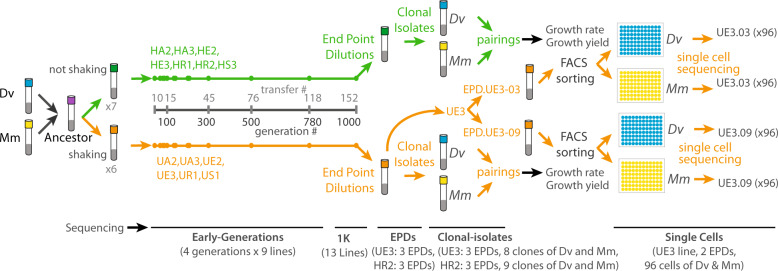
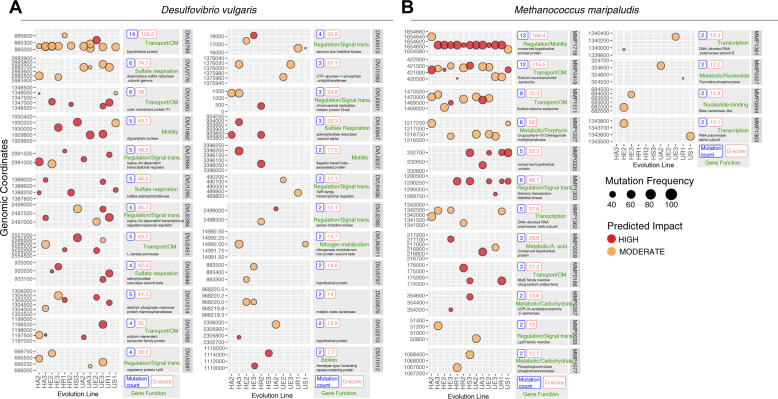
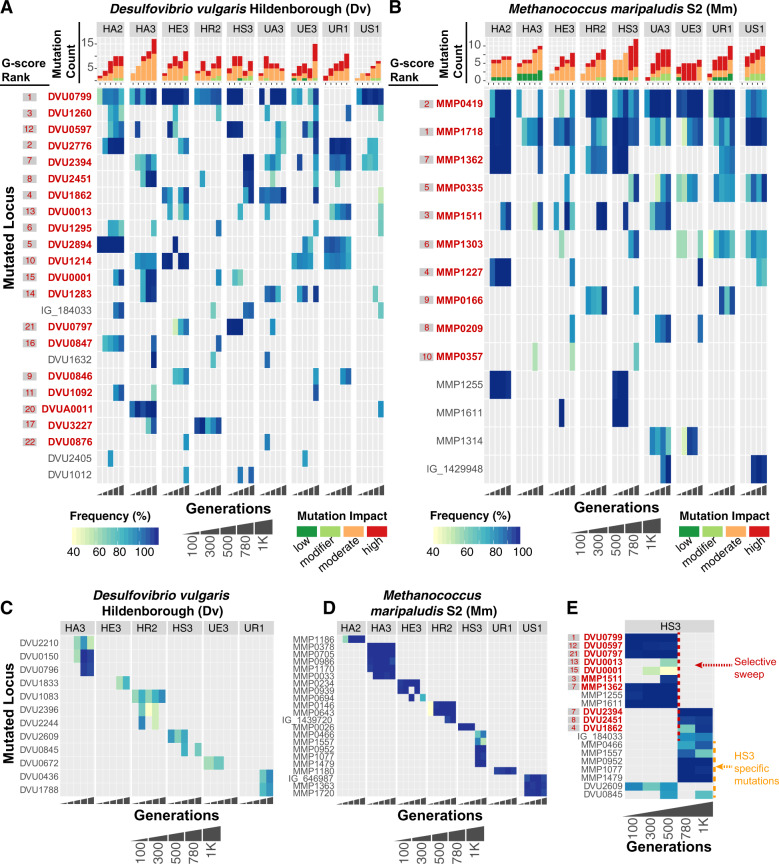
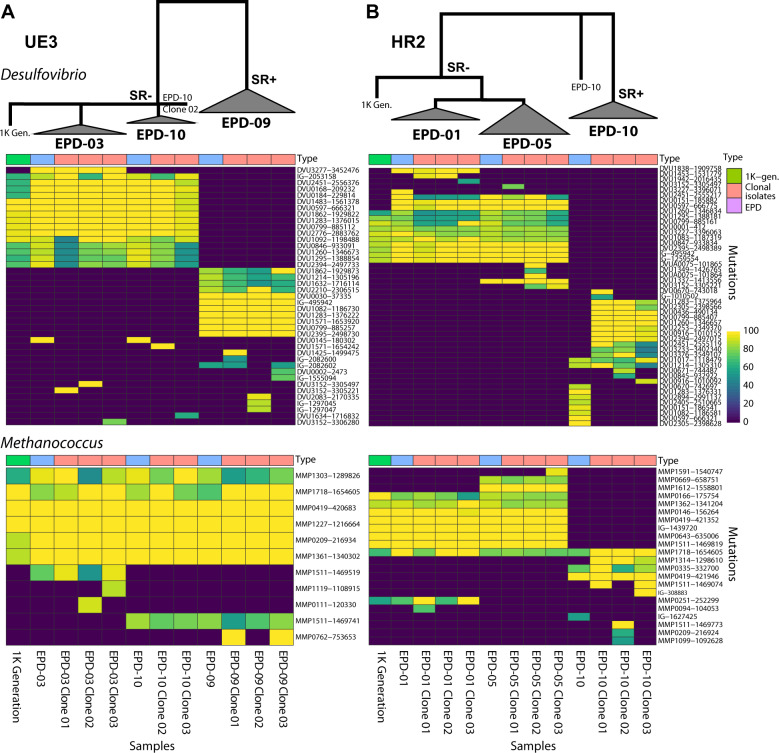
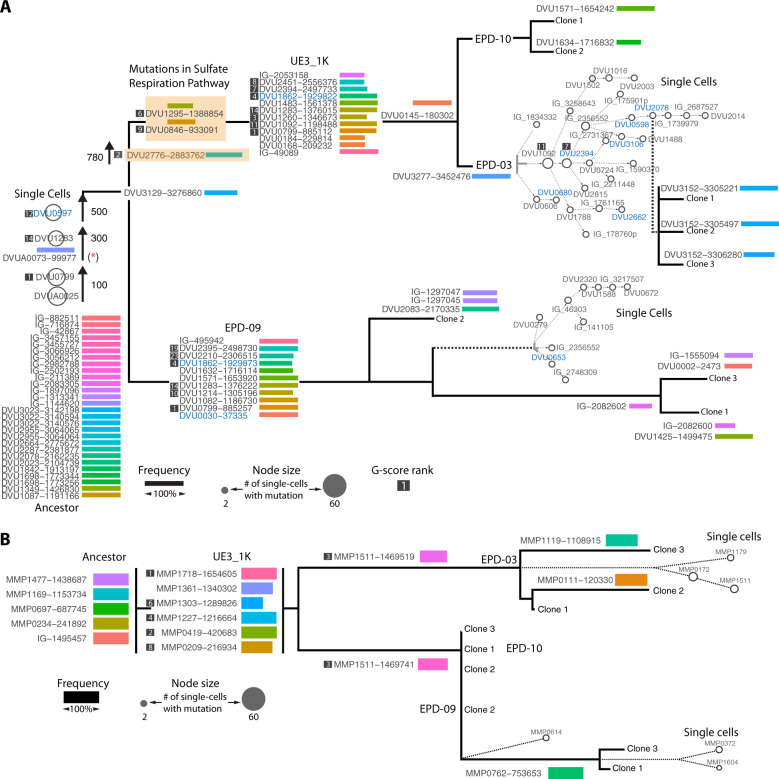
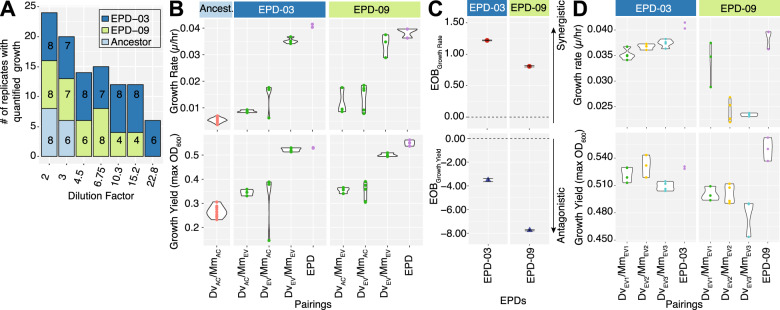
Early evolution of mutualism is characterized by big and predictable adaptive changes, including the specialization of interacting partners, such as through deleterious mutations in genes not required for metabolic cross-feeding. We sought to investigate whether these early mutations improve cooperativity by manifesting in synergistic epistasis between genomes of the mutually interacting species. Specifically, we have characterized evolutionary trajectories of syntrophic interactions of Desulfovibrio vulgaris (Dv) with Methanococcus maripaludis (Mm) by longitudinally monitoring mutations accumulated over 1000 generations of nine independently evolved communities with analysis of the genotypic structure of one community down to the single-cell level. We discovered extensive parallelism across communities despite considerable variance in their evolutionary trajectories and the perseverance within many evolution lines of a rare lineage of Dv that retained sulfate-respiration (SR+) capability, which is not required for metabolic cross-feeding. An in-depth investigation revealed that synergistic epistasis across pairings of Dv and Mm genotypes had enhanced cooperativity within SR- and SR+ assemblages, enabling their coexistence within the same community. Thus, our findings demonstrate that cooperativity of a mutualism can improve through synergistic epistasis between genomes of the interacting species, enabling the coexistence of mutualistic assemblages of generalists and their specialized variants.


Conflict of interest statement

The authors declare no competing interests.

Figures

Fig. 1
Fig. 1. Overview of directed laboratory evolution to probe evolutionary signatures for syntrophic cocultures of Dv and Mm.
Thirteen independent cocultures were subjected to laboratory evolution with and without shaking as described before [5]. DNA samples were collected across generations, end-point-dilutions (EPDs), clonal isolates, and single cells to identify genomic alterations. In addition, clonal isolates were paired in varied combinations in order to determine growth rate and yield for cocultures. Number of samples sequenced are indicated at the bottom.
Fig. 2
Fig. 2. Frequency and location of high G-score mutations in Dv (A) and Mm (B) across 13 independent evolution lines.
SnpEff predicted impact of mutations* are indicated as moderate (orange circles) or high (red circles) with the frequency of mutations indicated by node size. Expected number of mutations for each gene was calculated based on the gene length and the total number of mutations in a given evolution line. Genes with parallel changes were ranked by calculating a G (goodness of fit) score between observed and expected values and indicated inside each panel. Mutations for each gene are plotted along their genomic coordinates (vertical axes) across 13 evolution lines (horizontal axes). Total number of mutations for a given gene is shown as horizontal bar plots. [*HIGH impact mutations: gain or loss of start and stop codons and frameshift mutations; MODERATE impact mutations: codon deletion, nonsynonymous in coding sequence, change or insertion of codon; low impact mutations: synonymous coding and nonsynonymous start codon].
Fig. 3
Fig. 3. Frequency and time of appearance of mutations through 1 K generations of laboratory evolution lines of Dv and Mm cocultures.
The heat maps display frequency of mutations in genes (rows) in Dv (A) and Mm (B) in each evolution line, ordered from early to later generations (horizontal axis). High G-score genes are shown in red font and their G-score rank is shown to the left in gray shaded box, also in red font. Bar plots above heat maps indicate total number of mutations in each generation and the color indicates impact of mutation. Use “Frequency”, “Generations”, and “Mutation impact” key below the heat maps for interpretation. Mutations that were unique to each evolution line is shown in (C, D) for Dv and Mm, respectively. E The heatmap illustrates a selective sweep across both organisms in line HS3.
Fig. 4
Fig. 4. Genotype mapping of 1 K generation, EPDs and clonal isolates for two evolution lines.
Heatmap displays frequency for each mutation (rows) in UE3 (A) and HR2 (B) across 1 K generation, EPDs, and clonal isolates (columns). The upper panel shows genotype map of Dv and the lower panel for Mm. The hierarchical tree indicates a simplified lineage map of mutations in Dv within each evolution line, with SR phenotypes indicated.
Fig. 5
Fig. 5. Lineage map of mutational events deciphered through sequencing of up to 96 single cells of (A) Dv and (B) Mm from EPD-03 and EPD-09, cross-referenced with longitudinal bulk sequencing of UE3, EPDs and sequencing of clonal isolates.
Temporal ordering of mutations in the trunk is based on their order of appearance in longitudinal sequencing data across generations. Unique mutations within each lineage are shown together with frequency (length of bars). The single-cell lineage tree for each EPD was constructed using the algorithm SCITE and shown in the context of the parent EPD and linked to clonal isolates. (See Supplementary Figs. 2 and 3 for details). Mutation names for regulatory or signal transduction genes are colored in blue and SR-related genes are indicated with an orange shaded box. An asterisk indicates mutation in a plasmid gene that was not detected in single cells potentially due to loss of plasmid. Of the total 11 high G-score Dv genes in the 1 K generation of UE3, just three were observed in both EPDs. Note, the three high G-score genes DVU1862, DVU2394, and DVU0799 had mutations in different locations in the two EPDs. High G-score genes that were only observed in EPD-03 were DVU2451, DVU1260, and DVU1092, and those unique to EPD-09 were DVU2395, DVU2210, and DVU1214. In addition, SR− mutations in DVU0846 and DVU1295 were unique to EPD-03, appearing after 780 generations, and were present across single cells and all clonal isolates.
Fig. 6
Fig. 6. Growth rate, yield and cooperativity of EPDs, and clonal isolate pairings.
A A stacked barplot showing the number of replicates exhibiting growth for each EPD and the ancestral cocultures across a dilution series. B Growth rate and carrying capacity of pairings of ancestral and evolved clonal isolates of Dv and Mm from EPD-03 and EPD-09. C Excess-Over-Bliss analysis for estimating synergistic and antagonistic interactions of Dv/Mm clonal isolate pairings. D Growth rate and yield for three evolved Dv/Mm pairings from each EPD.

References

    1. Thauer RK. Anaerobic oxidation of methane with sulfate: on the reversibility of the reactions that are catalyzed by enzymes also involved in methanogenesis from CO2. Curr Opin Microbiol. 2011;14:292–9. doi: 10.1016/j.mib.2011.03.003. - DOI - PubMed
    1. Oude Elferink SJWH, Visser A, Hulshoff Pol LW, Stams AJM. Sulfate reduction in methanogenic bioreactors. FEMS Microbiol Rev. 1994;15:119–36. doi: 10.1111/j.1574-6976.1994.tb00130.x. - DOI
    1. Turkarslan S, Raman AV, Thompson AW, Arens CE, Gillespie MA, von Netzer F, et al. Mechanism for microbial population collapse in a fluctuating resource environment. Mol Syst Biol. 2017;13:919. doi: 10.15252/msb.20167058. - DOI - PMC - PubMed
    1. Hillesland KL, Stahl DA. Rapid evolution of stability and productivity at the origin of a microbial mutualism. Proc Natl Acad Sci USA. 2010;107:2124–9. doi: 10.1073/pnas.0908456107. - DOI - PMC - PubMed
    1. Hillesland KL, Lim S, Flowers JJ, Turkarslan S, Pinel N, Zane GM, et al. Erosion of functional independence early in the evolution of a microbial mutualism. Proc Natl Acad Sci USA. 2014;111:14822–7. doi: 10.1073/pnas.1407986111. - DOI - PMC - PubMed

Publication types