

Mortality containment vs. Economics Opening: Optimal policies in a SEIARD model
- PMID: 33612918
- PMCID: PMC7882223
- DOI: 10.1016/j.jmateco.2021.102490
Mortality containment vs. Economics Opening: Optimal policies in a SEIARD model
Abstract
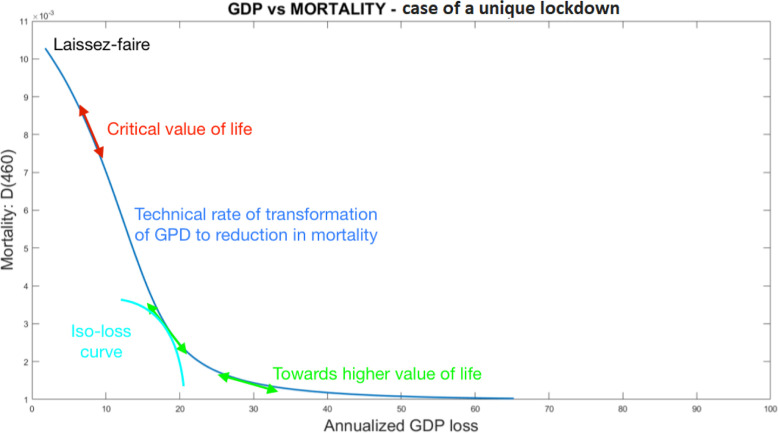
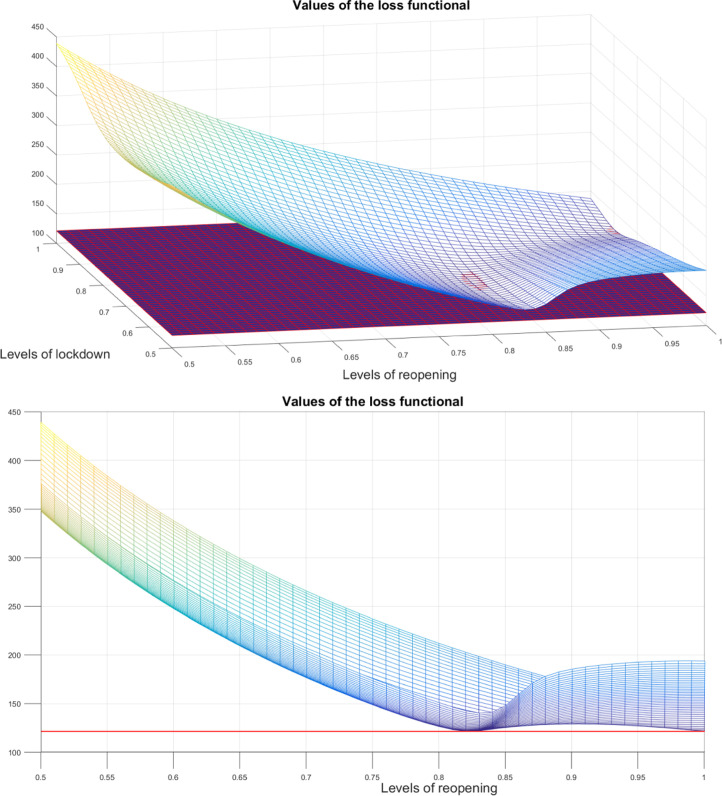
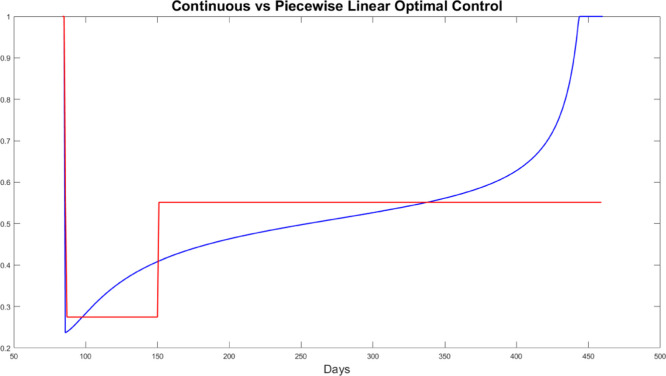
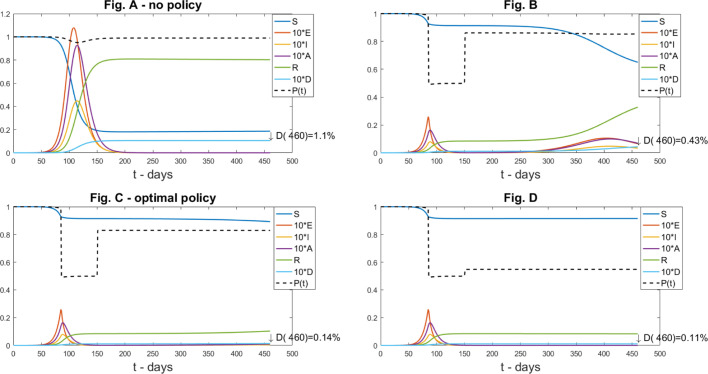
We extend the classic approach (SIR) to a SEAIRD model with policy controls. A social planner's objective reflects the trade-off between mortality reduction and GDP, featuring its perception of the value of statistical life (PVSL). We introduce realistic and drastic limitations to the control available to it. Within this setup, we explore the results of various control policies. We notably describe the joint dynamics of infection and economy in different contexts with unique or multiple confinement episodes. Compared to other approaches, our contributions are: (i) to restrict the class of functions accessible to the social planner, and in particular to impose that they remain constant over some fixed periods; (ii) to impose implementation frictions, e.g. a lag in their implementation; (iii) to prove the existence of optimal strategies within this set of possible controls; iv) to exhibit a sudden change in optimal policy as the statistical value of life is raised, from laissez-faire to a sizeable lockdown level, indicating a possible reason for conflicting policy proposals.
Keywords: Optimal control; Public policy evaluation; SIR; Statistical value of life.
© 2021 Elsevier B.V. All rights reserved.
Conflict of interest statement
The authors declare that they have no known competing financial interests or personal relationships that could have appeared to influence the work reported in this paper.
Figures


Similar articles
-
How to design virus containment policies? A joint analysis of economic and epidemic dynamics under the COVID-19 pandemic.J Econ Interact Coord. 2023;18(2):311-370. doi: 10.1007/s11403-022-00369-2. Epub 2022 Oct 28. J Econ Interact Coord. 2023. PMID: 36320631 Free PMC article.
-
Optimal interventions in networks during a pandemic.J Popul Econ. 2023;36(2):847-883. doi: 10.1007/s00148-022-00916-y. Epub 2022 Aug 13. J Popul Econ. 2023. PMID: 35990556 Free PMC article.
-
Pandemic economics: optimal dynamic confinement under uncertainty and learning.Geneva Risk Insur Rev. 2020;45(2):80-93. doi: 10.1057/s10713-020-00052-1. Epub 2020 Aug 17. Geneva Risk Insur Rev. 2020. PMID: 32837397 Free PMC article.
-
Taming the spread of an epidemic by lockdown policies.J Math Econ. 2021 Mar;93:102453. doi: 10.1016/j.jmateco.2020.102453. Epub 2020 Dec 8. J Math Econ. 2021. PMID: 33324027 Free PMC article.
-
Rawlsian optimal population size.J Popul Econ. 1993;6(4):363-73. doi: 10.1007/BF00599044. J Popul Econ. 1993. PMID: 12286866
Cited by
-
Sensitivity theorems of a model of multiple imperfect vaccines for COVID-19.Chaos Solitons Fractals. 2022 Mar;156:111844. doi: 10.1016/j.chaos.2022.111844. Epub 2022 Jan 31. Chaos Solitons Fractals. 2022. PMID: 35125676 Free PMC article.
-
Modeling social, economic, and health perspectives for optimal pandemic policy decision-making.Socioecon Plann Sci. 2023 Apr;86:101472. doi: 10.1016/j.seps.2022.101472. Epub 2022 Nov 19. Socioecon Plann Sci. 2023. PMID: 36438929 Free PMC article.
-
Should the COVID-19 lockdown be relaxed or intensified in case a vaccine becomes available?PLoS One. 2022 Sep 2;17(9):e0273557. doi: 10.1371/journal.pone.0273557. eCollection 2022. PLoS One. 2022. PMID: 36054113 Free PMC article.
-
Optimal federal transfers during uncoordinated response to a pandemic.J Public Econ Theory. 2021 Nov 1:10.1111/jpet.12555. doi: 10.1111/jpet.12555. Online ahead of print. J Public Econ Theory. 2021. PMID: 34908827 Free PMC article.
-
Modelling optimal lockdowns with waning immunity.Econ Theory. 2022 Nov 29:1-38. doi: 10.1007/s00199-022-01468-8. Online ahead of print. Econ Theory. 2022. PMID: 36465159 Free PMC article.
References
-
- Acemoglu D., Chernozhukov V., Werning I., Whinston M.D. National Bureau of Economic Research, working paper 27102; 2020. A Multi-Risk SIR Model with Optimally Targeted Lockdown: Technical Report.
-
- Alvarez F.E., Argente D., Lippi F. 2020. A Simple Planning Problem for Covid-19 Lockdown: Covid Economics Vetted and Real-Time Papers,CEPR ISSUE 14 6 MAY 2020.
-
- Baumstark L., Dervaux B., Treich N. Rapports et Documents, Commissariat Général à la Stratégie et à la Prospective (for the Rapport Quinet); 2013. Eléments Pour Une Révision De La Valeur De La Vie Humaine.
LinkOut - more resources
Full Text Sources
Other Literature Sources