

A rapid screening classifier for diagnosing COVID-19
- PMID: 33613111
- PMCID: PMC7893593
- DOI: 10.7150/ijbs.53982
A rapid screening classifier for diagnosing COVID-19
Abstract
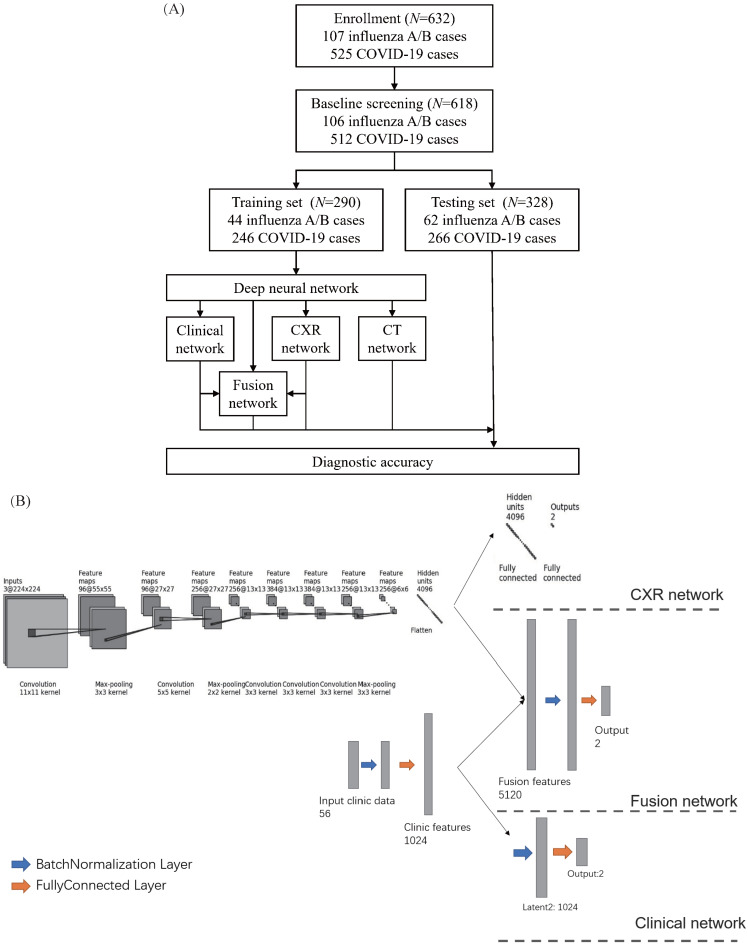
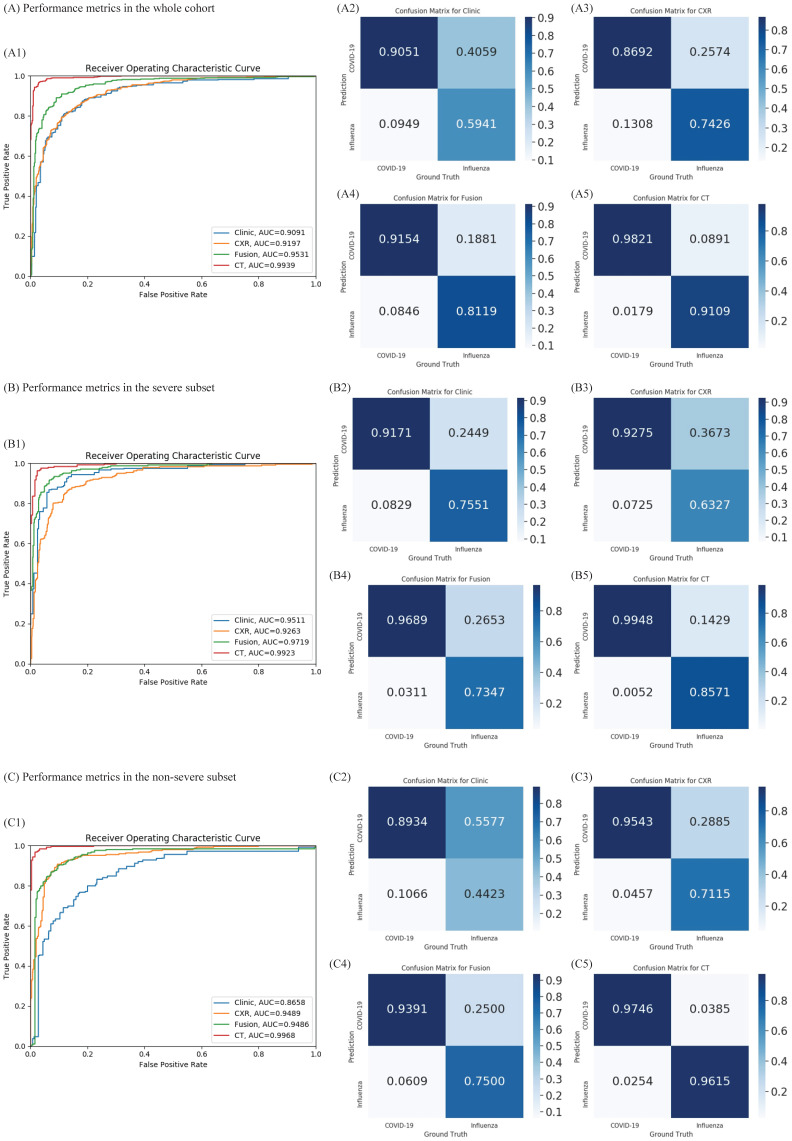
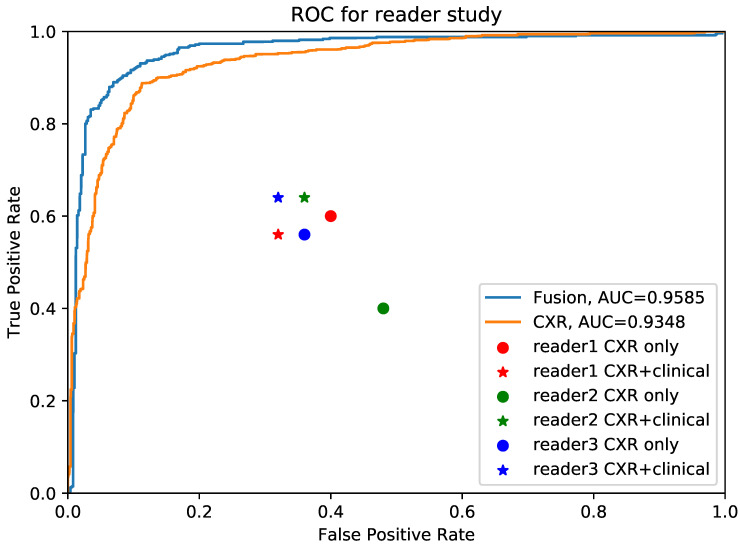
Rationale: Coronavirus disease 2019 (COVID-19) has caused a global pandemic. A classifier combining chest X-ray (CXR) with clinical features may serve as a rapid screening approach. Methods: The study included 512 patients with COVID-19 and 106 with influenza A/B pneumonia. A deep neural network (DNN) was applied, and deep features derived from CXR and clinical findings formed fused features for diagnosis prediction. Results: The clinical features of COVID-19 and influenza showed different patterns. Patients with COVID-19 experienced less fever, more diarrhea, and more salient hypercoagulability. Classifiers constructed using the clinical features or CXR had an area under the receiver operating curve (AUC) of 0.909 and 0.919, respectively. The diagnostic efficacy of the classifier combining the clinical features and CXR was dramatically improved and the AUC was 0.952 with 91.5% sensitivity and 81.2% specificity. Moreover, combined classifier was functional in both severe and non-serve COVID-19, with an AUC of 0.971 with 96.9% sensitivity in non-severe cases, which was on par with the computed tomography (CT)-based classifier, but had relatively inferior efficacy in severe cases compared to CT. In extension, we performed a reader study involving three experienced pulmonary physicians, artificial intelligence (AI) system demonstrated superiority in turn-around time and diagnostic accuracy compared with experienced pulmonary physicians. Conclusions: The classifier constructed using clinical and CXR features is efficient, economical, and radiation safe for distinguishing COVID-19 from influenza A/B pneumonia, serving as an ideal rapid screening tool during the COVID-19 pandemic.
Keywords: COVID-19; chest X-ray; clinical feature; deep learning.
© The author(s).
Conflict of interest statement
Competing Interests: The authors have declared that no competing interest exists.
Figures
Similar articles
-
CT radiomics facilitates more accurate diagnosis of COVID-19 pneumonia: compared with CO-RADS.J Transl Med. 2021 Jan 7;19(1):29. doi: 10.1186/s12967-020-02692-3. J Transl Med. 2021. PMID: 33413480 Free PMC article.
-
Comparison of Chest CT Findings of COVID-19, Influenza, and Organizing Pneumonia: A Multireader Study.AJR Am J Roentgenol. 2021 Nov;217(5):1093-1102. doi: 10.2214/AJR.21.25640. Epub 2021 Apr 14. AJR Am J Roentgenol. 2021. PMID: 33852360
-
CT Manifestations of Coronavirus Disease (COVID-19) Pneumonia and Influenza Virus Pneumonia: A Comparative Study.AJR Am J Roentgenol. 2021 Jan;216(1):71-79. doi: 10.2214/AJR.20.23304. Epub 2020 Jul 9. AJR Am J Roentgenol. 2021. PMID: 32755175
-
Review on Diagnosis of COVID-19 from Chest CT Images Using Artificial Intelligence.Comput Math Methods Med. 2020 Sep 26;2020:9756518. doi: 10.1155/2020/9756518. eCollection 2020. Comput Math Methods Med. 2020. PMID: 33014121 Free PMC article. Review.
-
Thoracic imaging tests for the diagnosis of COVID-19.Cochrane Database Syst Rev. 2020 Sep 30;9:CD013639. doi: 10.1002/14651858.CD013639.pub2. Cochrane Database Syst Rev. 2020. Update in: Cochrane Database Syst Rev. 2020 Nov 26;11:CD013639. doi: 10.1002/14651858.CD013639.pub3. PMID: 32997361 Updated.
Cited by
-
A Systematic Review on Deep Structured Learning for COVID-19 Screening Using Chest CT from 2020 to 2022.Healthcare (Basel). 2023 Aug 24;11(17):2388. doi: 10.3390/healthcare11172388. Healthcare (Basel). 2023. PMID: 37685422 Free PMC article. Review.
-
Relationship Between Medical Questionnaire and Influenza Rapid Test Positivity: Subjective Pretest Probability, "I Think I Have Influenza," Contributes to the Positivity Rate.Cureus. 2021 Jul 28;13(7):e16679. doi: 10.7759/cureus.16679. eCollection 2021 Jul. Cureus. 2021. PMID: 34462700 Free PMC article.
-
The Applications of Artificial Intelligence in Chest Imaging of COVID-19 Patients: A Literature Review.Diagnostics (Basel). 2021 Jul 22;11(8):1317. doi: 10.3390/diagnostics11081317. Diagnostics (Basel). 2021. PMID: 34441252 Free PMC article. Review.
-
Automatic coronavirus disease 2019 diagnosis based on chest radiography and deep learning - Success story or dataset bias?Med Phys. 2022 Feb;49(2):978-987. doi: 10.1002/mp.15419. Epub 2022 Jan 12. Med Phys. 2022. PMID: 34951033 Free PMC article.
-
Economic evaluation of laboratory diagnostic test types in Covid-19 epidemic: A systematic review.Int J Surg. 2022 Sep;105:106820. doi: 10.1016/j.ijsu.2022.106820. Epub 2022 Aug 17. Int J Surg. 2022. PMID: 35987335 Free PMC article.
References
-
- Zhao W, Zhong Z, Xie XZ, Yu QZ, Liu J. Relation Between Chest CT Findings and Clinical Conditions of Coronavirus Disease (COVID-19) Pneumonia: A Multicenter Study. Am J Roentgenol. 2020;214:1072–7. - PubMed
Publication types
MeSH terms
LinkOut - more resources
Full Text Sources
Other Literature Sources
Medical
