

Loss of Choline Agonism in the Inner Ear Hair Cell Nicotinic Acetylcholine Receptor Linked to the α10 Subunit
- PMID: 33613194
- PMCID: PMC7892445
- DOI: 10.3389/fnmol.2021.639720
Loss of Choline Agonism in the Inner Ear Hair Cell Nicotinic Acetylcholine Receptor Linked to the α10 Subunit
Abstract
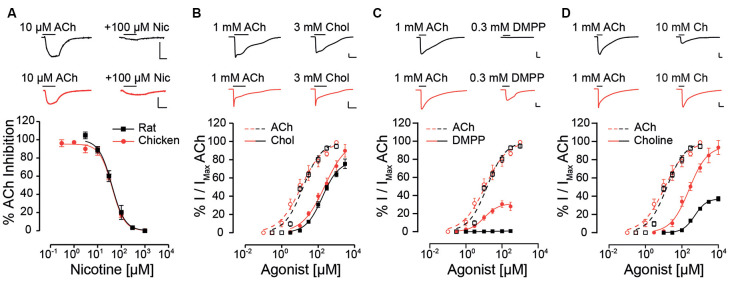
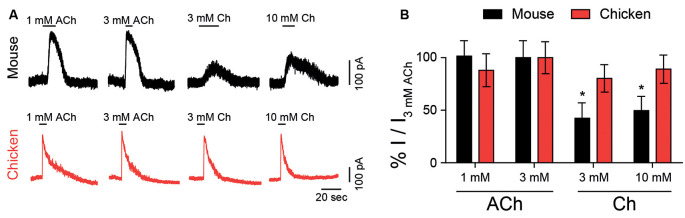
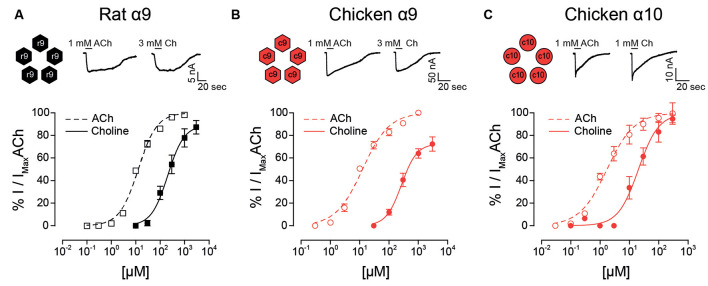
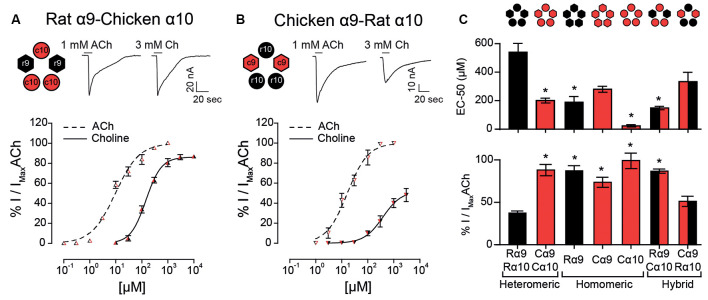
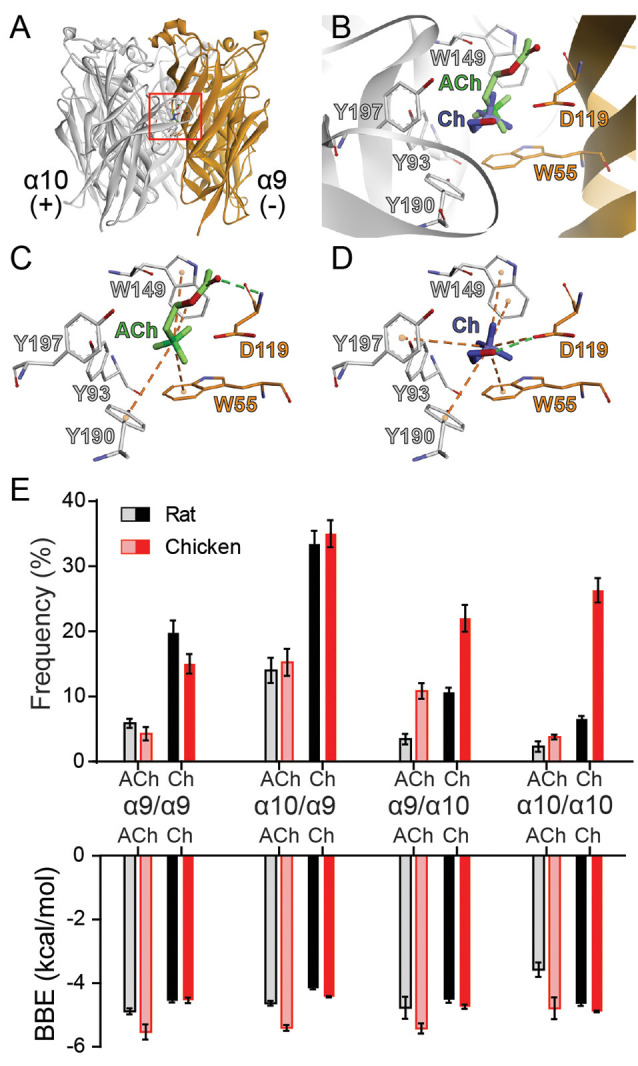
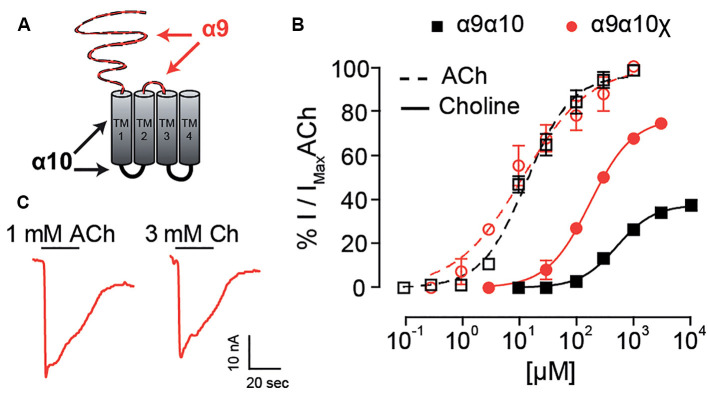
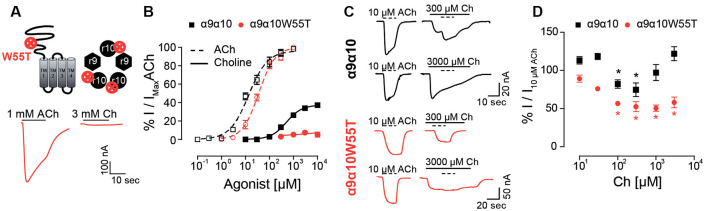
The α9α10 nicotinic acetylcholine receptor (nAChR) plays a fundamental role in inner ear physiology. It mediates synaptic transmission between efferent olivocochlear fibers that descend from the brainstem and hair cells of the auditory sensory epithelium. The α9 and α10 subunits have undergone a distinct evolutionary history within the family of nAChRs. Predominantly in mammalian vertebrates, the α9α10 receptor has accumulated changes at the protein level that may ultimately relate to the evolutionary history of the mammalian hearing organ. In the present work, we investigated the responses of α9α10 nAChRs to choline, the metabolite of acetylcholine degradation at the synaptic cleft. Whereas choline is a full agonist of chicken α9α10 receptors it is a partial agonist of the rat receptor. Making use of the expression of α9α10 heterologous receptors, encompassing wild-type, heteromeric, homomeric, mutant, chimeric, and hybrid receptors, and in silico molecular docking, we establish that the mammalian (rat) α10 nAChR subunit underscores the reduced efficacy of choline. Moreover, we show that whereas the complementary face of the α10 subunit does not play an important role in the activation of the receptor by ACh, it is strictly required for choline responses. Thus, we propose that the evolutionary changes acquired in the mammalian α9α10 nAChR resulted in the loss of choline acting as a full agonist at the efferent synapse, without affecting the triggering of ACh responses. This may have accompanied the fine-tuning of hair cell post-synaptic responses to the high-frequency activity of efferent medial olivocochlear fibers that modulate the cochlear amplifier.
Keywords: acetylcholine; choline; cochlea; evolution; hearing; ion channels; nicotinic receptors.
Copyright © 2021 Moglie, Marcovich, Corradi, Carpaneto Freixas, Gallino, Plazas, Bouzat, Lipovsek and Elgoyhen.
Conflict of interest statement
The authors declare that the research was conducted in the absence of any commercial or financial relationships that could be construed as a potential conflict of interest.
Figures
Similar articles
-
The Hair Cell α9α10 Nicotinic Acetylcholine Receptor: Odd Cousin in an Old Family.Front Cell Neurosci. 2021 Nov 15;15:785265. doi: 10.3389/fncel.2021.785265. eCollection 2021. Front Cell Neurosci. 2021. PMID: 34867208 Free PMC article. Review.
-
Key role of the TM2-TM3 loop in calcium potentiation of the α9α10 nicotinic acetylcholine receptor.Cell Mol Life Sci. 2024 Aug 9;81(1):337. doi: 10.1007/s00018-024-05381-2. Cell Mol Life Sci. 2024. PMID: 39120784 Free PMC article.
-
The alpha10 nicotinic acetylcholine receptor subunit is required for normal synaptic function and integrity of the olivocochlear system.Proc Natl Acad Sci U S A. 2007 Dec 18;104(51):20594-9. doi: 10.1073/pnas.0708545105. Epub 2007 Dec 12. Proc Natl Acad Sci U S A. 2007. PMID: 18077337 Free PMC article.
-
Presence of multiple binding sites on α9α10 nAChR receptors alludes to stoichiometric-dependent action of the α-conotoxin, Vc1.1.Biochem Pharmacol. 2014 May 1;89(1):131-40. doi: 10.1016/j.bcp.2014.02.002. Epub 2014 Feb 15. Biochem Pharmacol. 2014. PMID: 24548457 Free PMC article.
-
The α9α10 acetylcholine receptor: A non-neuronal nicotinic receptor.Pharmacol Res. 2023 Apr;190:106735. doi: 10.1016/j.phrs.2023.106735. Epub 2023 Mar 15. Pharmacol Res. 2023. PMID: 36931539 Review.
Cited by
-
Alkaloid ligands enable function of homomeric human α10 nicotinic acetylcholine receptors.Front Pharmacol. 2022 Sep 16;13:981760. doi: 10.3389/fphar.2022.981760. eCollection 2022. Front Pharmacol. 2022. PMID: 36188578 Free PMC article.
-
The α9α10 nicotinic acetylcholine receptor: a compelling drug target for hearing loss?Expert Opin Ther Targets. 2022 Mar;26(3):291-302. doi: 10.1080/14728222.2022.2047931. Epub 2022 Mar 7. Expert Opin Ther Targets. 2022. PMID: 35225139 Free PMC article. Review.
-
Interaction of α9α10 Nicotinic Receptors With Peptides and Proteins From Animal Venoms.Front Cell Neurosci. 2021 Dec 23;15:765541. doi: 10.3389/fncel.2021.765541. eCollection 2021. Front Cell Neurosci. 2021. PMID: 35002625 Free PMC article.
-
Comparison of the Anti-inflammatory Properties of Two Nicotinic Acetylcholine Receptor Ligands, Phosphocholine and pCF3-diEPP.Front Cell Neurosci. 2022 Mar 31;16:779081. doi: 10.3389/fncel.2022.779081. eCollection 2022. Front Cell Neurosci. 2022. PMID: 35431807 Free PMC article.
-
The Hair Cell α9α10 Nicotinic Acetylcholine Receptor: Odd Cousin in an Old Family.Front Cell Neurosci. 2021 Nov 15;15:785265. doi: 10.3389/fncel.2021.785265. eCollection 2021. Front Cell Neurosci. 2021. PMID: 34867208 Free PMC article. Review.
References
Grants and funding
LinkOut - more resources
Full Text Sources
Other Literature Sources