

Brain Metabolite, N-Acetylaspartate Is a Potent Protein Aggregation Inhibitor
- PMID: 33613199
- PMCID: PMC7894078
- DOI: 10.3389/fncel.2021.617308
Brain Metabolite, N-Acetylaspartate Is a Potent Protein Aggregation Inhibitor
Abstract
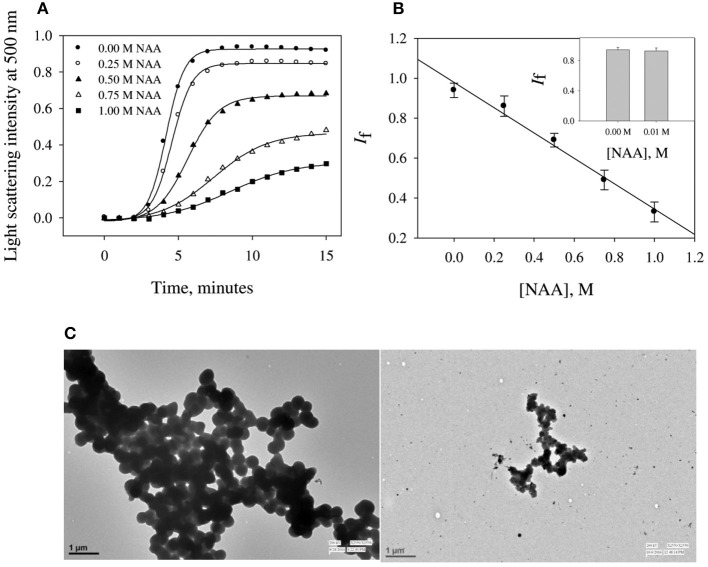
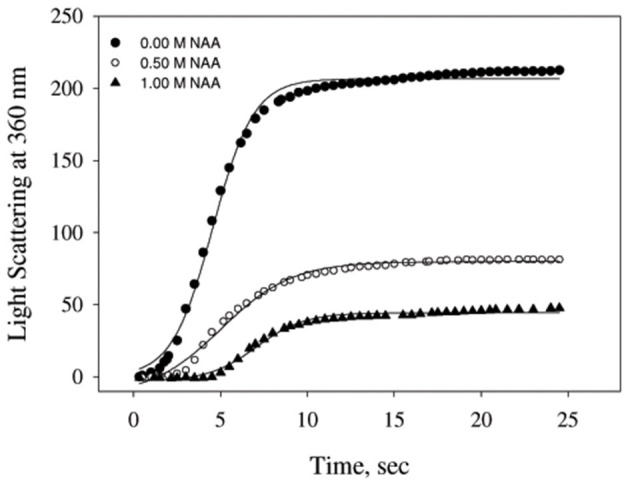
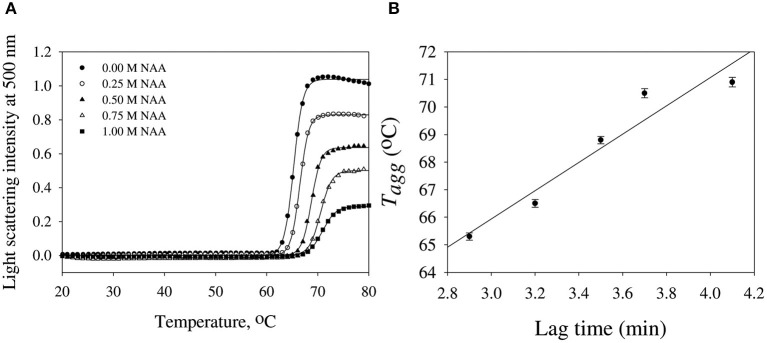
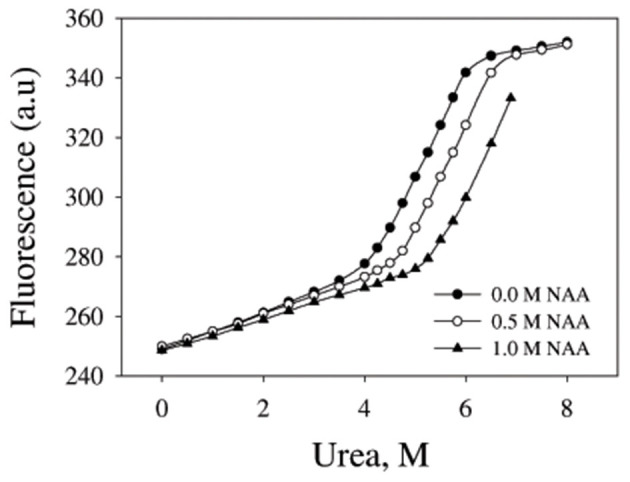
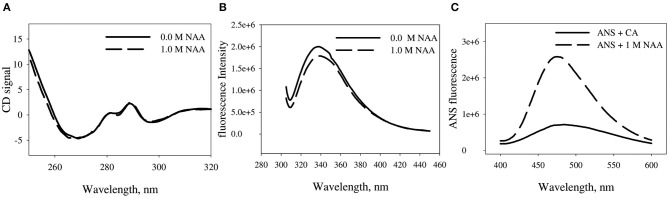
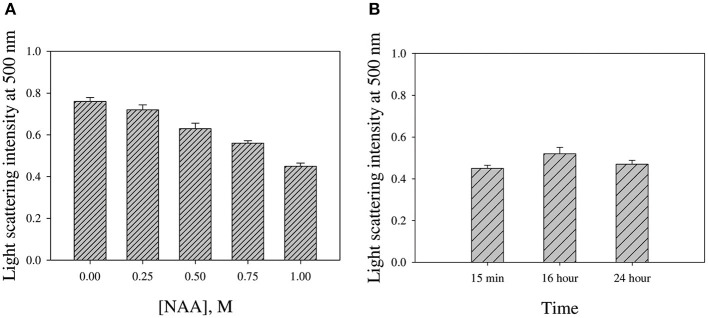
Deposition of toxic protein inclusions is a common hallmark of many neurodegenerative disorders including Alzheimer's disease, Parkinson disease etc. N-acetylaspartate (NAA) is an important brain metabolite whose levels got altered under various neurodegenerative conditions. Indeed, NAA has been a widely accepted biological marker for various neurological disorders. We have also reported that NAA is a protein stabilizer. In the present communication, we investigated the role of NAA in modulating the aggregation propensity on two model proteins (carbonic anhydrase and catalase). We discovered that NAA suppresses protein aggregation and could solubilize preformed aggregates.
Keywords: light scattering; neurological disorders; protein aggregation; protein denaturation; protein stability.
Copyright © 2021 Warepam, Mishra, Sharma, Kumari, Krishna, Khan, Rahman and Singh.
Conflict of interest statement
The authors declare that the research was conducted in the absence of any commercial or financial relationships that could be construed as a potential conflict of interest.
Figures
Similar articles
-
N-Acetylaspartate Is an Important Brain Osmolyte.Biomolecules. 2020 Feb 12;10(2):286. doi: 10.3390/biom10020286. Biomolecules. 2020. PMID: 32059525 Free PMC article.
-
Newfound effect of N-acetylaspartate in preventing and reversing aggregation of amyloid-beta in vitro.Neurobiol Dis. 2018 Sep;117:161-169. doi: 10.1016/j.nbd.2018.05.023. Epub 2018 May 31. Neurobiol Dis. 2018. PMID: 29859874 Free PMC article.
-
Inhibitory potential of N-acetylaspartate against protein glycation, AGEs formation and aggregation: Implication of brain osmolyte in glycation-related complications.Int J Biol Macromol. 2023 Jul 31;244:125405. doi: 10.1016/j.ijbiomac.2023.125405. Epub 2023 Jun 17. Int J Biol Macromol. 2023. PMID: 37336383
-
N-acetylaspartate in neuropsychiatric disorders.Prog Neurobiol. 1995 Aug;46(5):531-40. doi: 10.1016/0301-0082(95)00014-m. Prog Neurobiol. 1995. PMID: 8532851 Review.
-
Magnetic resonance spectroscopy in Alzheimer's disease: focus on N-acetylaspartate.Acta Neurol Scand Suppl. 2000;176:20-6. doi: 10.1034/j.1600-0404.2000.00303.x. Acta Neurol Scand Suppl. 2000. PMID: 11261801 Review.
Cited by
-
Exploring the Association between Cathepsin B and Parkinson's Disease.Brain Sci. 2024 May 10;14(5):482. doi: 10.3390/brainsci14050482. Brain Sci. 2024. PMID: 38790460 Free PMC article.
-
Review of Metabolomics-Based Biomarker Research for Parkinson's Disease.Mol Neurobiol. 2022 Feb;59(2):1041-1057. doi: 10.1007/s12035-021-02657-7. Epub 2021 Nov 26. Mol Neurobiol. 2022. PMID: 34826053 Review.
-
Diagnosing Parkinson's disease and monitoring its progression: Biomarkers from combined GC-TOF MS and LC-MS/MS untargeted metabolomics.Heliyon. 2024 Apr 27;10(9):e30452. doi: 10.1016/j.heliyon.2024.e30452. eCollection 2024 May 15. Heliyon. 2024. PMID: 38720721 Free PMC article.
-
Aspartate in the Brain: A Review.Neurochem Res. 2025 Jun 12;50(3):199. doi: 10.1007/s11064-025-04454-3. Neurochem Res. 2025. PMID: 40506607 Free PMC article. Review.
-
Serum neurotransmitter analysis of motor and non-motor symptoms in Parkinson's patients.Front Aging Neurosci. 2024 Nov 25;16:1423120. doi: 10.3389/fnagi.2024.1423120. eCollection 2024. Front Aging Neurosci. 2024. PMID: 39654806 Free PMC article.
References
-
- Abbott C., Bustillo J. (2006). What have we learned from proton magnetic resonance spectroscopy about schizophrenia? A critical update. Curr. Opin. Psychiatry 19, 135–139. 10.1097/01.yco.0000214337.29378.cd - DOI - PubMed
LinkOut - more resources
Full Text Sources
Other Literature Sources