

Repetitive Transcranial Magnetic Stimulation (rTMS) Improves the Gait Disorders of Rats Under Simulated Microgravity Conditions Associated With the Regulation of Motor Cortex
- PMID: 33613305
- PMCID: PMC7890125
- DOI: 10.3389/fphys.2021.587515
Repetitive Transcranial Magnetic Stimulation (rTMS) Improves the Gait Disorders of Rats Under Simulated Microgravity Conditions Associated With the Regulation of Motor Cortex
Abstract
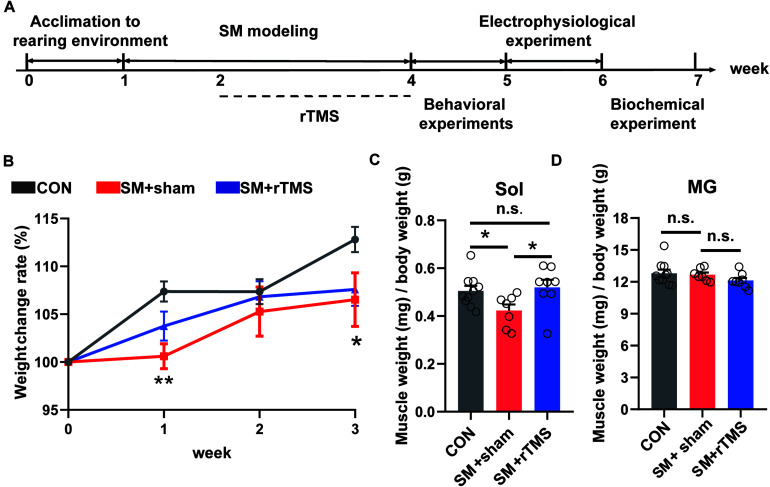
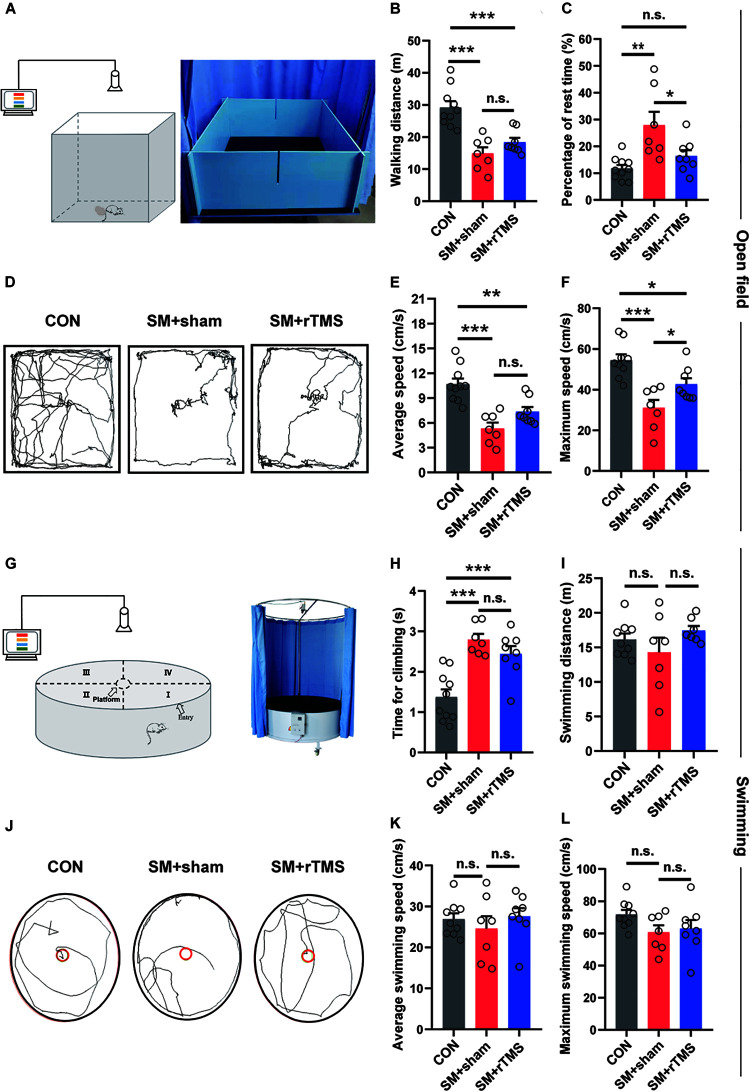
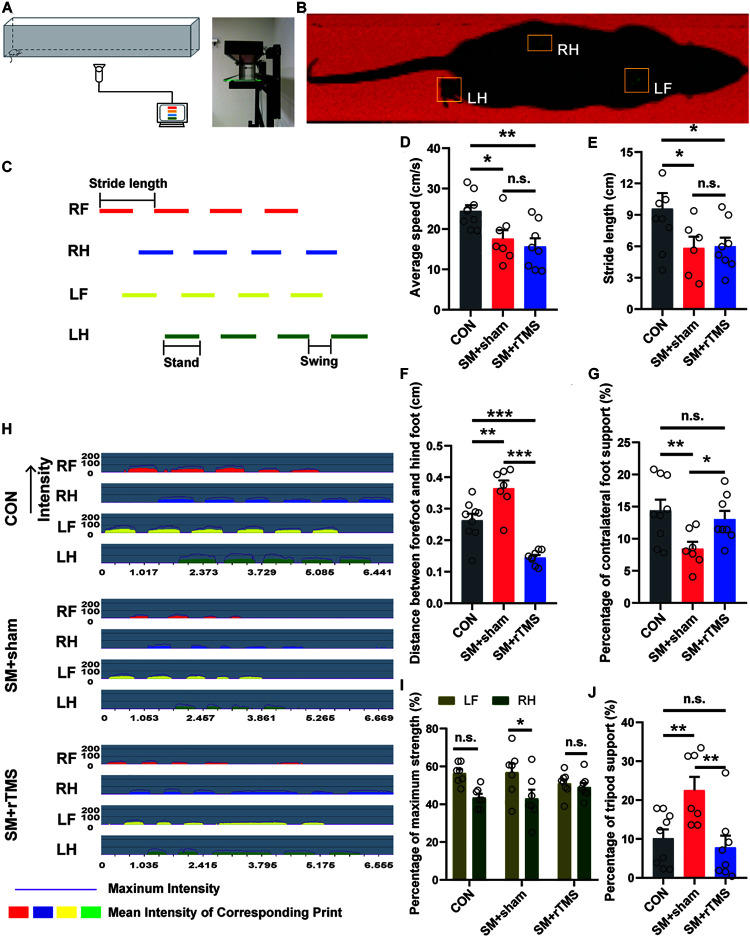
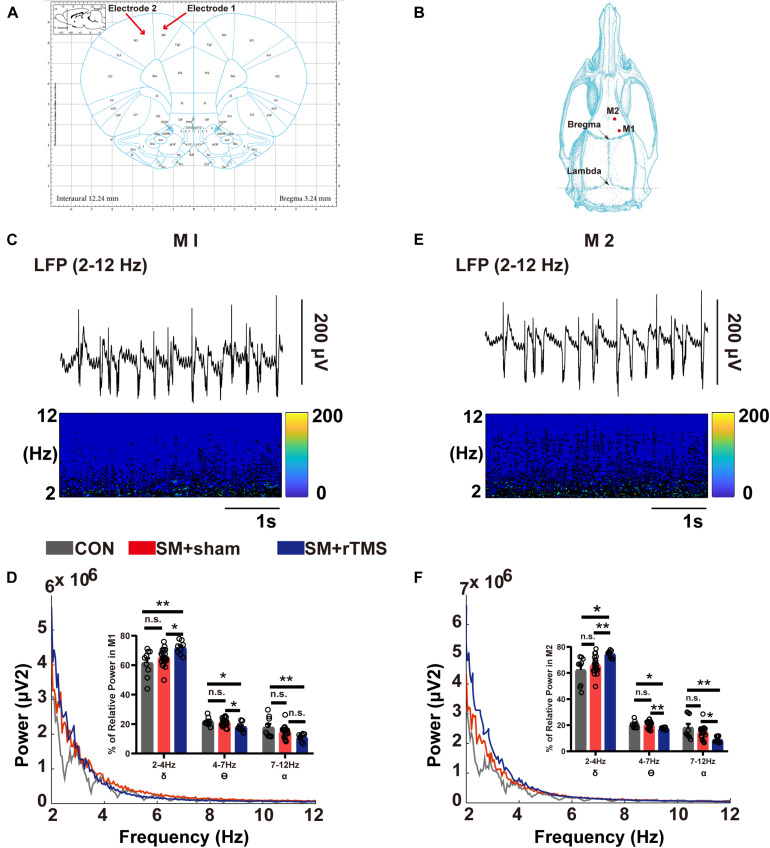
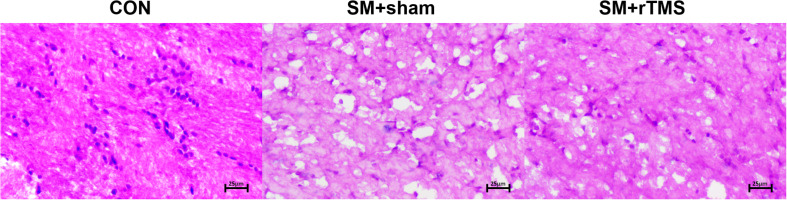
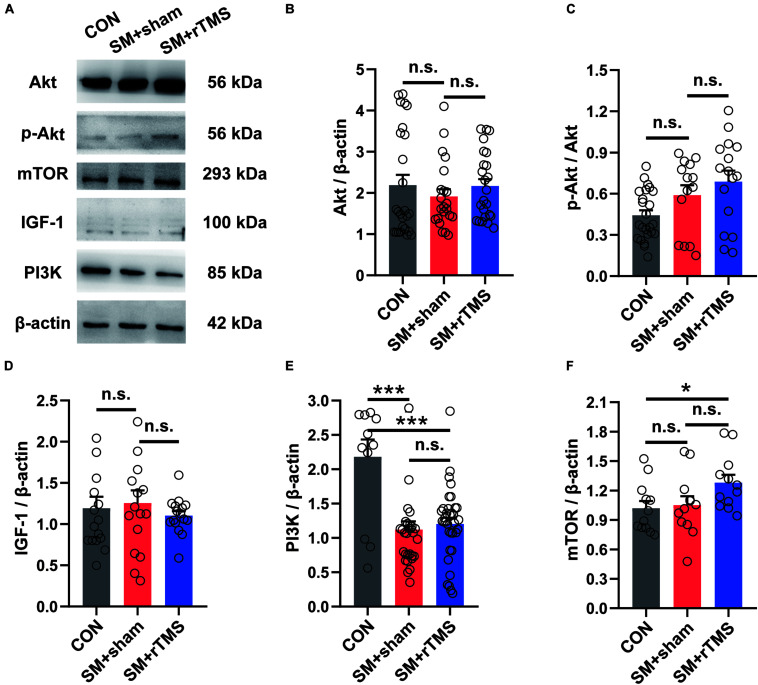
In previous studies, it has been proved that repetitive transcranial magnetic stimulation (rTMS) improves dyskinesia induced by conditions such as spinal cord injury, Parkinson diseases and cerebral ischemia. However, it is still unknown whether it can be used as a countermeasure for gait disorders in astronauts during space flight. In this study, we evaluated the effects of rTMS on the rat gait function under simulated microgravity (SM) conditions. The SM procedure continued for consecutive 21 days in male Wistar rats. Meanwhile, the high-frequency rTMS (10 Hz) was applied for 14 days from the eighth day of SM procedure. The behavioral results showed that SM could cause gait disorders such as decreased walking ability and contralateral limb imbalance in rats, which could be reversed by rTMS. Furthermore, rTMS affected the neural oscillations of motor cortex, enhancing in δ (2-4 Hz) band, suppressing in θ (4-7 Hz), and α (7-12 Hz) bands. Additionally, rTMS could activate mTOR in the motor cortex. These data suggests that the improvement effects of rTMS on gait disorders in rats under SM conditions might be associated with its regulation on neural oscillations in the cerebral motor cortex and the expression of some motor-related proteins which may enhance the control of nervous system on muscle function. Based on our results, rTMS can be used as an potential effective supplement in the field of clinical and rehabilitation research to reduce gait disorders caused by the space environment.
Keywords: IGF-1-PI3K-Akt-mTOR signaling pathway; gait disorders; local field potential; repetitive transcranial magnetic stimulation; simulated microgravity.
Copyright © 2021 Yang, Liang, Wang, Zheng, Xiao and Ming.
Conflict of interest statement
The authors declare that the research was conducted in the absence of any commercial or financial relationships that could be construed as a potential conflict of interest.
Figures
Similar articles
-
Effects of high-frequency repetitive transcranial magnetic stimulation on motor and gait improvement in incomplete spinal cord injury patients.Neurorehabil Neural Repair. 2013 Jun;27(5):421-9. doi: 10.1177/1545968312471901. Epub 2013 Jan 15. Neurorehabil Neural Repair. 2013. Retraction in: Neurorehabil Neural Repair. 2014 Jun;28(5):504. doi: 10.1177/1545968314536858. PMID: 23322551 Retracted. Clinical Trial.
-
Efficacy of coupling intermittent theta-burst stimulation and 1 Hz repetitive transcranial magnetic stimulation to enhance upper limb motor recovery in subacute stroke patients: A randomized controlled trial.Restor Neurol Neurosci. 2020;38(1):109-118. doi: 10.3233/RNN-190953. Restor Neurol Neurosci. 2020. PMID: 32039879 Clinical Trial.
-
Preconditioning human pharyngeal motor cortex enhances directional metaplasticity induced by repetitive transcranial magnetic stimulation.J Physiol. 2020 Nov;598(22):5213-5230. doi: 10.1113/JP279977. Epub 2020 Sep 3. J Physiol. 2020. PMID: 32804405
-
The Effect of Repetitive Transcranial Magnetic Stimulation on Lower-Limb Motor Ability in Stroke Patients: A Systematic Review.Front Hum Neurosci. 2021 Sep 1;15:620573. doi: 10.3389/fnhum.2021.620573. eCollection 2021. Front Hum Neurosci. 2021. PMID: 34539362 Free PMC article.
-
Intensity-dependent regional cerebral blood flow during 1-Hz repetitive transcranial magnetic stimulation (rTMS) in healthy volunteers studied with H215O positron emission tomography: I. Effects of primary motor cortex rTMS.Biol Psychiatry. 2003 Oct 15;54(8):818-25. doi: 10.1016/s0006-3223(03)00002-7. Biol Psychiatry. 2003. PMID: 14550681 Review.
Cited by
-
Intermittent Theta Burst Stimulation Ameliorates Cognitive Deficit and Attenuates Neuroinflammation via PI3K/Akt/mTOR Signaling Pathway in Alzheimer's-Like Disease Model.Front Aging Neurosci. 2022 May 17;14:889983. doi: 10.3389/fnagi.2022.889983. eCollection 2022. Front Aging Neurosci. 2022. PMID: 35656538 Free PMC article.
-
Time-course adaptive changes in hippocampal transcriptome and synaptic function induced by simulated microgravity associated with cognition.Front Cell Neurosci. 2023 Oct 5;17:1275771. doi: 10.3389/fncel.2023.1275771. eCollection 2023. Front Cell Neurosci. 2023. PMID: 37868195 Free PMC article.
-
Magnetic Stimulation of Gigantocellular Reticular Nucleus with Iron Oxide Nanoparticles Combined Treadmill Training Enhanced Locomotor Recovery by Reorganizing Cortico-Reticulo-Spinal Circuit.Int J Nanomedicine. 2024 Jul 23;19:7473-7492. doi: 10.2147/IJN.S464498. eCollection 2024. Int J Nanomedicine. 2024. PMID: 39071504 Free PMC article.
-
Subthreshold repetitive transcranial magnetic stimulation suppresses ketamine-induced poly population spikes in rat sensorimotor cortex.Front Neurosci. 2022 Oct 21;16:998704. doi: 10.3389/fnins.2022.998704. eCollection 2022. Front Neurosci. 2022. PMID: 36340783 Free PMC article.
-
Repetitive transcranial magnetic stimulation promotes motor function recovery in mice after spinal cord injury via regulation of the Cx43-autophagy loop.J Orthop Surg Res. 2024 Jul 2;19(1):387. doi: 10.1186/s13018-024-04879-6. J Orthop Surg Res. 2024. PMID: 38956661 Free PMC article.
References
LinkOut - more resources
Full Text Sources
Other Literature Sources
Miscellaneous