. 2021 Feb 3:12:620250.
doi: 10.3389/fphys.2021.620250. eCollection 2021.

Electrocardiographic Imaging: A Comparison of Iterative Solvers

Affiliations

Electrocardiographic Imaging: A Comparison of Iterative Solvers

Marta Borràs et al. Front Physiol. .

Abstract

Cardiac disease is a leading cause of morbidity and mortality in developed countries. Currently, non-invasive techniques that can identify patients at risk and provide accurate diagnosis and ablation guidance therapy are under development. One of these is electrocardiographic imaging (ECGI). In ECGI, the first step is to formulate a forward problem that relates the unknown potential sources on the cardiac surface to the measured body surface potentials. Then, the unknown potential sources on the cardiac surface are reconstructed through the solution of an inverse problem. Unfortunately, ECGI still lacks accuracy due to the underlying inverse problem being ill-posed, and this consequently imposes limitations on the understanding and treatment of many cardiac diseases. Therefore, it is necessary to improve the solution of the inverse problem. In this work, we transfer and adapt four inverse problem methods to the ECGI setting: algebraic reconstruction technique (ART), random ART, ART Split Bregman (ART-SB) and range restricted generalized minimal residual (RRGMRES) method. We test all these methods with data from the Experimental Data and Geometric Analysis Repository (EDGAR) and compare their solution with the recorded epicardial potentials provided by EDGAR and a generalized minimal residual (GMRES) iterative method computed solution. Activation maps are also computed and compared. The results show that ART achieved the most stable solutions and, for some datasets, returned the best reconstruction. Differences between the solutions derived from ART and random ART are almost negligible, and the accuracy of their solutions is followed by RRGMRES, ART-SB and finally the GMRES (which returned the worst reconstructions). The RRGMRES method provided the best reconstruction for some datasets but appeared to be less stable than ART when comparing different datasets. In conclusion, we show that the proposed methods (ART, random ART, and RRGMRES) improve the GMRES solution, which has been suggested as inverse problem solution for ECGI.

Keywords: ART; ART-SB; ECGI; GMRES; MFS; RRGMRES; inverse problem; iterative methods.


Conflict of interest statement

The authors declare that the research was conducted in the absence of any commercial or financial relationships that could be construed as a potential conflict of interest.

Figures

FIGURE 1
FIGURE 1
Schematic configuration of the pseudo-boundaries [deflating 0.8 and inflating 1.2, using the experimental values accorded in Wang and Rudy (2006)]. Where ΓT is the body surface, ΓE the epicardial surface, ΓT^ is the virtual inflated body surface, ΓE^ the virtual deflated epicardial surface, and Ω the domain of interest.
FIGURE 2
FIGURE 2
Quartiles (Q*) and boxplots’ description schema.
FIGURE 3
FIGURE 3
Boxplots showing the mean, the distribution, the standard deviation (“whiskers”) and the outliers (“*”), for: (A) the CC results of the sinus rhythm; (B) the CC results of the paced rhythm; (C) the RE results of the sinus rhythm; (D) the RE results of the paced rhythm. Y-axis specify the dataset and the reconstruction method used.Similarly, for a two control subjects and four ischemia ones from the Utah dataset, the boxplots to compare the reconstructions with the respective target potentials (i.e., the provided potentials measured at the cage) were respectively shown in Figures 4, 5.
FIGURE 4
FIGURE 4
Boxplots showing the mean, the distribution, the standard deviation (“whiskers”) and the outliers (“*”), for: (A) CC and (B) RE. The y-axis show the reconstruction method used for each one of the two control recordings of the Utah dataset (Control 1, Control 2).
FIGURE 5
FIGURE 5
Boxplots showing the mean, the distribution, the standard deviation (“whiskers”) and the outliers (“*”), for: (A) CC and (B) RE. Y-axis show the reconstruction method used for each one of the four ischemia recordings of the Utah dataset (I1, I2, I3, I4).
FIGURE 6
FIGURE 6
For the datasets: (A) the sinus rhythm of Maastricth; (B) the sinus rhythm of Auckland; (C) the paced rhythm of Maastricth; (D) the paced rhythm of Auckland. From top to down: “temporal” CC and RE of each reconstruction technique and RMS of the target potentials. All of them for a defined 100 ms window over the QRS.
FIGURE 7
FIGURE 7
RE and CC of each reconstruction technique and RMS of the target potentials, averaged over space during a defined temporal window over the QRS, for (A) a control Utah dataset (Control 1) and (B) an ischemia Utah dataset (I3).
FIGURE 8
FIGURE 8
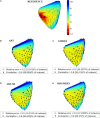
Activation maps applied to the paced rhythm Auckland dataset, for: (A) Reference potentials; (B) ART; (C) GMRES; (D) ART Split Bregman; (E) RRGMRES. All figures have the same colorbar than panel (A). For each activation map, the locations corresponding to the “spatial” RE < 0.5 and CC > 0.8 are overplotted as shown in the legend.
FIGURE 9
FIGURE 9
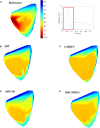
Activation maps of the potentials during a 100 ms window (over QRS), applied to the paced rhythm Auckland dataset for: (A) Reference potentials and QRS window; (B) ART; (C) GMRES; (D) ART Split Bregman; (E) RRGMRES. All figures have the same colorbar than panel (A).

Similar articles

Cited by

References

    1. Almer J., Elmberg V., Bränsvik J., Nordlund D., Khoshnood A., Ringborn M., et al. (2019). Ischemic QRS prolongation as a biomarker of myocardial injury in STEMI patients. Ann. Noninvasive Electrocardiol. 24:e12601. 10.1111/anec.12601 - DOI - PMC - PubMed
    1. Aras K., Good W., Tate J., Burton B., Brooks D., Coll-Fontet J., et al. (2015). Experimental Data and Geometric Analysis Repository (EDGAR). J. Electrocardiol. 48 975–981. 10.1016/j.jelectrocard.2015.08.008 - DOI - PMC - PubMed
    1. Barr R. C., Ramsey M., Spach M. S. (1977). Relating Epicardial to Body Surface Potential Distributions by Means of Transfer Coefficients Based on Geometry Measurements. IEEE Trans. Biomed. Engine. 24 1–11. 10.1109/TBME.1977.326201 - DOI - PubMed
    1. Bear L. R., LeGrice I. J., Sands G. B., Lever N. A., Paterson D. J., et al. (2015). Forward Problem of Electrocardiography. Circulat. Arrhythmia Electrophysiol. 8 677–684. 10.1161/CIRCEP.114.001573 - DOI - PubMed
    1. Burnes J. E., Taccardi B., MacLeod R. S., Rudy Y. (2000). Noninvasive ECG imaging of electrophysiologically abnormal substrates in infarcted hearts: a model study. Circulation 101 533–540. 10.1161/01.CIR.101.5.533 - DOI - PubMed

LinkOut - more resources