. 2021 Feb 3:11:618436.
doi: 10.3389/fpsyg.2020.618436. eCollection 2020.

Altered Cerebellar White Matter in Sensory Processing Dysfunction Is Associated With Impaired Multisensory Integration and Attention

Affiliations

Altered Cerebellar White Matter in Sensory Processing Dysfunction Is Associated With Impaired Multisensory Integration and Attention

Anisha Narayan et al. Front Psychol. .

Abstract

Sensory processing dysfunction (SPD) is characterized by a behaviorally observed difference in the response to sensory information from the environment. While the cerebellum is involved in normal sensory processing, it has not yet been examined in SPD. Diffusion tensor imaging scans of children with SPD (n = 42) and typically developing controls (TDC; n = 39) were compared for fractional anisotropy (FA), mean diffusivity (MD), radial diffusivity (RD), and axial diffusivity (AD) across the following cerebellar tracts: the middle cerebellar peduncles (MCP), superior cerebellar peduncles (SCP), and cerebral peduncles (CP). Compared to TDC, children with SPD show reduced microstructural integrity of the SCP and MCP, characterized by reduced FA and increased MD and RD, which correlates with abnormal auditory behavior, multisensory integration, and attention, but not tactile behavior or direct measures of auditory discrimination. In contradistinction, decreased CP microstructural integrity in SPD correlates with abnormal tactile and auditory behavior and direct measures of auditory discrimination, but not multisensory integration or attention. Hence, altered cerebellar white matter organization is associated with complex sensory behavior and attention in SPD, which prompts further consideration of diagnostic measures and treatments to better serve affected individuals.

Keywords: cerebellum; connectivity; diffusion tensor imaging; fractional anisotropy; neurodevelopmental disorders; sensory processing; white matter.


Conflict of interest statement

MR, MG, and EM were employed by Cortica Healthcare. The remaining authors declare that the research was conducted in the absence of any commercial or financial relationships that could be construed as a potential conflict of interest.

Figures

Figure 1
Figure 1
Johns Hopkins University ICBM-DTI-81 White-Matter Labeled Atlas regions of interest on the white matter skeleton in MNI152 space for the five studied tracts. (A) Right cerebral peduncle (CP-R, pink) and left cerebral peduncle (CP-L, light blue). (B) CP-R (pink), CP-L (light blue), right superior cerebellar peduncle (SCP-R, green), and left superior cerebellar peduncle (SCP-L, red). (C) Middle cerebellar peduncle (MCP, dark blue), SCP-R (green), and SCP-L (red). (D) MCP (dark blue). Images are presented in radiological convention (left hemisphere on right side of image).
Figure 2
Figure 2
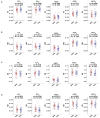
DTI group comparison of typically developing controls (TDC, blue) to sensory processing dysfunction subjects (SPD, red) using fractional anisotropy (FA), mean diffusivity (MD), axial diffusivity (AD), and radial diffusivity (RD). Tracts include the cerebral peduncles (CP, right and left), middle cerebellar peduncle (MCP), and superior cerebellar peduncles (SCP, right and left). (A) FA shows significant differences for CP-R and SCP-R, with lower FA in SPD subjects. (B) MD plots show significant differences for MCP and SCP-R, with higher MD in SPD subjects. (C) AD plots show no significant differences for any of the five white matter tracts examined. (D) RD plots show significant differences for CP-R, MCP, and SCP-R with higher RD in SPD subjects. Statistical significance at p < 0.05 is indicated by an asterisk. d Represents Cohen's d effect size.
Figure 3
Figure 3
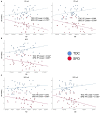
Correlation of TDC (blue) and SPD subjects (red) with Differential Screening Test for Processing (DSTP) scores. Statistical significance at p < 0.05 is denoted with an asterisk next to the R2 value. (A) DSTP acoustic subtest score is correlated with FA in CP-L, FA in CP-R, and RD in CP-R for SPD but not TDC subjects. (B) DSTP acoustic linguistic subtest score is correlated with FA in CP-L and FA in CP-R for SPD but not TDC subjects. (C) DSTP total score is correlated with FA in CP-L, FA in CP-R, and RD in CP-R for SPD but not TDC subjects.
Figure 4
Figure 4
Correlation of TDC (blue) and SPD subjects (red) with the Sensory Profile (SP) auditory processing score. Statistical significance at p < 0.05 is denoted with an asterisk next to the R2 value. (A) SP auditory processing score is correlated with RD in CP-L and MD in CP-L for SPD but not TDC subjects. (B) SP auditory processing score is correlated with RD in MCP for both SPD and TDC subjects. (C) SP auditory processing score is correlated with RD in SCP-L and MD in SCP-L in SPD but not TDC subjects.
Figure 5
Figure 5
Correlation of TDC (blue) and SPD subjects (red) with SP tactile processing score. Statistical significance at p < 0.05 is denoted with an asterisk next to the R2 value. (A) SP tactile processing score is correlated with RD in CP-L for SPD but not TDC subjects. (B) SP tactile processing score is correlated with FA in CP-L for SPD but not TDC subjects.
Figure 6
Figure 6
Correlation of TDC (blue) and SPD subjects (red) with SP multisensory processing score. Statistical significance at p < 0.05 is denoted with an asterisk next to the R2 value. (A) SP multisensory processing score is correlated with FA in SCP-L and FA in SCP-R for SPD but not TDC subjects. (B) SP multisensory processing score is correlated with RD in SCP-L and RD in SCP-R for SPD but not TDC subjects.
Figure 7
Figure 7
Correlation of TDC (blue) and SPD subjects (red) with SP inattention score. Statistical significance at p < 0.05 is denoted with an asterisk next to the R2 value. (A) Sensory Profile (SP) inattention score is correlated with RD in SCP-R for SPD but not TDC subjects. (B) SP inattention score is correlated with RD in SCP-L, FA in SCP-L, and MD in SCP-L for SPD but not TDC subjects. (C) SP inattention score is correlated with RD in MCP and FA in MCP for SPD but not TDC subjects.

Similar articles

Cited by

References

    1. Ahn R. R., Miller L. J., Milberger S., McIntosh D. N. (2004). Prevalence of parents' perceptions of sensory processing disorders among kindergarten children. Am. J. Occup. Ther. 58, 287–293. 10.5014/ajot.58.3.287 - DOI - PubMed
    1. Ailion A. S., King T. Z., Roberts S. R., Tang B., Turner J. A., Conway C. M., et al. . (2020). Double dissociation of auditory attention span and visual attention in long-term survivors of childhood cerebellar tumor: a deterministic tractography study of the cerebellar-frontal and the superior longitudinal fasciculus pathways. J. Int. Neuropsychol. Soc. 26, 939–953. 10.1017/S1355617720000417 - DOI - PubMed
    1. Alexander A. L., Lee J. E., Lazar M., Field A. S. (2007). Diffusion tensor imaging of the brain. Neurotherapeutics 4, 316–329. 10.1016/j.nurt.2007.05.011 - DOI - PMC - PubMed
    1. American Psychiatric Association (2013). Diagnostic and Statistical Manual of Mental Disorders: DSM-5. Arlington, VA: American Psychiatric Association; 10.1176/appi.books.9780890425596 - DOI
    1. Bar-Shalita T., Vatine J. J., Seltzer Z., Parush S. (2009). Psychophysical correlates in children with sensory modulation disorder (SMD). Physiol. Behav. 98, 631–639. 10.1016/j.physbeh.2009.09.020 - DOI - PubMed