. 2021 Feb 4:11:629077.
doi: 10.3389/fendo.2020.629077. eCollection 2020.

Signal Transduction Mechanisms for Glucagon-Induced Somatolactin Secretion and Gene Expression in Nile Tilapia (Oreochromis niloticus) Pituitary Cells

Affiliations

Signal Transduction Mechanisms for Glucagon-Induced Somatolactin Secretion and Gene Expression in Nile Tilapia (Oreochromis niloticus) Pituitary Cells

Chaoyi Zhang et al. Front Endocrinol (Lausanne). .

Abstract

Glucagon (GCG) plays a stimulatory role in pituitary hormone regulation, although previous studies have not defined the molecular mechanism whereby GCG affects pituitary hormone secretion. To this end, we identified two distinct proglucagons, Gcga and Gcgb, as well as GCG receptors, Gcgra and Gcgrb, in Nile tilapia (Oreochromis niloticus). Using the cAMP response element (CRE)-luciferase reporter system, tilapia GCGa and GCGb could reciprocally activate the two GCG receptors expressed in human embryonic kidney 293 (HEK293) cells. Quantitative real-time PCR analysis revealed that differential expression of the Gcga and Gcgb and their cognate receptors Gcgra and Gcgrb was found in the various tissues of tilapia. In particular, the Gcgrb is abundantly expressed in the neurointermediate lobe (NIL) of the pituitary gland. In primary cultures of tilapia NIL cells, GCGb effectively stimulated SL release, with parallel rises in the mRNA levels, and co-incubation with the GCG antagonist prevented GCGb-stimulated SL release. In parallel experiments, GCGb treatment dose-dependently enhanced intracellular cyclic adenosine monophosphate (cAMP) accumulation with increasing inositol 1,4,5-trisphosphate (IP3) concentration and the resulting in transient increases of Ca2+ signals in the primary NIL cell culture. Using selective pharmacological approaches, the adenylyl cyclase (AC)/cAMP/protein kinase A (PKA) and phospholipase C (PLC)/IP3/Ca2+/calmodulin (CaM)/CaMK-II pathways were shown to be involved in GCGb-induced SL release and mRNA expression. Together, these results provide evidence for the first time that GCGb can act at the pituitary level to stimulate SL release and gene expression via GCGRb through the activation of the AC/cAMP/PKA and PLC/IP3/Ca2+/CaM/CaMK-II cascades.

Keywords: glucagon; pituitary; secretion and gene expression; somatolactin; tilapia.


Conflict of interest statement

The authors declare that the research was conducted in the absence of any commercial or financial relationships that could be construed as a potential conflict of interest.

Figures

Figure 1
Figure 1
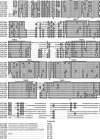
Molecular cloning and sequence alignment of tilapia Gcga and Gcgb. Nucleotide and deduced amino acid sequences of tilapia (A) Gcga and (B) Gcgb. In the amino acid sequence, the putative signal peptides are underlined. GCGs, GLP-1s, and GLP-2 peptides regions are shaded and indicated > to <, and the polyadenylation signal is in bold. An asterisk (*) represents the stop codon. (C) Alignment of tilapia GCGs amino acid sequences with the corresponding GCG sequences reported in zebrafish (zGCGa and zGCGb), Xenopus (xGCG), chicken (cGCG), mouse (mGCG), and human (hGCG). Sequence alignment was using the Clustal W algorithm with DNAMAN software. The conserved amino acid residues in these sequences were boxed in gray. The sequences of Gcgs for other species were downloaded from the GenBank and/or by searching Ensembl genomes. GenBank accession numbers are as follows: tilapia GCGa (tGCGa, MT488303), tilapia GCGb (tGCGb, MT488304), zebrafish GCGa (zGCGa, NP001008595), zebrafish GCGb (zGCGb, NP001229699), Xenopus GCG (xGCG, NP001079787), chicken GCG (cGCG, NP990591), mouse GCG (mGCG, NP032126), and human GCG (hGCG, NP002045).
Figure 2
Figure 2
Alignment of tilapia GCGRs amino acid with the corresponding GCGR sequences reported in other species. Conserved amino acids are shaded. Dots (represented by •) are introduced to maximize sequence homology. Putative TMDs are overlined and labeled 1–7. An asterisk (*) represents potential N-linked glycosylation sites, and conserved cysteine residues are indicated as bold triangles. The sequences of GCGRs for other species were downloaded from the GenBank and/or by searching Ensembl genomes. GenBank accession numbers or Ensembl IDs are as follows: tilapia GCGRa (tGCGRa, MT488305), tilapia GCGRb (tGCGRb, MT488306), zebrafish GCGRa (zGCGRa, ENSDARP00000139469), zebrafish GCGRb (zGCGRb, ENSDARP00000013211), Xenopus GCGR (xGCGR, NP001079221), chicken GCGR (cGCGR, NP001094505), mouse GCGR (mGCGR, AAH57988), and human GCGR (hGCGR, EAW89684).
Figure 3
Figure 3
Functional characterization of tilapia GCGRa and GCGRb expressed in HEK293 cells. HEK293 cells with stable expression of tilapia (A) GCGRa or (B) GCGRb were transfected with CRE-Luc reporter targeting the cAMP pathways and treated for 24 h with increasing doses of the tilapia GCGa, GCGb, and human GCG, respectively. In these experiments, the cotransfection of pTK-RL was used as the internal control, and the data were transformed as a ratio of Renilla luciferase activity in the same sample (as Luc Ratio). All results are expressed as the mean ± SEM (N = 3).
Figure 4
Figure 4
qPCR assay of tilapia (A) Gcgs, and (B) Gcgrs mRNA levels in various tissues. The tissues tested in the present study are as follows: Fa, fat; Hy, hypothalamus; In, intestine; Ki, kidney; Li, liver; Mu, muscle; Pi, pituitary; St, stomach; Te, testis. (C) Expression profiles of tilapia Gcgra and Gcgrb in different pituitary regions, including the pars distalis (PD) and the neurointermediate lobe (NIL) region. The error bar for Gcgra transcripts in NIL cells was too small to be shown on the plotted scale. The transcripts levels of target genes were normalized by that of β-actin and expressed relative to the fat Gcgb, Gcgrb, and PD Gcgrb levels. The data point of each tissue represents the mean ± SEM of six tilapia.
Figure 5
Figure 5
Up-regulation of SL release and gene expression in tilapia NIL cells by GCGs. (A) Time course of tilapia GCGb treatment on SL release (upper panel) and mRNA expression (lower panel) in tilapia NIL cells. In these studies, NIL cells were incubated with GCGb (10 nM) for the duration as indicated. (B) Dose-dependence of GCGb treatment on SL release (upper panel) and mRNA expression (lower panel) in primary cultured tilapia NIL cells. NIL cells were routinely challenged for 24 h with increasing levels of GCGb (0.1–100 nM). (C) Parallel experiment using increasing doses of GCGa as the stimulant. NIL cells were routinely challenged for 24 h with increasing levels of GCGa (0.1–100 nM). (D) Effects of GCG antagonist on GCGb-stimulated SL release in NIL cells. The NIL cells were incubated for 24 h with GCGb (10 nM) in the presence or absence of GCG antagonist (1 µM). All results are expressed as the mean ± SEM (N = 3) and different superscript letters in each column show significant differences (P < 0.05, ANOVA followed by a Bonferroni’s test).
Figure 6
Figure 6
Functional role of AC/cAMP/PKA-dependent mechanisms in SL release and gene expression. (A, B) Effects of activating cAMP-dependent cascades on SL release. NIL cells were treated for 24 h with increasing doses of (A) the AC activator forskolin (0.1–100 nM) or (B) the membrane-permeant cAMP analog 8-Bromo-cAMP (0.1–100 nM). (C) Effects of increasing concentrations of GCGb (0.1–100 nM) on total cAMP production in NIL cells. These data were normalized as a function of cell number (as “picomole cAMP produced/million cells”). (D) Effects of MDL12330A and H89 on GCGb-induced SL release (upper panel) and mRNA expression (lower panel). NIL cells were incubated for 24 h with GCGb (10 nM) in the presence or absence of the AC inhibitor MDL12330A (MDL, 10 µM), or PKA inhibitor H89 (10 µM). All results are expressed as the mean ± SEM (N = 3) and different superscript letters in each column show significant differences (P < 0.05, ANOVA followed by a Bonferroni’s test).
Figure 7
Figure 7
Functional role of PLC/IP3/PKC-dependent mechanisms in SL release and gene expression. (A) Effects of increasing doses of the PLC activator m-3M3FBS (0.01–10 µM) on SL release in NIL cells. (B) Effects of PLC inhibitor U73122 and IP3 receptor antagonist xestospongin C (XeC) on GCGb induction of SL release (upper panel) and gene expression (lower panel). NIL cells were exposed to GCGb (10 nM) for 24 h with or without simultaneous treatment of the PLC inhibitor U73122 (10 µM) and IP3 receptor antagonist XeC (5 µM). (C) Effects of increasing concentrations of GCGb (0.1–100 nM) on IP3 production in NIL cells. (D) Effects of PKC inhibition on GCGb-induced SL release. NIL cells are incubated for 24 h with GCGb (10 nM) in the presence or absence of the PKC inhibitors GF109203X (20 µM) and calphostin C (20 nM). All results are expressed as the mean ± SEM (N = 3) and different superscript letters in each column show significant differences (P < 0.05, ANOVA followed by a Bonferroni’s test).
Figure 8
Figure 8
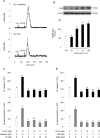
GCGb activation of Ca2+/calmodulin (CaM)-dependent cascades in SL release and gene expression. (A) The effect of GCGb on total Ca2+ signals (upper panel) and [Ca2+]i mobilization signals (lower panel) in tilapia NIL cells. In this case, NIL cells were preloaded with the Ca2+-sensitive dye Fura-2 and treated with GCGb (10 nM) in a normal culture medium (with 2.5 mM CaCl2) or in a Ca2+-free medium supplemented with 0.1 mM EGTA for up to 250 s. (B) The stimulatory effects of GCGb (1–100 nM) on CaM protein levels in the NIL cells, measured by western blot and normalized by the internal control, β-actin (C) Effects of VSCC blockade and [Ca2+]i depletion on GCGb-induced SL release (upper panel) and gene expression (lower panel). The GCGb (10 nM) is applied in the presence or absence of the VSCC blocker nifedipine (5 μM) or the SERCA inhibitor thapsigargin (TG, 50 nM). (D) Effects of CaM-dependent cascades blockade on GCGb-induced SL release (upper panel) and mRNA expression (lower panel). NIL cells are challenged with GCGb (10 nM) for 24 h in the presence or absence of the CaM antagonist calmidazolium (CMZ, 1 μM) or the CaMK-II inhibitor KN62 (5 μM). All results are expressed as the mean ± SEM (N = 3) and different superscript letters in each column show significant differences (P < 0.05, ANOVA followed by a Bonferroni’s test).
Figure 9
Figure 9
Working model of SL regulation by GCGb induction in tilapia NIL cells. GCGRb activation by GCGb can up-regulate SL release and gene expression via stimulation of the AC/cAMP/PKA and PLC/IP3/Ca2+/CaM/CaMK-II cascades.

Similar articles

Cited by

References

    1. Rouille Y, Westermark G, Martin SK, Steiner DF. Proglucagon is processed to glucagon by prohormone convertase PC2 in alpha TC1-6 cells. Proc Natl Acad Sci USA (1994) 91:3242–6. 10.1073/pnas.91.8.3242 - DOI - PMC - PubMed
    1. Scott RV, Bloom SR. Problem or solution: The strange story of glucagon. Peptides (2018) 100:36–41. 10.1016/j.peptides.2017.11.013 - DOI - PMC - PubMed
    1. Zhou L, Irwin DM. Fish proglucagon genes have differing coding potential. Comp Biochem Physiol B Biochem Mol Biol (2004) 137:255–64. 10.1016/j.cbpc.2003.11.009 - DOI - PubMed
    1. Nelson LE, Sheridan MA. Gastroenteropancreatic hormones and metabolism in fish. Gen Comp Endocrinol (2006) 148:116–24. 10.1016/j.ygcen.2006.01.011 - DOI - PubMed
    1. Harmon JS, Sheridan MA. Effects of nutritional state, insulin, and glucagon on lipid mobilization in rainbow trout, Oncorhynchus mykiss. Gen Comp Endocrinol (1992) 87:214–21. 10.1016/0016-6480(92)90025-F - DOI - PubMed

Publication types

LinkOut - more resources