. 2021 Feb 4:11:603455.
doi: 10.3389/fgene.2020.603455. eCollection 2020.

Identification of a Metastasis-Associated Gene Signature of Clear Cell Renal Cell Carcinoma

Affiliations

Identification of a Metastasis-Associated Gene Signature of Clear Cell Renal Cell Carcinoma

Suhua Gao et al. Front Genet. .

Abstract

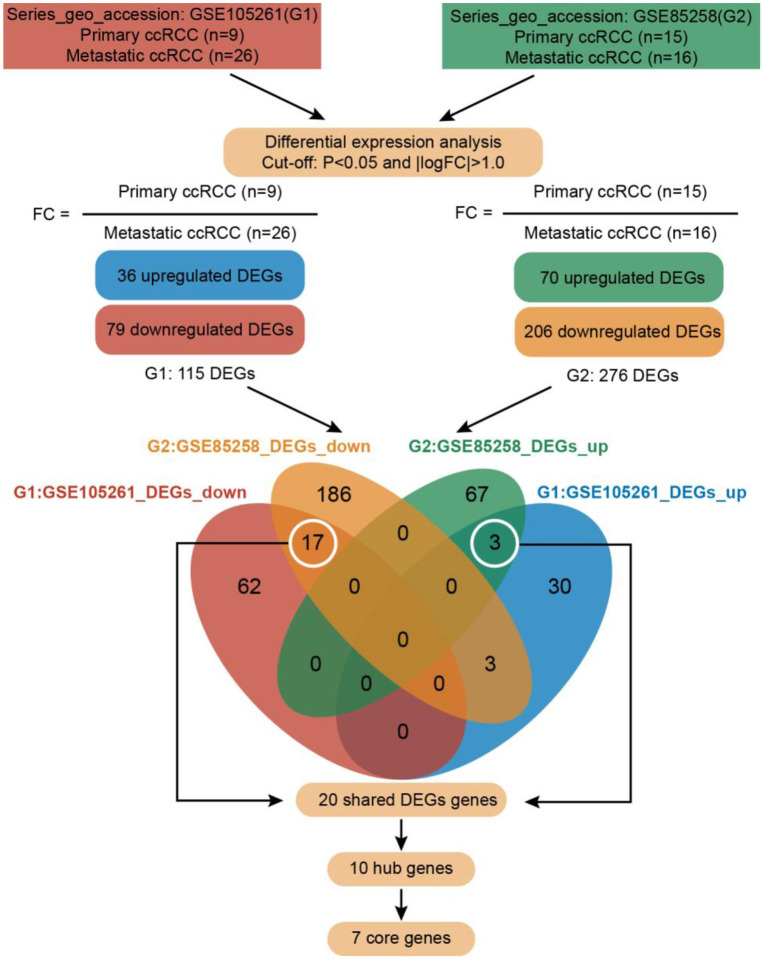
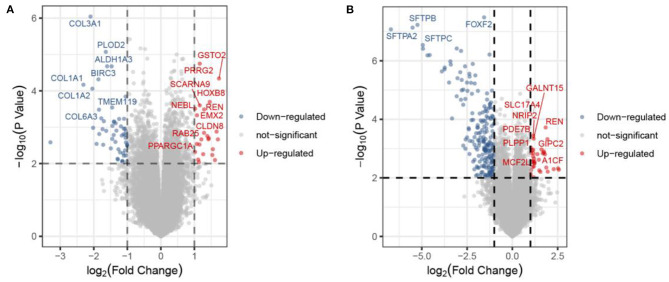
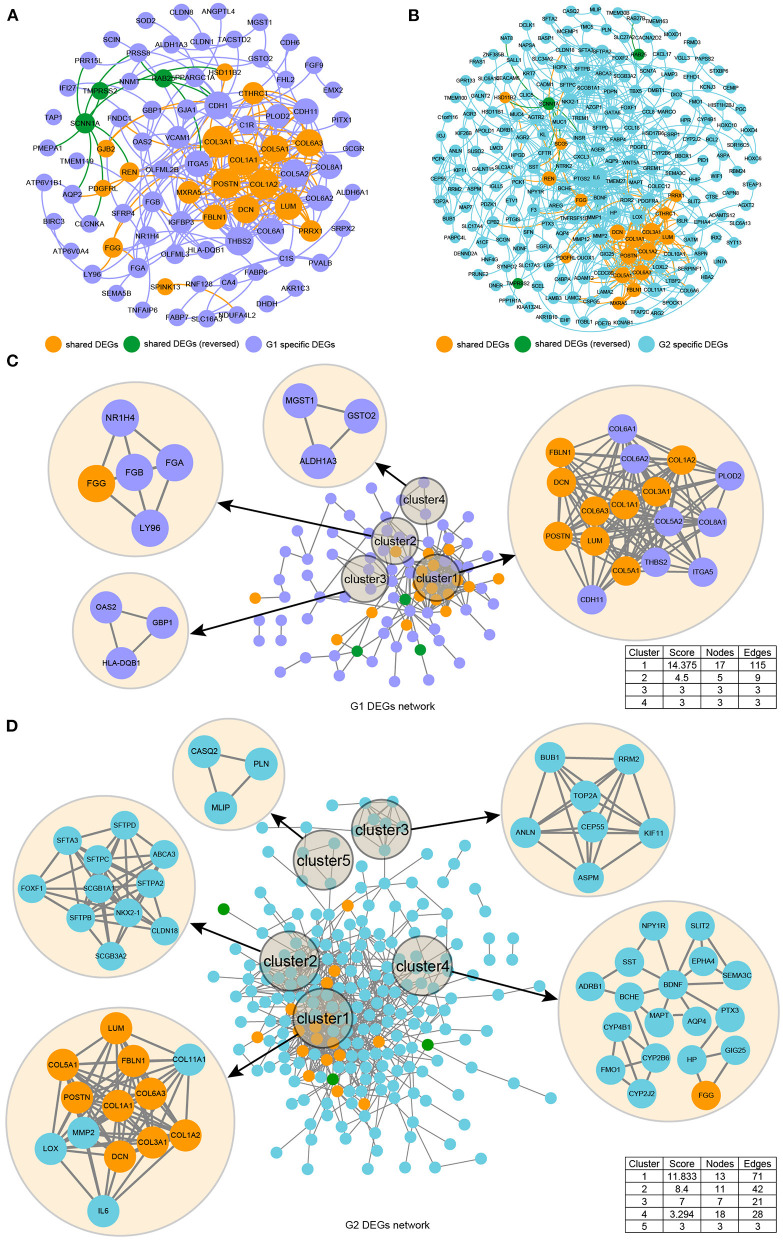
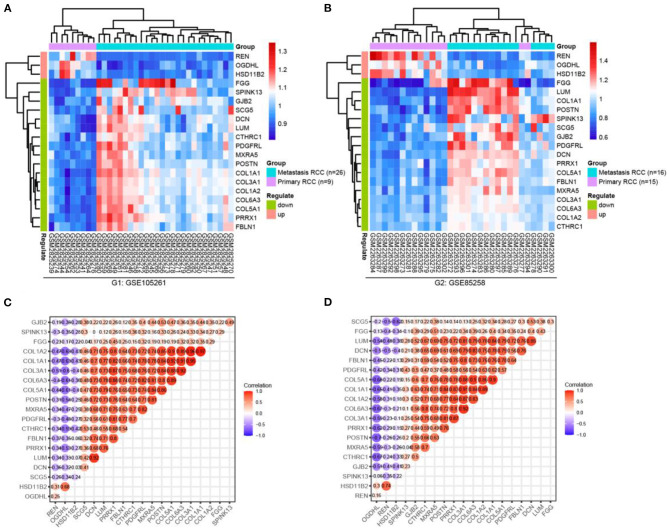
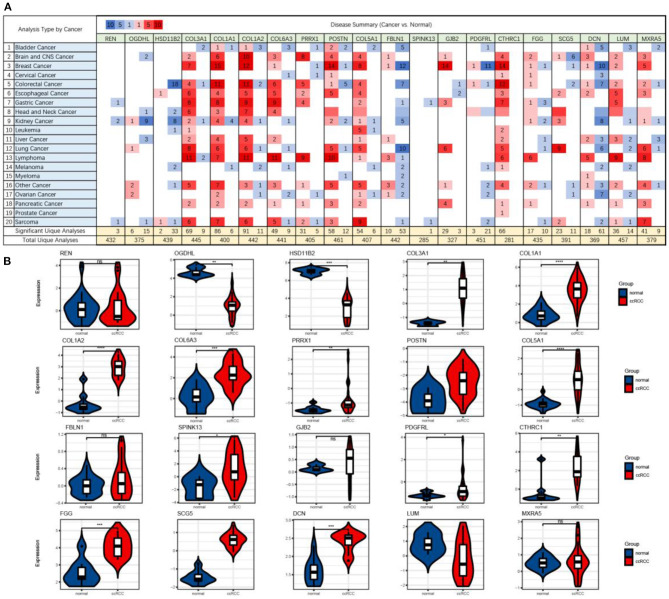
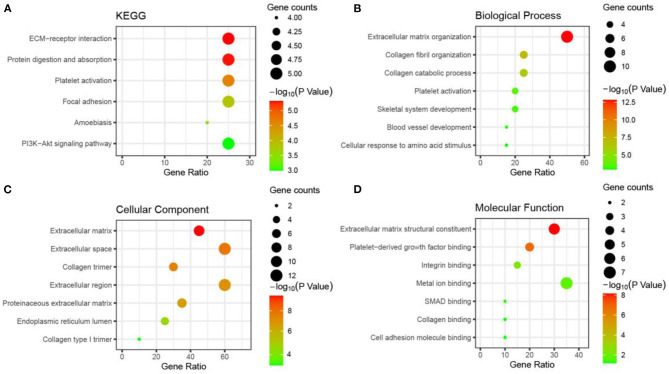
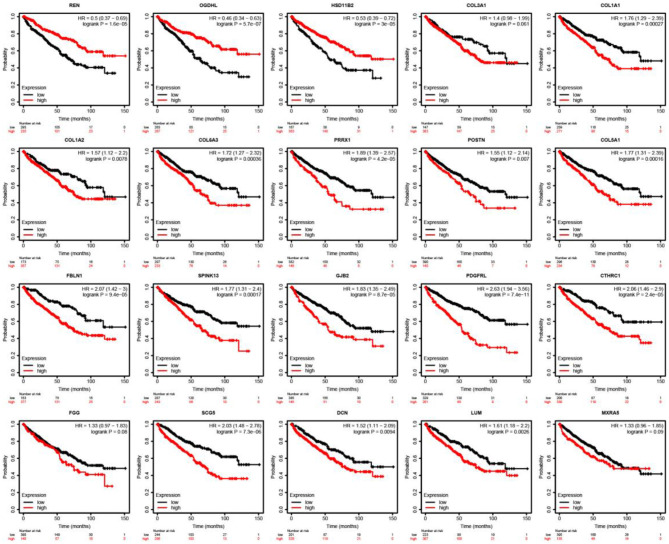
Clear cell renal cell carcinoma (ccRCC) is one of the most frequent pathological subtypes of kidney cancer, accounting for ~70-75%, and the major cause of mortality is metastatic disease. The difference in gene expression profiles between primary ccRCC tumors and metastatic tumors has not been determined. Thus, we report integrated genomic and transcriptomic analysis for identifying differentially expressed genes (DEGs) between primary and metastatic ccRCC tumors to understand the molecular mechanisms underlying the development of metastases. The microarray datasets GSE105261 and GSE85258 were obtained from the Gene Expression Omnibus (GEO) database, and the R package limma was used for DEG analyses. In summary, the results described herein provide important molecular evidence that metastatic ccRCC tumors are different from primary tumors. Enrichment analysis indicated that the DEGs were mainly enriched in ECM-receptor interaction, platelet activation, protein digestion, absorption, focal adhesion, and the PI3K-Akt signaling pathway. Moreover, we found that DEGs associated with a higher level of tumor immune infiltrates and tumor mutation burden were more susceptible to poor prognosis of ccRCC. Specifically, our study indicates that seven core genes, namely the collagen family (COL1A2, COL1A1, COL6A3, and COL5A1), DCN, FBLN1, and POSTN, were significantly upregulated in metastatic tumors compared with those in primary tumors and, thus, potentially offer insight into novel therapeutic and early diagnostic biomarkers of ccRCC.

Keywords: biomarker; clear cell renal cell carcinoma; immune infiltration; metastasis; tumor mutation burden.


Conflict of interest statement

The authors declare that the research was conducted in the absence of any commercial or financial relationships that could be construed as a potential conflict of interest.

Figures

Figure 1
Figure 1
Roadmap of the approach and summarized findings.
Figure 2
Figure 2
Volcano plot of the DEGs in the primary ccRCC group compared with the metastatic ccRCC group from the GSE105261 (A) and GSE85258 (B) datasets. Each point corresponds to one gene.
Figure 3
Figure 3
Illustration of the protein networks of DEGs from the GSE105261 (G1) and GSE85258 (G2) datasets. The spatial distribution characteristics of the PPI network model of G1 (A) and G2 (B) based on a macro perspective were constructed by the “Fruchterman–Reingold” layout in the Gephi software. The spatial distribution characteristics of the PPI network model of G1 (C) and G2 (D) based on independent perspectives were constructed by the MCODE plugin of Cytoscape software.
Figure 4
Figure 4
Hierarchical clustering analysis and expression correlation calculation of mRNA expression of shared DEGs, which were compared primarily with the metastatic ccRCC group in the GSE105261 (A,C) and GSE85258 (B,D) datasets.
Figure 5
Figure 5
The mRNA expression levels (cancer vs. normal) of shared DEGs in multiple cancer types (A) and ccRCC (B), which were based on ONCOMINE. The figure shows the numbers of datasets with statistically significant upregulated (red) and downregulated (blue) mRNA expression.
Figure 6
Figure 6
Gene ontology and KEGG pathway enrichment bubble diagram for shared DEGs (showing the first seven items).
Figure 7
Figure 7
The frequency of genetic alterations (including mutations, amplifications, deletions, and fusions associated with clinical parameters) of shared DEGs was evaluated through ccRCC studies using cBioPortal. Stacked plots show mutational burden (histogram, top), mutations in shared DEGs (tile plot, middle), and mutational marks (bottom) (A). Overall description and cancer type summary of the selected sample (B). The histogram combined with the dotted-line graph shows the overlap of samples (patients) (C). Box plots display shared DEG mutation counts based on the Kruskal–Wallis test (p = 0.0140) (D). HSD11B2, POSTN, GJB2, SCG5, and LUM completely overlapped with other selected groups and were excluded from the analyses in other tabs.
Figure 8
Figure 8
Outcomes associated with mutation and immune infiltrates were illustrated in patients with ccRCC. Kaplan-Meier survival curves with the log-rank test and hazard ratio (HR) for overall survival are shown.
Figure 9
Figure 9
Association of core gene expression in ccRCC with immune infiltrates. Partial correlation analysis of gene expression and tumor immune infiltrate levels (B cells, CD8+ T cells, CD4+ T cells, macrophages, neutrophils, and dendritic cells).

References

    1. Alcaraz-Sanabria A., Baliu-Piqué M., Saiz-Ladera C., Rojas K., Manzano A., Marquina G., et al. . (2020). Genomic signatures of immune activation predict outcome in advanced stages of ovarian cancer and Basal-Like breast tumors. Front. Oncol. 9:1486. 10.3389/fonc.2019.01486 - DOI - PMC - PubMed
    1. Alexi X., Berditchevski F., Odintsova E. (2011). The effect of cell-ECM adhesion on signalling via the ErbB family of growth factor receptors. Biochem. Soc. Trans. 39, 568–573. 10.1042/BST0390568 - DOI - PubMed
    1. Aoun F., Rassy E. E., Assi T., Albisinni S., Katan J. (2017). Advances in urothelial bladder cancer immunotherapy, dawn of a new age of treatment. Immunotherapy 9, 451–460. 10.2217/imt-2017-0007 - DOI - PubMed
    1. Assenov Y., Ramirez F., Schelhorn S., Lengauer T., Albrecht M. (2008). Computing topological parameters of biological networks. Bioinformatics 24, 282–284. 10.1093/bioinformatics/btm554 - DOI - PubMed
    1. Bakker J., Spits M., Neefjes J., Berlin I. (2017). The EGFR odyssey–from activation to destruction in space and time. J. Cell Ence 130, 4087–4096. 10.1242/jcs.209197 - DOI - PubMed

LinkOut - more resources