. 2021 Feb 4:2021:1246491.
doi: 10.1155/2021/1246491. eCollection 2021.

Anthocyanins from Hibiscus syriacus L. Inhibit NLRP3 Inflammasome in BV2 Microglia Cells by Alleviating NF- κ B- and ER Stress-Induced Ca2+ Accumulation and Mitochondrial ROS Production

Affiliations

Anthocyanins from Hibiscus syriacus L. Inhibit NLRP3 Inflammasome in BV2 Microglia Cells by Alleviating NF- κ B- and ER Stress-Induced Ca2+ Accumulation and Mitochondrial ROS Production

Ilandarage Menu Neelaka Molagoda et al. Oxid Med Cell Longev. .

Abstract

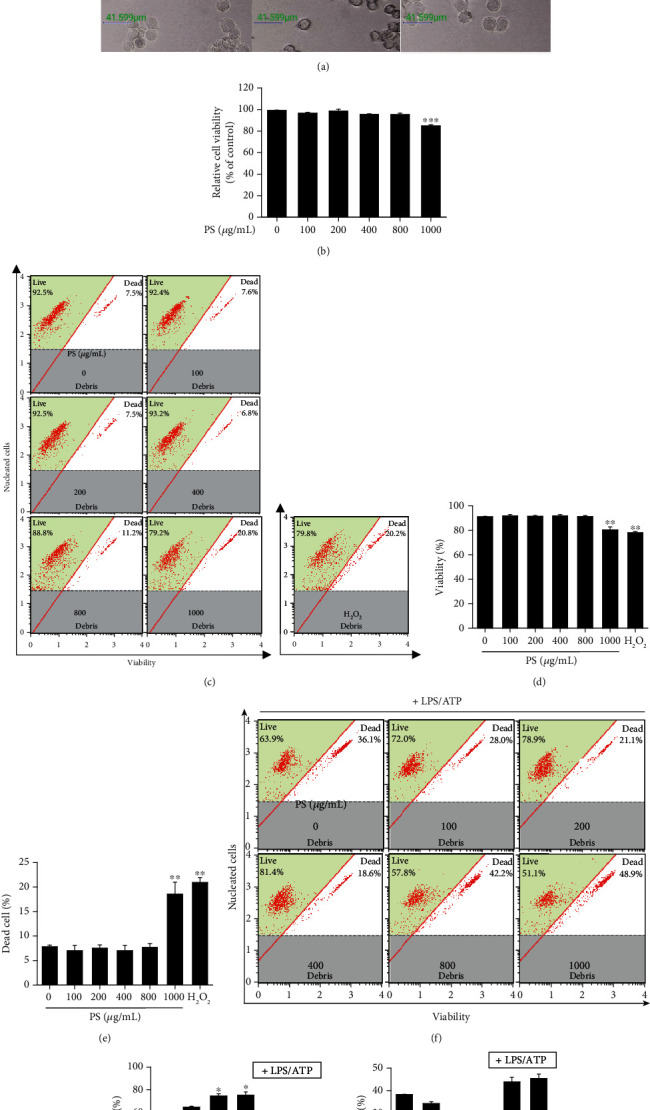
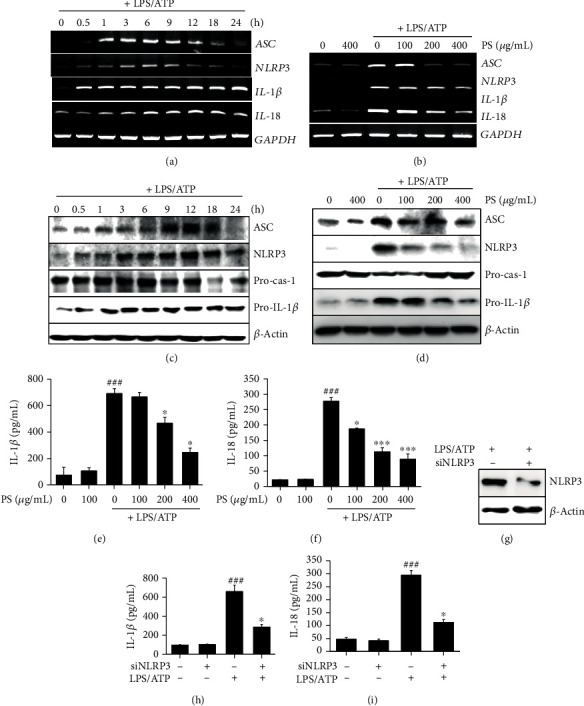
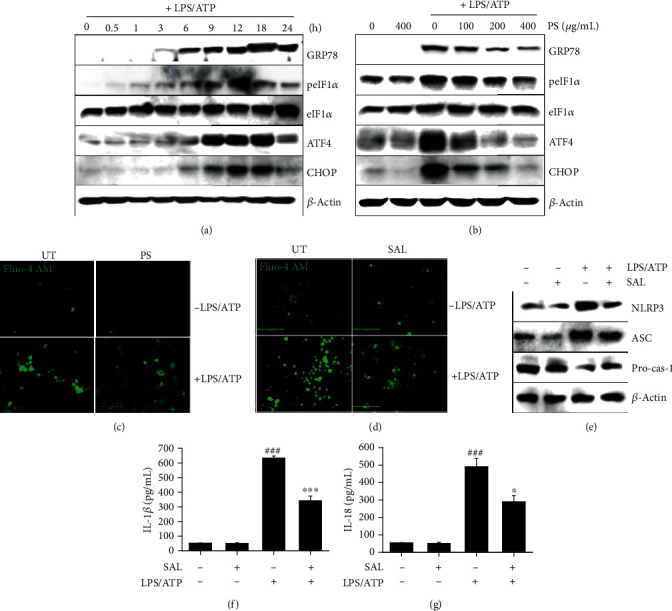
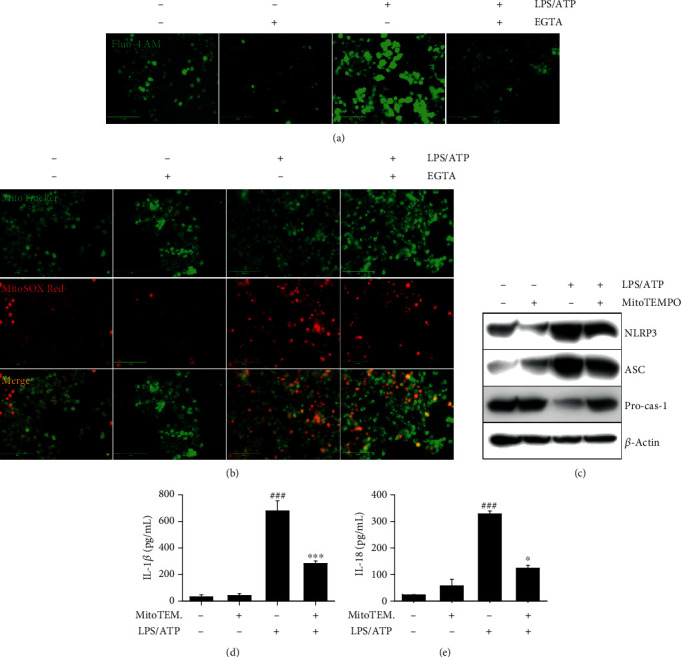
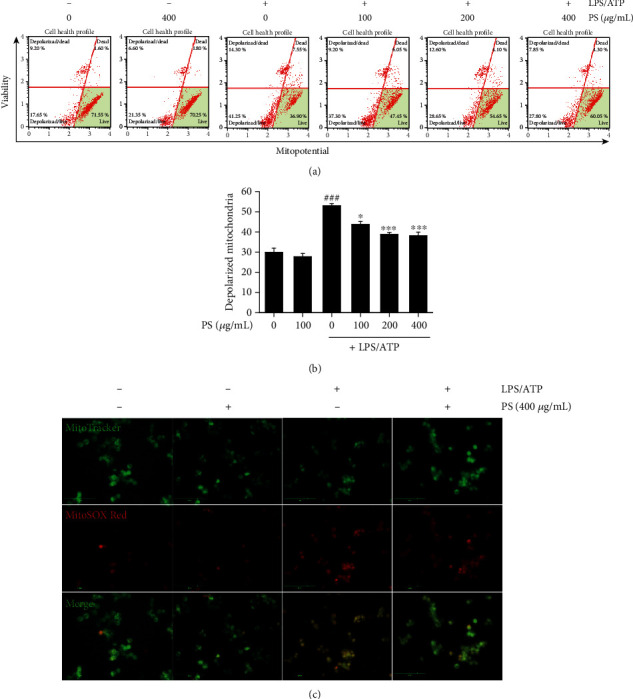
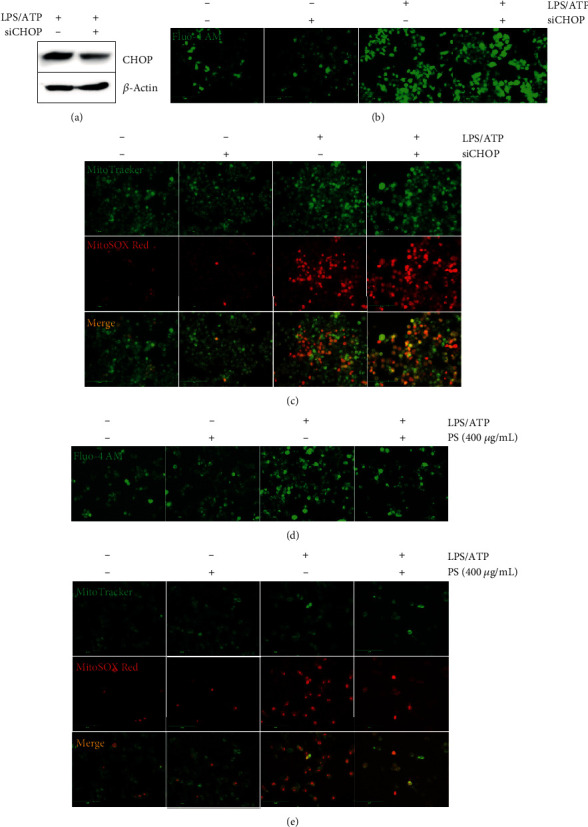
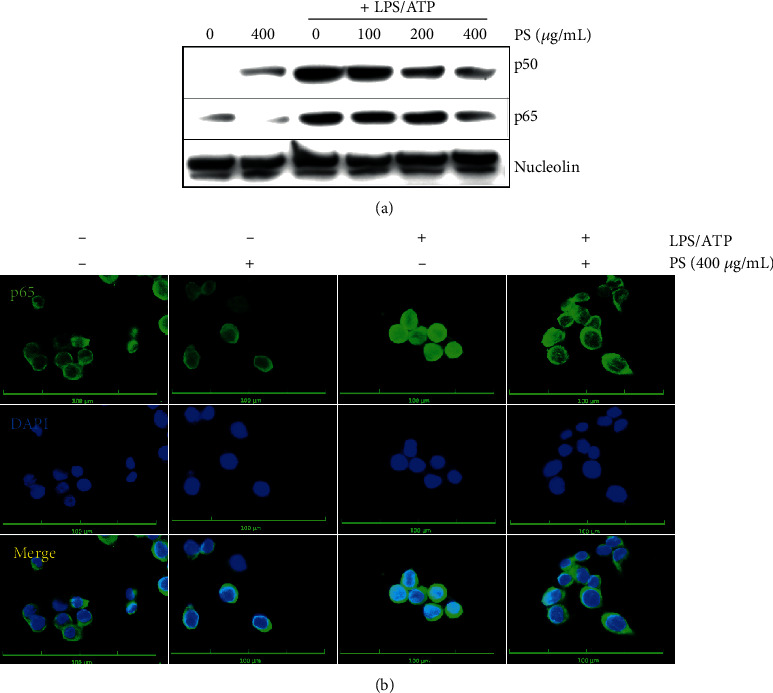
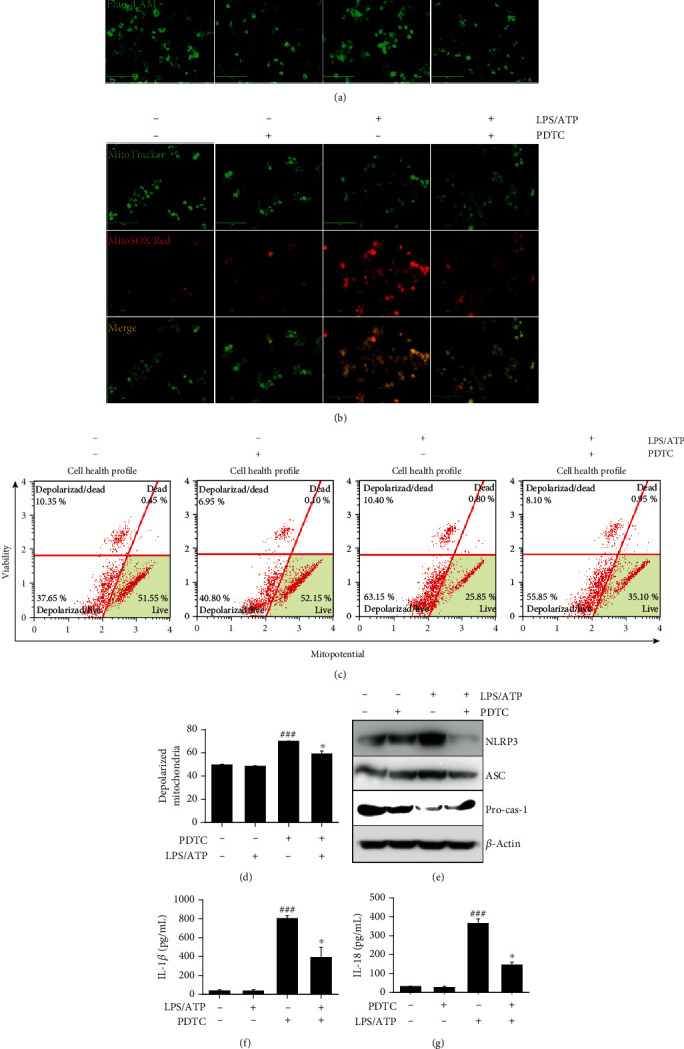
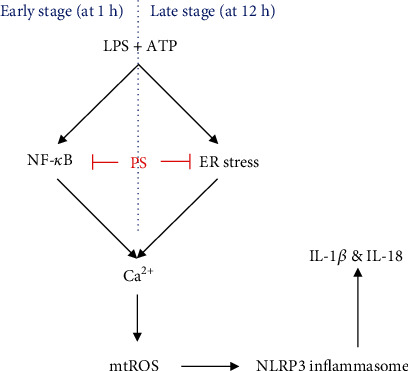
Anthocyanins from the petals of Hibiscus syriacus L. (PS) possess anti-inflammatory, antioxidant, and antimelanogenic activities. However, it remains unclear whether PS inhibit the NLR family pyrin domain-containing 3 (NLRP3) inflammasome activation and assembly. This study is aimed at investigating whether PS downregulate NLRP3-mediated inflammasome by inhibiting nuclear factor-κB (NF-κB) and endoplasmic reticulum (ER) stress. BV2 microglia cells were treated with PS in the presence of lipopolysaccharide and adenosine triphosphate (LPS/ATP), and the NLRP3-related signaling pathway was investigated. In this study, we found that LPS/ATP treatment activated the NLRP3 inflammasome, which resulted in the release of interleukin-1β (IL-1β) and IL-18. Meanwhile, PS reduced LPS/ATP-mediated NLRP3 inflammasome at 12 h by inhibiting ER stress-mediated Ca2+ accumulation and subsequent mitochondrial reactive oxygen species (mtROS) production, which, in turn, decreased IL-1β and IL-18 release. Furthermore, PS inhibited the NLRP3 inflammasome 1 h after LPS/ATP treatment by suppressing the NF-κB pathway, which downregulated Ca2+ accumulation and mtROS production. These data showed that PS negatively regulated activation of the NLRP3 inflammasome in a time-different manner by inhibiting the NF-κB signaling pathway in the early stage and the ER stress response in the late stage. The pathways shared Ca2+ accumulation-mediated mtROS production, which was significantly inhibited in the presence of PS. In conclusion, our results suggested that PS has potential as a supplement against NLRP3 inflammasome-related inflammatory disorders; nevertheless, further studies are needed to determine the effect of PS in the noncanonical NLRP3 inflammasome pathways and pathological conditions in vivo.


Conflict of interest statement

The authors declare no conflict of interests.

Figures

Figure 1
Figure 1
PS protect BV2 microglia cells from LPS/ATP-induced cell death. BV2 microglia cells were treated with the indicated concentrations (0–1000 μg/mL) of PS for 24 h. (a) Cell morphology was observed using phase contrast microscopy (×10). Scale bars = 40 μm. (b) Relative cell viability was measured using an MTT assay. (c) Cell viability and dead cell population were measured using a Muse Cell Viability Kit. Hydrogen peroxide (H2O2, 100 μM) was used as a positive control. Percentage of (d) viable and (e) dead cells was shown. (f–h) In a parallel experiment, the cells were pretreated with the indicated concentrations of PS (0–1000 μg/mL) for 2 h. After LPS/ATP treatment for 24 h, (f) viable and dead cell populations were measured using a Muse Cell Viability Kit. Percentage of (g) viable and (h) dead cells was shown. ∗∗∗p < 0.001 and ∗∗p < 0.01 vs. untreated cells; p < 0.05 vs. LPS/ATP-treated cells.
Figure 2
Figure 2
PS inhibit NLRP3 inflammasome-induced IL-1β and IL-18 release. (a) BV2 microglia cells were stimulated with LPS/ATP. Total mRNA was isolated at the indicated time points, and RT-PCR was performed. (b) The indicated concentrations of PS (0–400 μg/mL) were pretreated for 2 h prior to stimulation with LPS/ATP. Total mRNA was isolated at 6 h, and RT-PCR was performed. GAPDH was used as the loading control. (c) In a parallel experiment, total proteins were isolated at the indicated time points after LPS/ATP treatment, and western blotting was performed. (d) Total proteins were also isolated 12 h after LPS/ATP treatment, and western blotting was performed. Cell culture medium was collected at 48 h, and ELISA was performed to quantify the concentrations of (e) IL-1β and (f) IL-18. (g–i) In a parallel experiment, BV2 microglia cells were transfected with siNLRP3 for 48 h and stimulated with LPS/ATP. (g) Transfection efficiency was confirmed by western blotting. Cell culture medium was collected at 48 h, and ELISA was performed to quantify the concentrations of (h) IL-1β and (i) IL-18. ###p < 0.001 vs. untreated cells; ∗∗∗p < 0.001 and p < 0.05 vs. LPS/ATP-treated cells.
Figure 3
Figure 3
PS inhibit the LPS/ATP-induced NLRP3 inflammasome by downregulating ER stress-induced Ca2+ accumulation. (a) BV2 microglia cells were stimulated with LPS/ATP. Total proteins were isolated, and western blotting was performed. (b) In a parallel experiment, the cells were pretreated with the indicated concentrations of PS (0–400 μg/mL) for 2 h prior to stimulation with LPS/ATP for 12 h. Total protein was extracted, and western blotting was performed. BV2 microglia cells were pretreated with (c) PS (400 μg/mL) and (d) salubrinal (SAL, 10 μM) for 2 h prior to stimulation with LPS/ATP for 12 h. The cells were stained with 1 μM Fluo-4 AM, and cell images were captured using CELENA S Digital Imaging System. (e) Under SAL-treated conditions, the total protein was isolated at 12 h, and western blotting was performed. Cell culture supernatants were collected 48 h after treatment with LPS/ATP, and ELISA was performed to quantify the levels of (f) IL-1β and (g) IL-18. ###p < 0.001 vs. untreated cells; ∗∗∗p < 0.001 and p < 0.05 vs. LPS/ATP-treated cells. UT: untreated cells.
Figure 4
Figure 4
LPS/ATP-induced intracellular Ca2+ accumulation activates the NLRP3 inflammasome through mtROS production. BV2 microglia cells were pretreated with 2 mM EGTA for 2 h prior to stimulation with LPS/ATP for 12 h. The cells were stained with (a) 1 μM Fluo-4 AM and (b) 0.5 μM MitoTracker Green and 2 μM MitoSOX Red. Cell images were captured by CELENA S Digital Imaging System. (c) The cells were pretreated with 50 μM MitoTEMPO for 2 h prior to stimulation with LPS/ATP. Total protein was isolated at 12 h, and western blotting was performed. Cell culture supernatants were collected at 48 h, and ELISA was performed to quantify the levels of (d) IL-1β and (e) IL-18. ∗∗∗p < 0.001 and p < 0.05 vs. untreated cells; ###p < 0.001 vs. LPS/ATP-treated cells.
Figure 5
Figure 5
PS decrease mtROS production by stabilizing mitochondrial membrane integrity. (a) BV2 microglia cells were pretreated with the indicated concentrations of PS (0–400 μg/mL) for 2 h prior to stimulation with LPS/ATP for 12 h. (a) Mitochondrial membrane depolarized cell populations were measured using a Muse MitoPotential Kit. (b) Total populations of mitochondrial membrane depolarized cells were represented. (c) In a parallel experiment, the cells were stained with 0.5 μM MitoTracker Green and 2 μM MitoSOX Red, and cell images were captured by CELENA S Digital Imaging System. ###p < 0.001 vs. untreated cells; ∗∗∗p < 0.001 and p < 0.05 vs. LPS/ATP-treated cells.
Figure 6
Figure 6
PS inhibit NLRP3 inflammasome in the early stage, independently from ER stress. BV2 microglia cells were transiently transfected with CHOP siRNA for 48 h and treated with LPS/ATP. (a) Transfection efficiency was shown by western blotting after LPS/ATP treatment. The cells were treated with LPS/ATP for 1 h and stained with (b) Fluo-4 AM and (c) 0.5 μM MitoTracker Green and with 2 μM MitoSOX Red. In a parallel experiment, BV2 microglia cells were pretreated with 400 μg/mL PS for 2 h prior to stimulation with LPS/ATP for 1 h. The cells were stained with (d) 1 μM Fluo-4 AM and (e) 0.5 μM MitoTracker Green and 2 μM MitoSOX Red. Cell images were captured using CELENA S Digital Imaging System.
Figure 7
Figure 7
PS inhibit nuclear translocation of NF-κB. BV2 microglia cells were pretreated with the indicated concentrations of PS for 2 h prior to LPS/ATP. (a) Nuclear proteins were extracted at 1 h, and western blotting was performed. (b) In a parallel experiment, the cells were immunostained using NF-κB p65 antibody conjugated with Alexa Fluor 488. Cell images were captured by CELENA S Digital Imaging System.
Figure 8
Figure 8
The NF-κB signaling pathway activates LPS/ATP-induced NLRP3 formation and subsequent IL-1β and IL-18 release in the early stage. (a) BV2 microglia cells were pretreated with 10 μM PDTC for 2 h prior to stimulation with LPS/ATP for 1 h. The cells were stained with (a) 1 μM Fluo-4 AM and (b) 0.5 μM MitoTracker Green and 2 μM MitoSOX Red. Cell images were captured by CELENA S Digital Imaging System. (c) In a parallel experiment, mitochondrial membrane depolarization was measured using a Muse MitoPotential Kit. (d) The total populations of mitochondrial membrane depolarized cells were shown. (e) Total proteins were isolated at 12 h, and western blotting was performed. Cell culture supernatant was collected at 48 h, and ELISA was performed to quantify the levels of (e) IL-1β and (f) IL-18. ###p < 0.001 vs. untreated cells; p < 0.05 vs. LPS/ATP-treated cells. PDTC: pyrrolidine dithiocarbamate.
Figure 9
Figure 9
PS inhibit the NLRP3 inflammasome through two different pathways. To activate the NLRP3 inflammasome, NF-κB was stimulated in the early stage (1 h after treatment with LPS/ATP) and ER stress was stimulated in the late stage (12 h after treatment with LPS/ATP); both pathways enhanced Ca2+ accumulation and the subsequent mtROS generation, which lead to IL-1β and IL-18 release. PS inhibited the NF-κB signaling pathway in the early stage and downregulated ER stress in the late stage, which reduced intracellular Ca2+-mediated mtROS production and subsequently inhibited NLRP3 inflammasome-induced IL-1β and IL-18 release. NLRP3: NOD, LRR, and pyrin domain-containing protein 3; NF-κB: nuclear factor-κB; ER: endoplasmic reticulum; mtROS: mitochondrial reactive oxygen species.

Similar articles

Cited by

References

    1. Latz E., Xiao T. S., Stutz A. Activation and regulation of the inflammasomes. Nature Reviews Immunology. 2013;13(6):397–411. doi: 10.1038/nri3452. - DOI - PMC - PubMed
    1. Jo E.-K., Kim J. K., Shin D. M., Sasakawa C. Molecular mechanisms regulating NLRP3 inflammasome activation. Cellular & Molecular Immunology. 2016;13(2):148–159. doi: 10.1038/cmi.2015.95. - DOI - PMC - PubMed
    1. Mangan M. S. J., Olhava E. J., Roush W. R., Seidel H. M., Glick G. D., Latz E. Targeting the NLRP3 inflammasome in inflammatory diseases. Nature Reviews Drug Discovery. 2018;17(8):588–606. doi: 10.1038/nrd.2018.97. - DOI - PubMed
    1. Wang Z., Hu W., Lu C., et al. Targeting NLRP3 (nucleotide-binding domain, leucine-rich–containing family, pyrin domain–containing-3) inflammasome in cardiovascular disorders. Arteriosclerosis, Thrombosis, and Vascular Biology. 2018;38(12):2765–2779. doi: 10.1161/ATVBAHA.118.311916. - DOI - PubMed
    1. Kelley N., Jeltema D., Duan Y., He Y. The NLRP3 inflammasome: an overview of mechanisms of activation and regulation. International Journal of Molecular Sciences. 2019;20(13):p. 3328. doi: 10.3390/ijms20133328. - DOI - PMC - PubMed

MeSH terms

LinkOut - more resources