

Methamphetamine use alters human plasma extracellular vesicles and their microRNA cargo: An exploratory study
- PMID: 33613872
- PMCID: PMC7890470
- DOI: 10.1002/jev2.12028
Methamphetamine use alters human plasma extracellular vesicles and their microRNA cargo: An exploratory study
Abstract
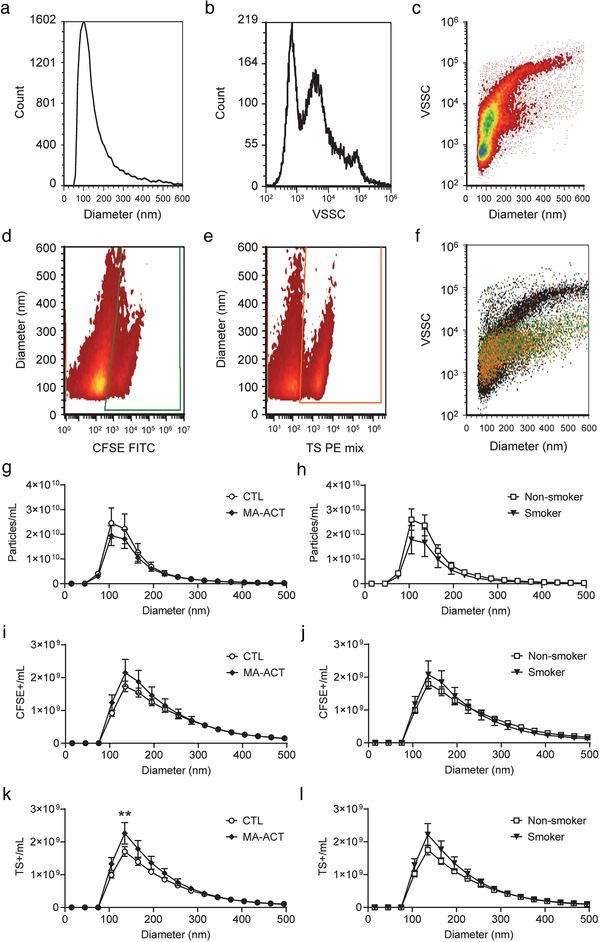
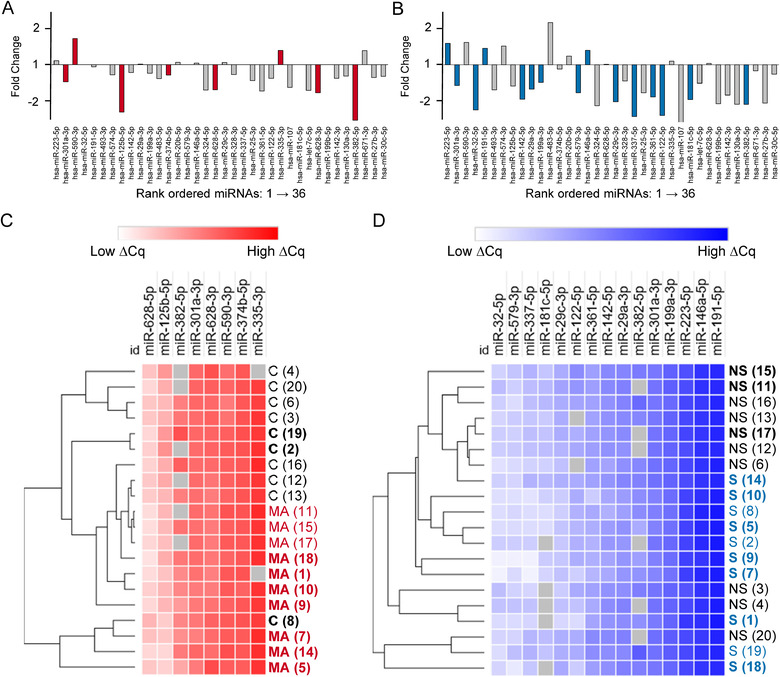
Methamphetamine (MA) is the largest drug threat across the globe, with health effects including neurotoxicity and cardiovascular disease. Recent studies have begun to link microRNAs (miRNAs) to the processes related to MA use and addiction. Our studies are the first to analyse plasma EVs and their miRNA cargo in humans actively using MA (MA-ACT) and control participants (CTL). In this cohort we also assessed the effects of tobacco use on plasma EVs. We used vesicle flow cytometry to show that the MA-ACT group had an increased abundance of EV tetraspanin markers (CD9, CD63, CD81), but not pro-coagulant, platelet-, and red blood cell-derived EVs. We also found that of the 169 plasma EV miRNAs, eight were of interest in MA-ACT based on multiple statistical criteria. In smokers, we identified 15 miRNAs of interest, two that overlapped with the eight MA-ACT miRNAs. Three of the MA-ACT miRNAs significantly correlated with clinical features of MA use and target prediction with these miRNAs identified pathways implicated in MA use, including cardiovascular disease and neuroinflammation. Together our findings indicate that MA use regulates EVs and their miRNA cargo, and support that further studies are warranted to investigate their mechanistic role in addiction, recovery, and recidivism.
Keywords: addiction; extracellular vesicle; methamphetamine; microRNA; plasma; tobacco; vesicle flow cytometry.
© 2020 The Authors. Journal of Extracellular Vesicles published by Wiley Periodicals, LLC on behalf of the International Society for Extracellular Vesicles.
Conflict of interest statement
John P. Nolan and Erika Duggan are inventors on patents related to vesicle analysis and have interests in Cellarcus Biosciences. All other authors report no conflicts of interest.
Figures


Similar articles
-
Decreased Expression of Plasma MicroRNA in Patients with Methamphetamine (MA) Use Disorder.J Neuroimmune Pharmacol. 2016 Sep;11(3):542-8. doi: 10.1007/s11481-016-9671-z. Epub 2016 Apr 23. J Neuroimmune Pharmacol. 2016. PMID: 27108111
-
Altered serum microRNA expression profile in subjects with heroin and methamphetamine use disorder.Biomed Pharmacother. 2020 May;125:109918. doi: 10.1016/j.biopha.2020.109918. Epub 2020 Feb 6. Biomed Pharmacother. 2020. PMID: 32036213
-
Detection of circulating miRNAs: comparative analysis of extracellular vesicle-incorporated miRNAs and cell-free miRNAs in whole plasma of prostate cancer patients.BMC Cancer. 2017 Nov 9;17(1):730. doi: 10.1186/s12885-017-3737-z. BMC Cancer. 2017. PMID: 29121858 Free PMC article.
-
Role of Extracellular Vesicles in Substance Abuse and HIV-Related Neurological Pathologies.Int J Mol Sci. 2020 Sep 15;21(18):6765. doi: 10.3390/ijms21186765. Int J Mol Sci. 2020. PMID: 32942668 Free PMC article. Review.
-
Circulating miRNAs as Biomarkers in Aggressive B Cell Lymphomas.Trends Cancer. 2020 Nov;6(11):910-923. doi: 10.1016/j.trecan.2020.06.003. Epub 2020 Jul 11. Trends Cancer. 2020. PMID: 32660885 Review.
Cited by
-
Extracellular Vesicle-Encapsulated miR-183-5p from Rhynchophylline-Treated H9c2 Cells Protect against Methamphetamine-Induced Dependence in Mouse Brain by Targeting NRG1.Evid Based Complement Alternat Med. 2021 Aug 26;2021:2136076. doi: 10.1155/2021/2136076. eCollection 2021. Evid Based Complement Alternat Med. 2021. PMID: 34484386 Free PMC article.
-
Uncovering transcriptomic biomarkers for enhanced diagnosis of methamphetamine use disorder: a comprehensive review.Front Psychiatry. 2024 Jan 8;14:1302994. doi: 10.3389/fpsyt.2023.1302994. eCollection 2023. Front Psychiatry. 2024. PMID: 38260797 Free PMC article.
-
HIV-infection and cocaine use regulate semen extracellular vesicles proteome and miRNAome in a manner that mediates strategic monocyte haptotaxis governed by miR-128 network.Cell Mol Life Sci. 2021 Dec 22;79(1):5. doi: 10.1007/s00018-021-04068-2. Cell Mol Life Sci. 2021. PMID: 34936021 Free PMC article.
-
The Common Denominators of Parkinson's Disease Pathogenesis and Methamphetamine Abuse.Curr Neuropharmacol. 2024;22(13):2113-2156. doi: 10.2174/1570159X21666230907151226. Curr Neuropharmacol. 2024. PMID: 37691228 Free PMC article. Review.
-
Toward a better understanding of inflammatory microvesicles in alcohol use disorder.J Neurosci Res. 2021 Oct;99(10):2364-2366. doi: 10.1002/jnr.24930. Epub 2021 Jul 22. J Neurosci Res. 2021. PMID: 34292625 Free PMC article. Review. No abstract available.
References
-
- American Psychiatric Association , Diagnostic and statistical manual of mental disorders: DSM‐IV‐TR. (4th ed., text revision. ed). (2000)., Washington, DC: American Psychiatric Association; 10.1002/9780470479216.corpsy0271. - DOI
-
- Benedikter, B. J. , Wouters, E. F. M. , Savelkoul, P. H. M. , Rohde, G. G. U. , & Stassen, F. R. M. (2018). Extracellular vesicles released in response to respiratory exposures: Implications for chronic disease. Journal of Toxicology and Environmental Health. Part B, Critical Reviews, 21(3), 142–160. - PubMed
-
- Biagioni, F. , Ferese, R. , Limanaqi, F. , Madonna, M. , Lenzi, P. , Gambardella, S. , & Fornai, F. (2019). Methamphetamine persistently increases alpha‐synuclein and suppresses gene promoter methylation within striatal neurons. Brain Research, 1719, 157–175. - PubMed
Publication types
MeSH terms
Substances
Grants and funding
LinkOut - more resources
Full Text Sources
Medical
Miscellaneous
