

Tuning intrinsic disorder predictors for virus proteins
- PMID: 33614158
- PMCID: PMC7882063
- DOI: 10.1093/ve/veaa106
Tuning intrinsic disorder predictors for virus proteins
Abstract
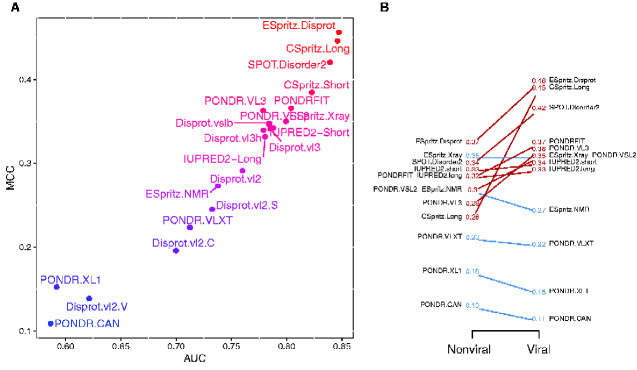
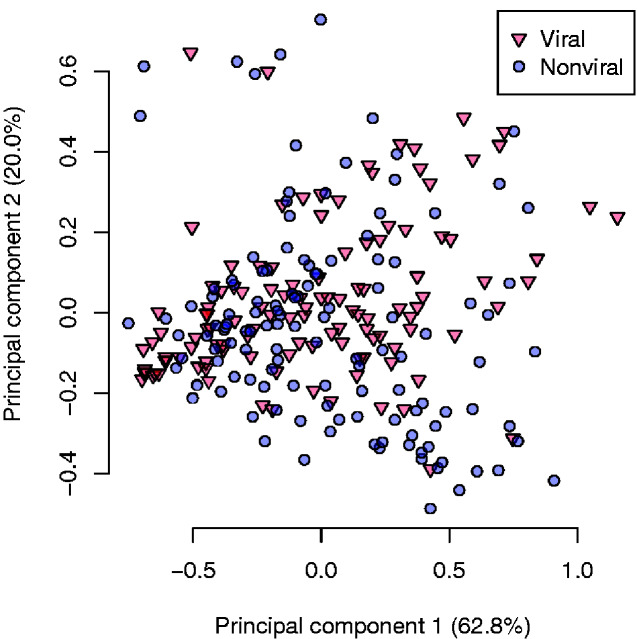
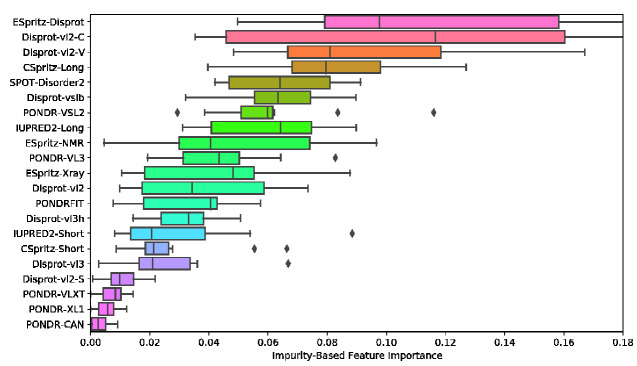
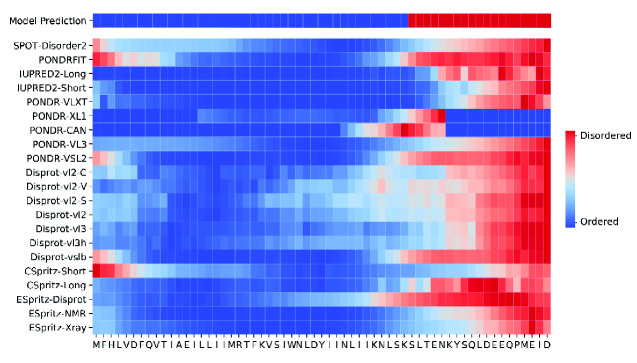
Many virus-encoded proteins have intrinsically disordered regions that lack a stable, folded three-dimensional structure. These disordered proteins often play important functional roles in virus replication, such as down-regulating host defense mechanisms. With the widespread availability of next-generation sequencing, the number of new virus genomes with predicted open reading frames is rapidly outpacing our capacity for directly characterizing protein structures through crystallography. Hence, computational methods for structural prediction play an important role. A large number of predictors focus on the problem of classifying residues into ordered and disordered regions, and these methods tend to be validated on a diverse training set of proteins from eukaryotes, prokaryotes, and viruses. In this study, we investigate whether some predictors outperform others in the context of virus proteins and compared our findings with data from non-viral proteins. We evaluate the prediction accuracy of 21 methods, many of which are only available as web applications, on a curated set of 126 proteins encoded by viruses. Furthermore, we apply a random forest classifier to these predictor outputs. Based on cross-validation experiments, this ensemble approach confers a substantial improvement in accuracy, e.g., a mean 36 per cent gain in Matthews correlation coefficient. Lastly, we apply the random forest predictor to severe acute respiratory syndrome coronavirus 2 ORF6, an accessory gene that encodes a short (61 AA) and moderately disordered protein that inhibits the host innate immune response. We show that disorder prediction methods perform differently for viral and non-viral proteins, and that an ensemble approach can yield more robust and accurate predictions.
Keywords: ensemble classifier; intrinsically disordered proteins; machine learning; protein disorder prediction; virus proteins.
© The Author(s) 2021. Published by Oxford University Press.
Figures
References
-
- Attia A. (2012) ‘ Ensemble Prediction of Intrinsically Disordered Regions in Proteins’, BMC Bioinformatics, 13: 111.
-
- Breiman L. (2001) ‘ Random Forests’, Machine Learning, 45: 5–32.
LinkOut - more resources
Full Text Sources
Other Literature Sources
