

MALAT1 sponges miR-26a and miR-26b to regulate endothelial cell angiogenesis via PFKFB3-driven glycolysis in early-onset preeclampsia
- PMID: 33614238
- PMCID: PMC7868745
- DOI: 10.1016/j.omtn.2021.01.005
MALAT1 sponges miR-26a and miR-26b to regulate endothelial cell angiogenesis via PFKFB3-driven glycolysis in early-onset preeclampsia
Abstract
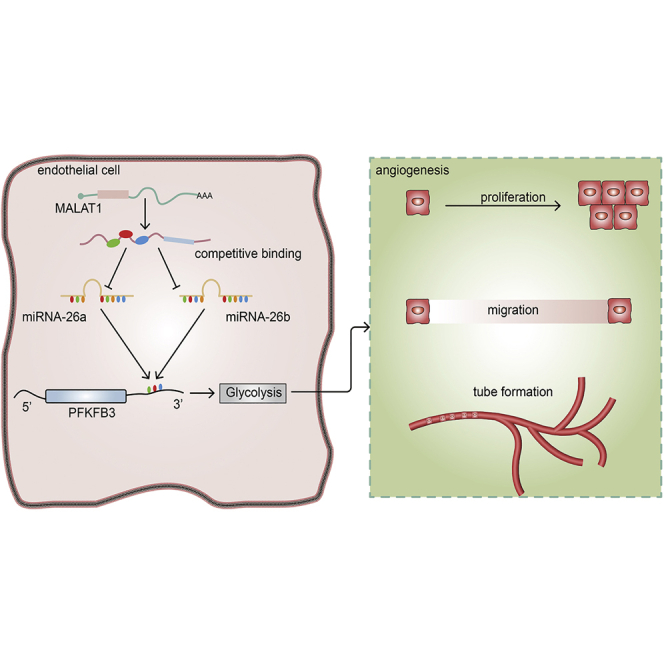
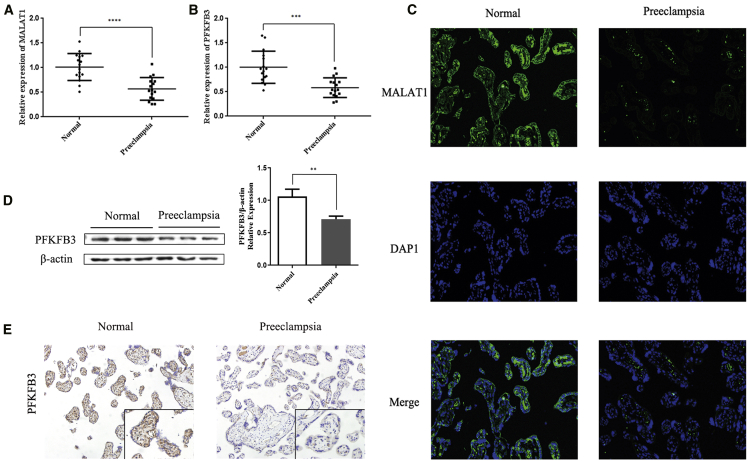
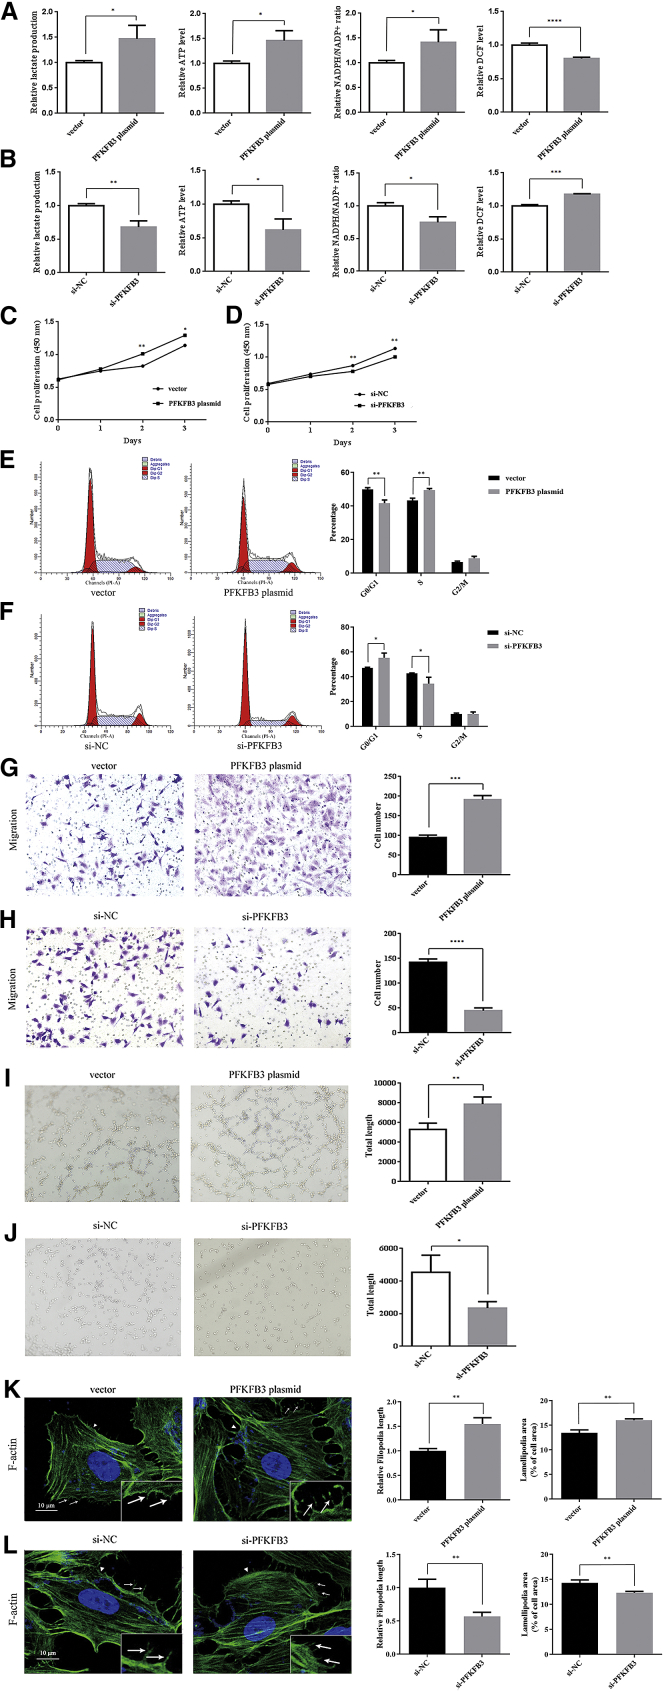
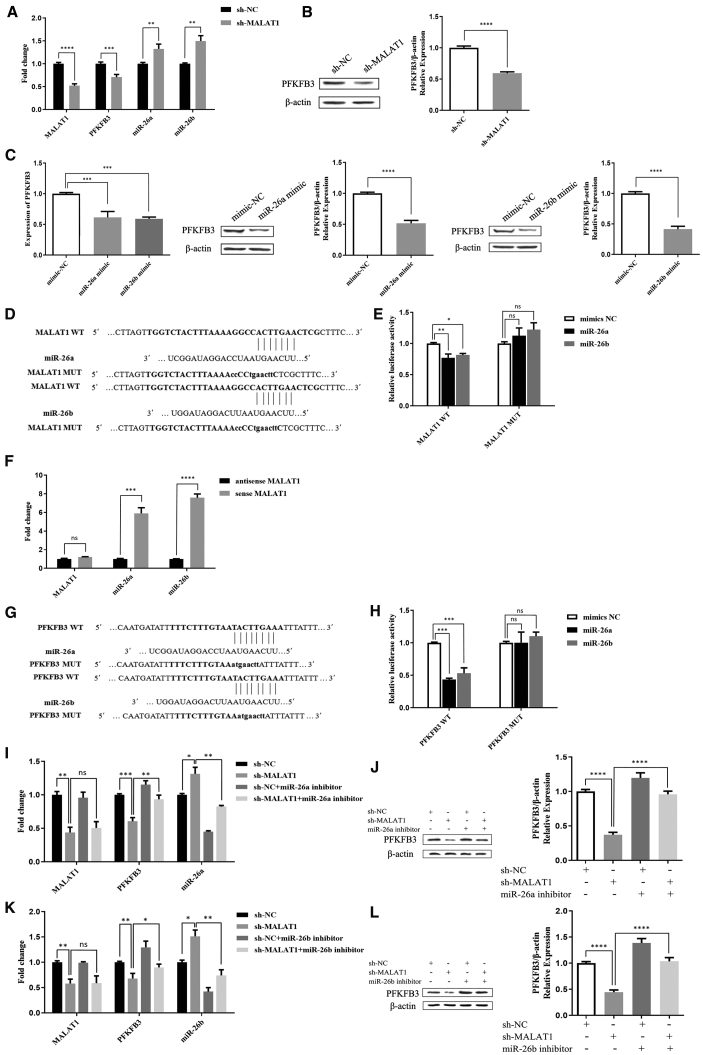
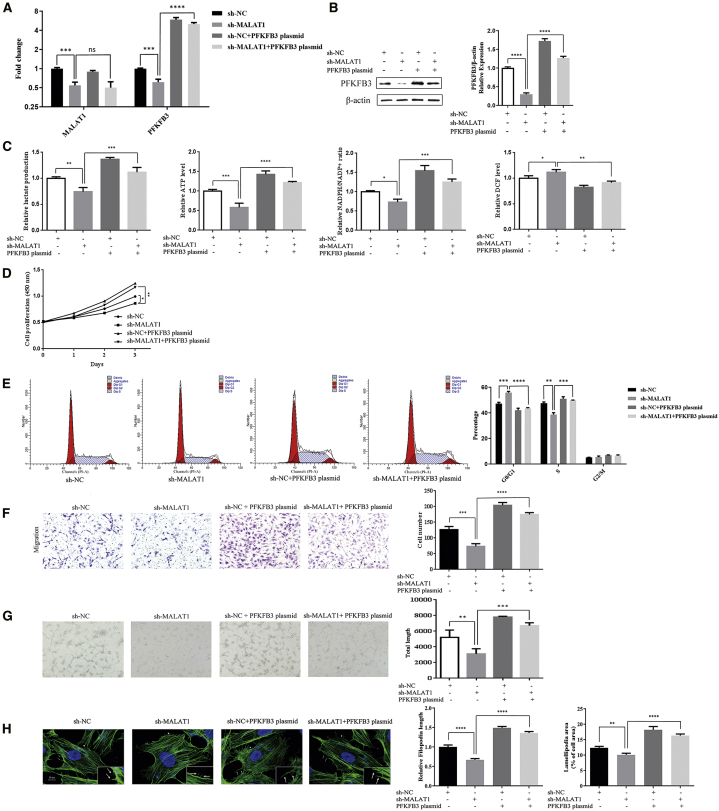
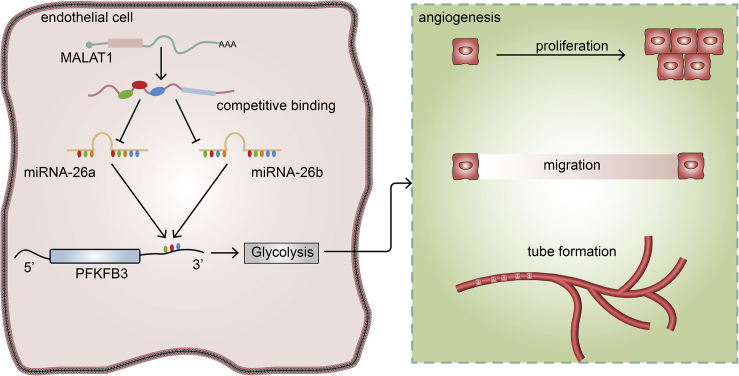
6-phosphofructo-2-kinase (PFKFB3) is a crucial regulator of glycolysis that has been implicated in angiogenesis and the development of diverse diseases. However, the functional role and regulatory mechanism of PFKFB3 in early-onset preeclampsia (EOPE) remain to be elucidated. According to previous studies, noncoding RNAs play crucial roles in EOPE pathogenesis. The goal of this study was to investigate the functional roles and co-regulatory mechanisms of the metastasis-associated lung adenocarcinoma transcript-1 (MALAT1)/microRNA (miR)-26/PFKFB3 axis in EOPE. In our study, decreased MALAT1 and PFKFB3 expression in EOPE tissues correlates with endothelial cell (EC) dysfunction. The results of in vitro assays revealed that PFKFB3 regulates the proliferation, migration, and tube formation of ECs by modulating glycolysis. Furthermore, MALAT1 regulates PFKFB3 expression by sponging miR-26a/26b. Finally, MALAT1 knockout reduces EC angiogenesis by inhibiting PFKFB3-mediated glycolysis flux, which is ameliorated by PFKFB3 overexpression. In conclusion, decreased MALAT1 expression in EOPE tissues reduces the glycolysis of ECs in a PFKFB3-dependent manner by sponging miR-26a/26b and inhibits EC proliferation, migration, and tube formation, which may contribute to abnormal angiogenesis in EOPE. Thus, strategies targeting PFKFB3-driven glycolysis may be a promising approach for the treatment of EOPE.
Keywords: PFKFB3; angiogenesis; early-onset preeclampsia; endothelial cells; glycolysis.
© 2021 The Author(s).
Conflict of interest statement
The authors declare no competing interests.
Figures
Similar articles
-
CircHIPK3/miR-124 affects angiogenesis in early-onset preeclampsia via CPT1A-mediated fatty acid oxidation.J Mol Med (Berl). 2024 Aug;102(8):1037-1049. doi: 10.1007/s00109-024-02461-5. Epub 2024 Jun 21. J Mol Med (Berl). 2024. PMID: 38904677
-
Targeting of PFKFB3 with miR-206 but not mir-26b inhibits ovarian cancer cell proliferation and migration involving FAK downregulation.FASEB J. 2022 Mar;36(3):e22140. doi: 10.1096/fj.202101222R. FASEB J. 2022. PMID: 35107852
-
Exosomal MALAT1 sponges miR-26a/26b to promote the invasion and metastasis of colorectal cancer via FUT4 enhanced fucosylation and PI3K/Akt pathway.J Exp Clin Cancer Res. 2020 Mar 24;39(1):54. doi: 10.1186/s13046-020-01562-6. J Exp Clin Cancer Res. 2020. PMID: 32209115 Free PMC article.
-
Pathogenic role of PFKFB3 in endothelial inflammatory diseases.Front Mol Biosci. 2024 Sep 10;11:1454456. doi: 10.3389/fmolb.2024.1454456. eCollection 2024. Front Mol Biosci. 2024. PMID: 39318551 Free PMC article. Review.
-
PFKFB3 in neovascular eye disease: unraveling mechanisms and exploring therapeutic strategies.Cell Biosci. 2024 Feb 10;14(1):21. doi: 10.1186/s13578-024-01205-9. Cell Biosci. 2024. PMID: 38341583 Free PMC article. Review.
Cited by
-
Rational Design of Nanomedicine for Placental Disorders: Birthing a New Era in Women's Reproductive Health.Small. 2024 Oct;20(41):e2300852. doi: 10.1002/smll.202300852. Epub 2023 May 16. Small. 2024. PMID: 37191231 Review.
-
TLR4 Modulates Senescence and Paracrine Action in Placental Mesenchymal Stem Cells via Inhibiting Hedgehog Signaling Pathway in Preeclampsia.Oxid Med Cell Longev. 2022 Jun 14;2022:7202837. doi: 10.1155/2022/7202837. eCollection 2022. Oxid Med Cell Longev. 2022. PMID: 35757501 Free PMC article.
-
LncRNA MALAT1 knockdown inhibits the development of choroidal neovascularization.Heliyon. 2023 Sep 4;9(9):e19503. doi: 10.1016/j.heliyon.2023.e19503. eCollection 2023 Sep. Heliyon. 2023. PMID: 37810031 Free PMC article.
-
Mechanical loading regulates osteogenic differentiation and bone formation by modulating non-coding RNAs.PeerJ. 2025 May 13;13:e19310. doi: 10.7717/peerj.19310. eCollection 2025. PeerJ. 2025. PMID: 40386232 Free PMC article. Review.
-
The Role of MALAT1 in Regulating the Proangiogenic Functions, Invasion, and Migration of Trophoblasts in Selective Fetal Growth Restriction.Biomolecules. 2024 Aug 11;14(8):988. doi: 10.3390/biom14080988. Biomolecules. 2024. PMID: 39199376 Free PMC article.
References
-
- Mol B.W.J., Roberts C.T., Thangaratinam S., Magee L.A., de Groot C.J.M., Hofmeyr G.J. Pre-eclampsia. Lancet. 2016;387:999–1011. - PubMed
-
- Huppertz B. Placental origins of preeclampsia: challenging the current hypothesis. Hypertension. 2008;51:970–975. - PubMed
-
- Raymond D., Peterson E. A critical review of early-onset and late-onset preeclampsia. Obstet. Gynecol. Surv. 2011;66:497–506. - PubMed
-
- Egbor M., Ansari T., Morris N., Green C.J., Sibbons P.D. Morphometric placental villous and vascular abnormalities in early- and late-onset pre-eclampsia with and without fetal growth restriction. BJOG. 2006;113:580–589. - PubMed
-
- Long W., Rui C., Song X., Dai X., Xue X., Lu Y., Shen R., Li J., Li J., Ding H. Distinct expression profiles of lncRNAs between early-onset preeclampsia and preterm controls. Clin. Chim. Acta. 2016;463:193–199. - PubMed
LinkOut - more resources
Full Text Sources
Other Literature Sources
