. 2021 Jan 20:23:968-981.
doi: 10.1016/j.omtn.2021.01.015. eCollection 2021 Mar 5.

miR-130a activates the VEGFR2/STAT3/HIF1α axis to potentiate the vasoregenerative capacity of endothelial colony-forming cells in hypoxia

Affiliations

miR-130a activates the VEGFR2/STAT3/HIF1α axis to potentiate the vasoregenerative capacity of endothelial colony-forming cells in hypoxia

Jasenka Guduric-Fuchs et al. Mol Ther Nucleic Acids. .

Abstract

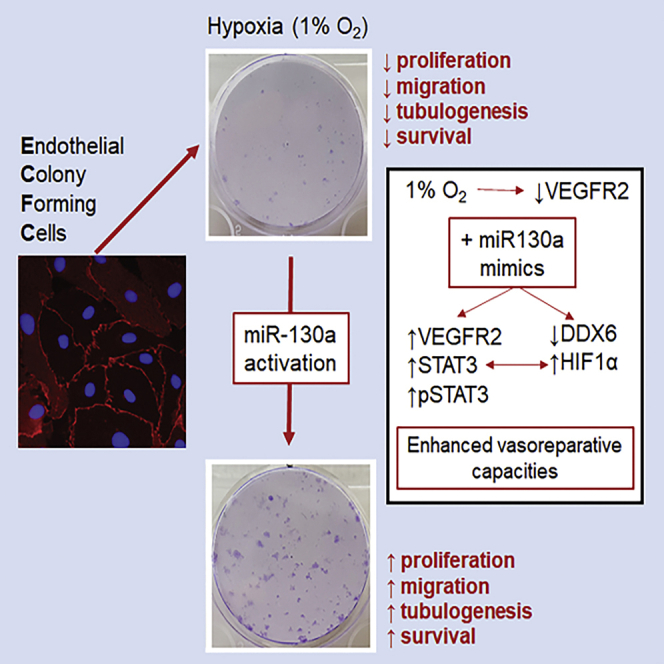
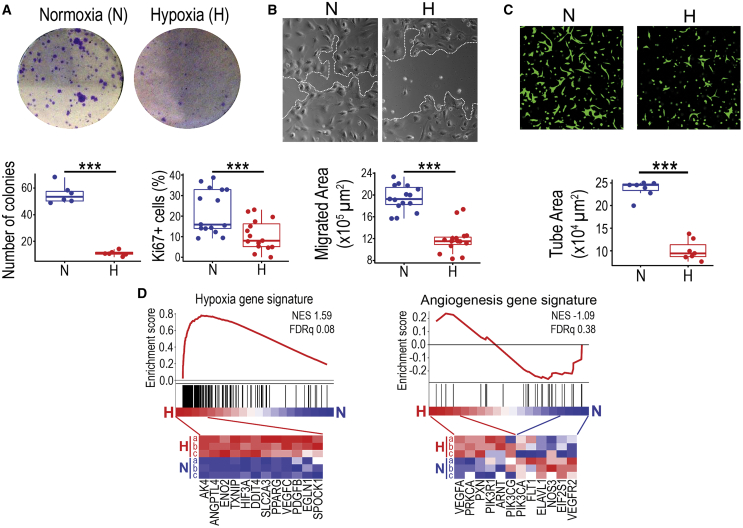
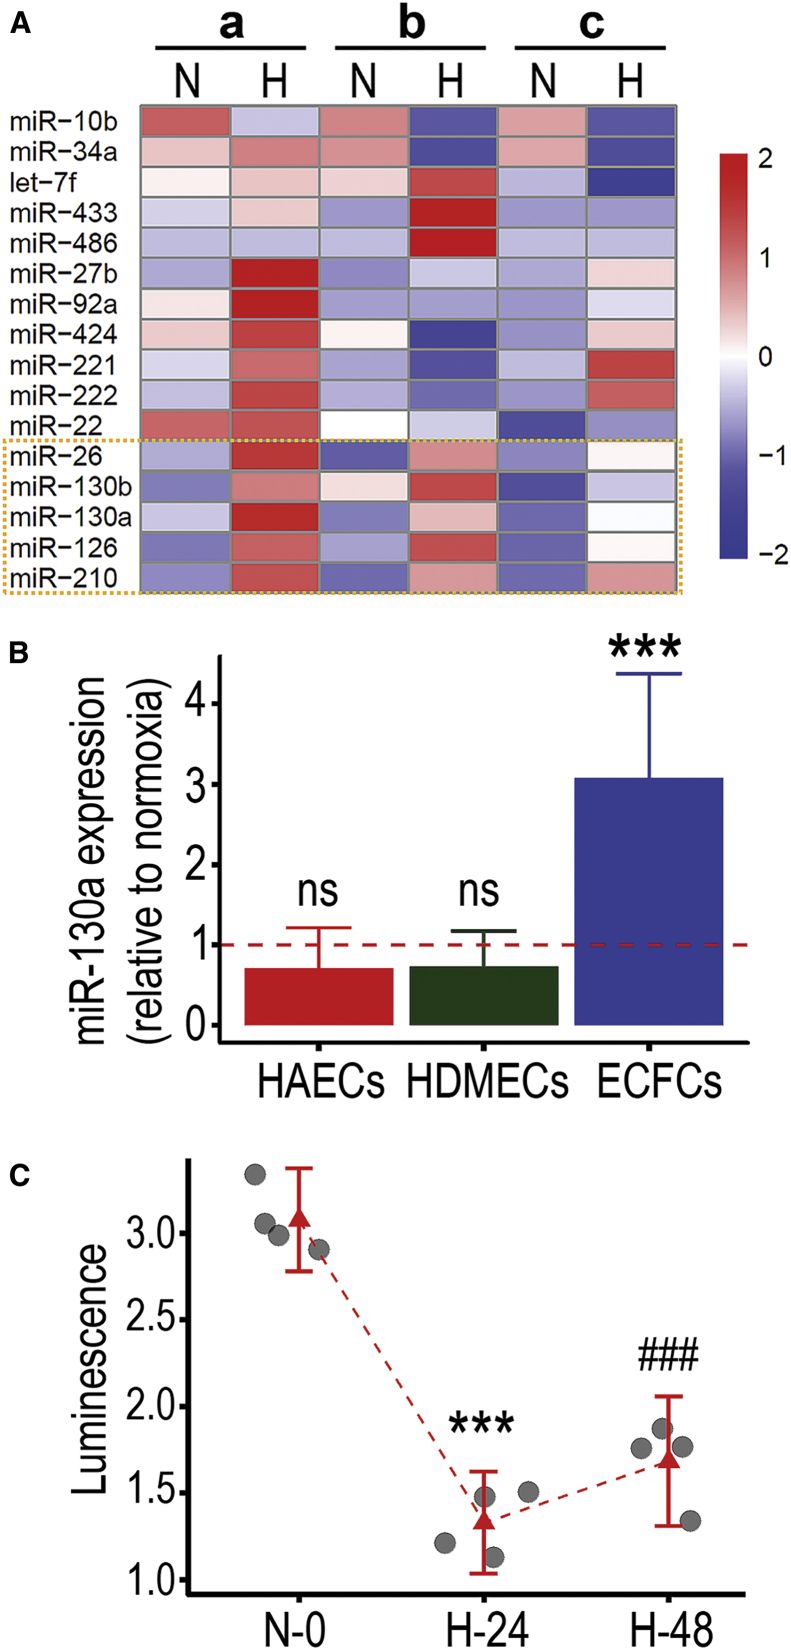
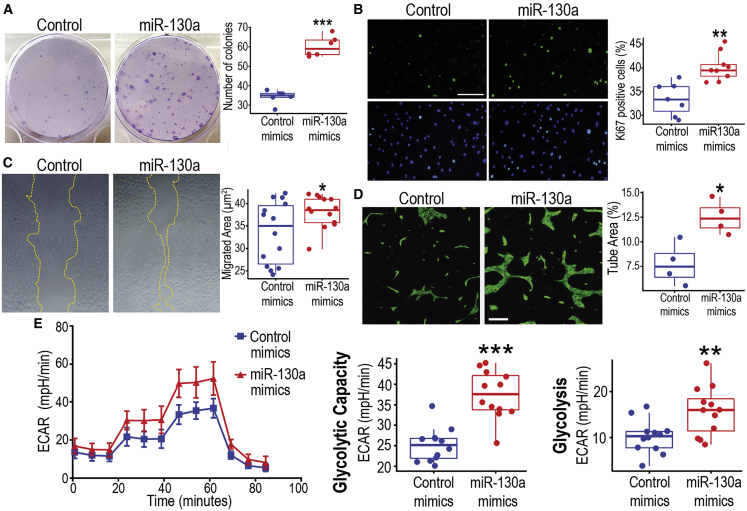
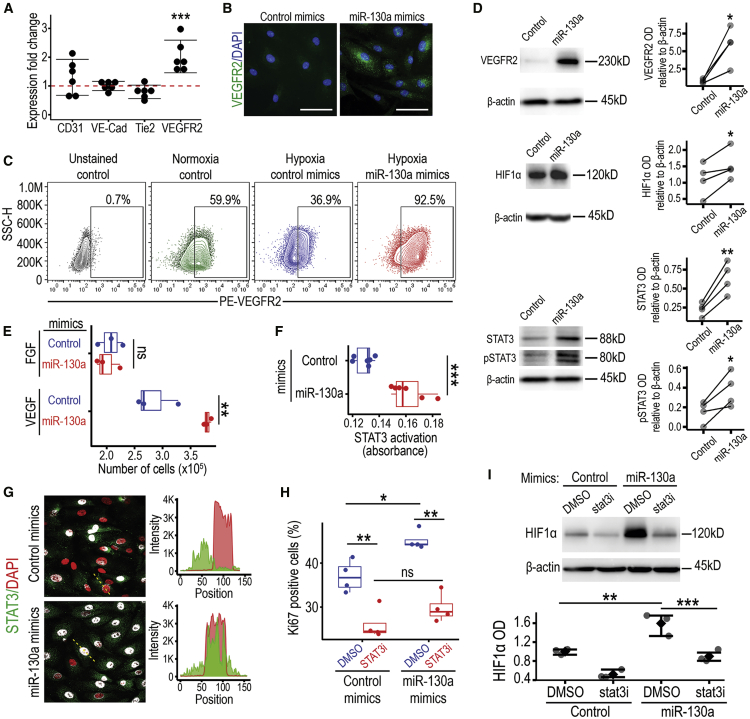
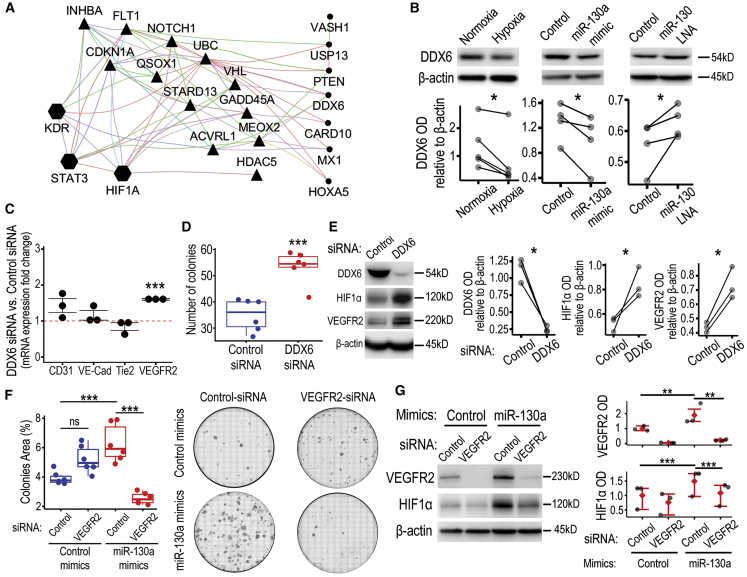
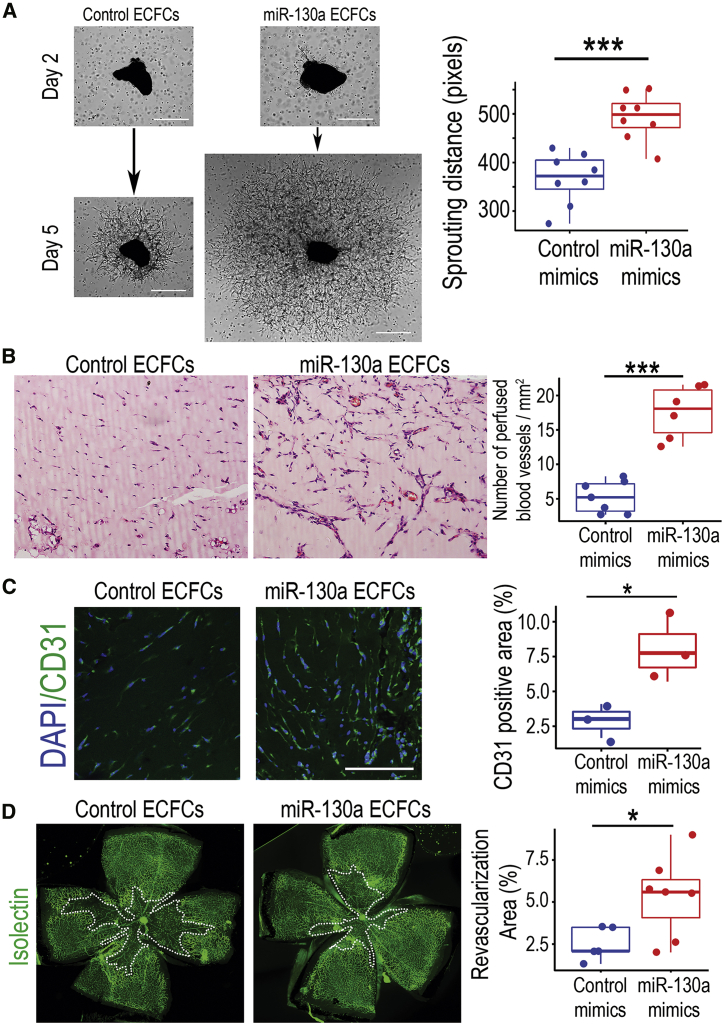
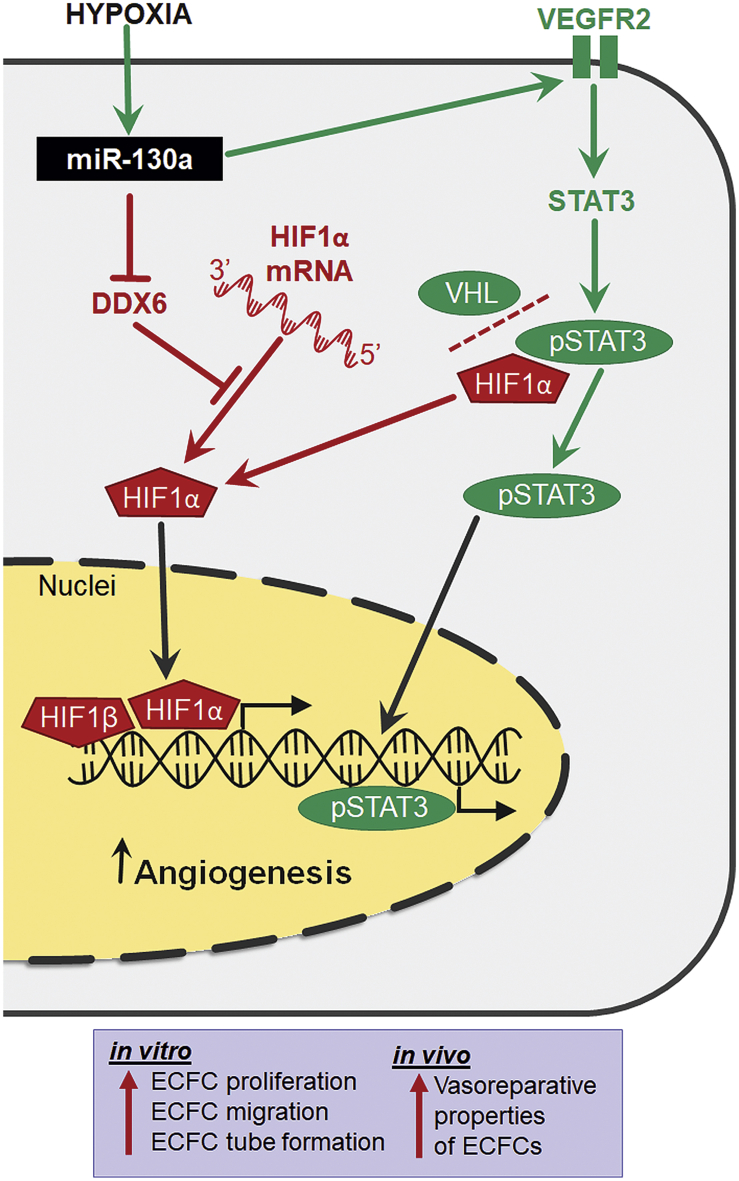
Hypoxia modulates reparative angiogenesis, which is a tightly regulated pathophysiological process. MicroRNAs (miRNAs) are important regulators of gene expression in hypoxia and angiogenesis. However, we do not yet have a clear understanding of how hypoxia-induced miRNAs fine-tune vasoreparative processes. Here, we identify miR-130a as a mediator of the hypoxic response in human primary endothelial colony-forming cells (ECFCs), a well-characterized subtype of endothelial progenitors. Under hypoxic conditions of 1% O2, miR-130a gain-of-function enhances ECFC pro-angiogenic capacity in vitro and potentiates their vasoreparative properties in vivo. Mechanistically, miR-130a orchestrates upregulation of VEGFR2, activation of STAT3, and accumulation of HIF1α via translational inhibition of Ddx6. These findings unveil a new role for miR-130a in hypoxia, whereby it activates the VEGFR2/STAT3/HIF1α axis to enhance the vasoregenerative capacity of ECFCs.

Keywords: ECFC; angiogenesis; endothelial; endothelial cell; endothelial progenitor; endothelium; hypoxia; miRNA; vascular repair.


Conflict of interest statement

The authors declare no competing interests.

Figures

None
Graphical abstract
Figure 1
Figure 1
Effects of hypoxia on ECFC in vitro functionality and transcriptome changes (A) Clonogenic assays and Ki67 staining were performed on ECFCs under normoxic and hypoxic conditions. Crystal violet staining used for visualization and quantification of colony numbers. Quantification of Ki67-positive cells shown as percentage. (B) Micrographs for scratch wound migration assays. White dotted lines indicate ECFC monolayer migrating leading edge. Quantification of migrated area depicted as μm2. (C) Images of Matrigel 3D tube-formation assay. ECFCs stained in green with calcein. Quantification of tube area in μm2. (D) GSEA using ECFC transcriptome data comparing normoxia versus hypoxia and based on hypoxia and angiogenesis gene signatures. Heatmaps showing some of the transcripts significantly upregulated in ECFCs under hypoxia. Data in (A)–(C) presented as boxplots. ∗∗∗p < 0.001 (Student’s t test).
Figure 2
Figure 2
miR-130a expression and activity are increased in ECFCs exposed to hypoxia (A) qRT-PCR Taqman screening of miRNA profile changes in ECFCs after 24 h exposure to hypoxia. Biological replicates depicted as a, b, c, in normoxia (N) and hypoxia (H). Changes in miRNA expression level shown by color log scale as follows: red for upregulation, white for no change, and blue for downregulation. Dotted yellow box highlights miRNAs that are consistently upregulated across biological replicates. (B) Bar plots for miR-130a expression levels comparing normoxia and hypoxia conditions in human aortic endothelial cells, human dermal microvascular endothelial cells, and ECFCs. ∗∗∗p < 0.001 (ANOVA). (C) miR-130a 3′ UTR luminescence reporter system to evaluate miR-130a activity under normoxia and after 24 and 48 h of hypoxia. Dot plots with 95% confidence interval (CI). ∗∗∗p < 0.001; ###p < 0.001; ns, not significant (ANOVA).
Figure 3
Figure 3
ECFCs treated with miR-130a mimics exhibit enhanced functionality (A) Clonogenic assay under hypoxia to compare ECFCs overexpressing miR-130a with controls. Crystal violet staining was used to visualize and quantify colony number. (B) Immunofluorescent staining for Ki67 in green, and nuclei stained in blue with DAPI. Scale bar, 300 μm. Quantification of Ki67-positive cells as percentage. (C) Micrographs for scratch wound migration assays under hypoxia. Yellow dotted lines indicate the migrating edge of ECFC monolayer. Quantification of migrated area depicted as μm2. (D) Images of Matrigel 3D tube-formation assay, ECFCs stained in green with calcein. Scale bar, 200 μm. Quantification of tube area as percentage of the total area. (E) Glycolysis stress test to evaluate glycolysis through changes in the extracellular acidification rate (ECAR) using the Seahorse XF analyzer with consecutive injections of 10 mM D-glucose, 1 μM oligomycin, and 50 mM 2-deoxyglucose at 20, 40, and 60 min, respectively. Boxplots generated with data from Seahorse XF Report Generator software. Data in (A)–(E) presented as boxplots. ∗∗∗p < 0.001; ∗∗p < 0.01; ∗p < 0.05 (Student’s t test).
Figure 4
Figure 4
miR-130a activates the VEGFR2/STAT3/HIF1 signaling axis in ECFCs under hypoxia (A) qRT-PCR assessment of angiogenesis-related genes in ECFCs from six biological replicates. ECFCs transfected with miR-130a mimics or control mimics were exposed to hypoxia for 48 h prior to RNA extraction, and their gene expression was compared. Data are presented as dot plots with 95% CI, ∗∗∗p < 0.001 (ANOVA). (B) Immunofluorescent staining for VEGFR2 in green, and nuclei are stained in blue with DAPI. Scale bar, 100 μm. (C) Flow cytometry analysis of VEGFR2 cell surface expression. Gates highlight the positivity threshold established using unstained controls. Percentage of positivity shown on the top right corner. (D) Western blot analysis of VEGFR2, HIF1α, STAT3, and phosphorylated STAT3 in the protein extract of miR-130a and control mimic transfected ECFCs exposed to hypoxia. ImageJ-based densitometry was used for quantification and statistical analysis. ∗∗p < 0.01; ∗p < 0.05 (Paired t test). See also Figure S6. (E) Graph showing cell counts after plating 1 × 105 of ECFCs and culturing for 3 days in hypoxia in basal media supplemented with either FGF or VEGF. Data are presented as bar plots. ∗∗p < 0.01; ns, not significant (Student’s t test). (F) Levels of nuclear STAT3 bound to its DNA target oligo sequence measured by ELISA-based TransAM STAT3 kit as absorbance. Data are presented as boxplots, ∗∗∗p < 0.001 (Student’s t test). (G) Immunofluorescent staining for STAT3 in green and nuclei stained with DAPI in red to highlight increased nuclear localization in the miR-130a mimic-transfected ECFCs. Colocalization shown in white. (H) Quantification of Ki67-positive cells as percentage of the total cell population. ECFCs transfected with miR-130a mimics or controls were treated with STAT3 inhibitor S31-201(stat3i). Data shown as boxplots. ∗∗p < 0.01; ∗p < 0.05 (ANOVA). (I) Western blot analysis of HIF1α in miR-130a mimics-treated ECFCs cultured with stat3 inhibitor. ***p < 0.001; **p < 0.01 (ANOVA).
Figure 5
Figure 5
Inhibition of the miR-130a target DDX6 in hypoxia phenocopies the effects of miR-130a overexpression (A) Interactome generated by Cytoscape-Genemania between miRNA-130a target genes associated with negative regulation of angiogenesis and the VEGFR2/STAT3/HIF1α axis. Triangles highlight miR-130a targets with a direct association with the pathway while circles highlight the ones that need an intermediary node. Edge color indicates type of association as follows: purple for co-expression, blue for colocalization, green for genetic interactions, light blue for pathway, pink for physical interactions, orange for predicted interaction, and brown for shared protein domains. (B) Western blot for DDX6 protein expression in ECFCs under hypoxia, treated with miR-130a mimic or miR-130 LNA. ImageJ-based densitometry of bands is depicted in relation to β-actin. ∗p < 0.05 (Paired t test). See also Figure S9. (C) qRT-PCR assessment of gene expression, comparing DDX6-siRNA transfected ECFCs with control-siRNA transfected cells, after 48 h in hypoxia. Data are shown as dot plots with standard error of the mean. ∗∗∗p < 0.001 (ANOVA). (D) Quantification of number of colonies in the clonogenic assay under hypoxic conditions comparing DDX6-siRNA transfected ECFCs with control-siRNA transfected cells. Data are shown as boxplots. ∗∗∗p < 0.001 (Student’s t test). (E) Western blot analysis of HIF1α and VEGFR2 expression in ECFCs with silenced DDX6. ∗p < 0.05 (Paired t test). See also Figure S10. (F) Quantification of number of colonies in the clonogenic assay under hypoxic conditions comparing VEGFR2-siRNA transfected ECFCs with control-siRNA transfected cells. Data shown as boxplots. ∗∗∗p < 0.001 (Student’s t test). Representative images are shown. (G) Western blot analysis of HIF1α expression in ECFCs with silenced VEGFR2. ***p < 0.001; **p < 0.01 (ANOVA). See also Figure S11.
Figure 6
Figure 6
miR-130a enhances ECFCs angiogenic and vasoreparative function in ex vivo and in vivo models (A) Micrographs of ex vivo choroidal explants co-cultured with control or miR-130a overexpressing ECFCs quantified for sprouting angiogenesis at day 5. Scale bar, 500 μm. (B) Representative images of Matrigel implant sections stained with H&E. ECFCs transfected with miR-130a mimics or scrambled mimic controls were mixed with Matrigel and injected subcutaneously into nude mice. Matrigel plugs were retrieved 10 days after subcutaneous implantation for H&E staining. Quantification of the number of perfused vessels per mm2. (C) Immunohistochemistry of Matrigel implants with an antibody against CD31 to identify vasculature. (D) Representative images of flat-mounted retinas from the OIR model where ECFCs transfected with miR-130a or control mimics were delivered intravitreally at postnatal day 12 (P12; at the outset of central retinal ischemia). Retinas were sampled at P14, stained with isolectin to identify the retinal vasculature, and imaged for quantification of ischemic areas in the central retina. Data in (A)–(D) are presented as boxplots. ∗∗∗p < 0.001; ∗p < 0.05 (Student’s t test).
Figure 7
Figure 7
miR-130a regulates pro-angiogenic signals in ECFCs Schematic representation of the working model for miR-130a activation and function, under hypoxia, by modulating the VEGFR2/STAT3 and the DDX6/HIF1α molecular pathways to enhance ECFCs vasoreparative properties.

References

    1. Djuranovic S., Nahvi A., Green R. miRNA-mediated gene silencing by translational repression followed by mRNA deadenylation and decay. Science. 2012;336:237–240. - PMC - PubMed
    1. Landskroner-Eiger S., Moneke I., Sessa W.C. miRNAs as modulators of angiogenesis. Cold Spring Harb. Perspect. Med. 2013;3:a006643. - PMC - PubMed
    1. Zhou Q., Gallagher R., Ufret-Vincenty R., Li X., Olson E.N., Wang S. Regulation of angiogenesis and choroidal neovascularization by members of microRNA-23∼27∼24 clusters. Proc. Natl. Acad. Sci. USA. 2011;108:8287–8292. - PMC - PubMed
    1. Rosano S., Corà D., Parab S., Zaffuto S., Isella C., Porporato R., Hoza R.M., Calogero R.A., Riganti C., Bussolino F., Noghero A. A regulatory microRNA network controls endothelial cell phenotypic switch during sprouting angiogenesis. eLife. 2020;9:e48095. - PMC - PubMed
    1. Kulshreshtha R., Ferracin M., Wojcik S.E., Garzon R., Alder H., Agosto-Perez F.J., Davuluri R., Liu C.-G., Croce C.M., Negrini M. A microRNA signature of hypoxia. Mol. Cell. Biol. 2007;27:1859–1867. - PMC - PubMed