. 2021 Jan 20:23:995-1006.
doi: 10.1016/j.omtn.2021.01.011. eCollection 2021 Mar 5.

miRNA in food simultaneously controls animal viral disease and human tumorigenesis

Affiliations

miRNA in food simultaneously controls animal viral disease and human tumorigenesis

Yalei Cui et al. Mol Ther Nucleic Acids. .

Abstract

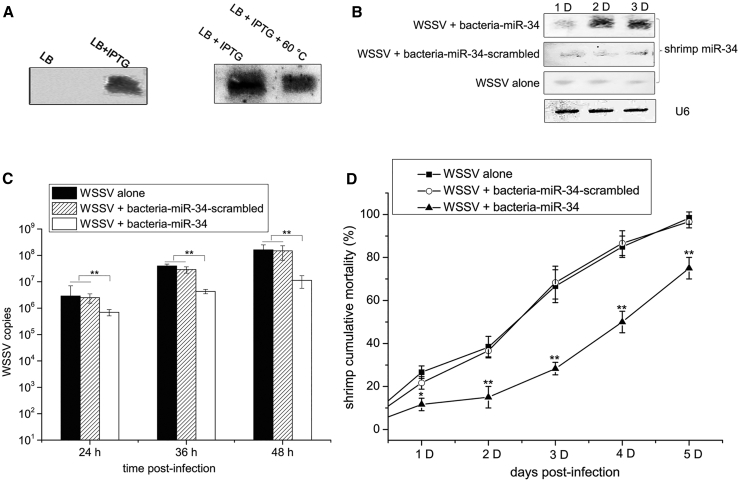
During virus infection in animals, the virus completes its life cycle in a host cell. A virus infection results in the metabolic deregulation of its host and leads to metabolic disorders, ultimately paving the way for cancer progression. Because metabolic disorders in virus infections occurring in animal are similar to metabolic disorders in human tumorigenesis, animal antiviral microRNAs (miRNAs), which maintain the metabolic homeostasis of animal cells, in essence, may have anti-tumor activity in humans. However, that issue has not been investigated. In this study, shrimp miR-34, a potential antiviral miRNA of shrimp against white spot syndrome virus (WSSV) infection, was identified. Overexpression of shrimp miR-34 in shrimp fed bacteria expressing miR-34 suppressed WSSV infection by targeting the viral wsv330 and wsv359 genes. Furthermore, the expression of shrimp miR-34 in mice fed miR-34-overexpressing shrimp suppressed breast cancer progression by targeting human CCND1, CDK6, CCNE2, E2F3, FOSL1, and MET genes. Therefore, our study suggests that the miRNAs in food could be an effective strategy for synchronously controlling viral diseases of economic animals and cancers in humans.

Keywords: breast cancer; food intake; shrimp miR-34; virus infection.


Conflict of interest statement

The authors declare no competing interests.

Figures

None
Graphical abstract
Figure 1
Figure 1
Control of shrimp viral disease by miR-34 in food (A) The expression of mature shrimp miR-34 in bacteria. The miR-34 construct was transformed into HT115 bacteria. The recombinant bacteria were cultured in Luria-Bertani (LB). Then, IPTG was used to induce the expression of miR-34 in bacteria. The expression level of miR-34 was detected by northern blot analysis. (B) The detection of mature shrimp miR-34 in heat-inactivated bacteria. The recombinant bacteria were cultured and induced by IPTG in LB medium and then heat inactivated at 60°C. Northern blot analysis was used to detect miR-34 expression levels. (C) The detection of mature shrimp miR-34 in shrimp fed shrimp feed containing miR-34. Shrimp were fed shrimp feed containing heat-inactivated bacteria expressing miR-34 (bacteria-miR-34), which was followed by challenge with WSSV. WSSV alone and WSSV + bacteria expressing the scrambled miR-34 (bacteria-miR-34-scrambled) were used as controls. At different days after feeding, shrimp muscle was subjected to northern blot analysis to detect miR-34 expression levels. (D) The influence of shrimp miR-34 on the virus copy number in shrimp. Shrimp were fed shrimp feed containing bacteria-miR-34 or bacteria-miR-34-scrambled and infected with WSSV (∗∗p < 0.01). (E) Shrimp mortality (∗∗p < 0.01).
Figure 2
Figure 2
Mechanism of miR-34 in shrimp defending against WSSV infection (A) The prediction of WSSV genes targeted by shrimp miR-34. The seed sequence of miR-34 was underlined. (B) Constructs of WSSV and EGFP genes. The underlined sequence represented that targeted by miR-34. (C) The direct interaction between shrimp miR-34 and virus genes in insect cells. Cells were co-transfected with miR-34 and the 3′ UTR of virus genes. At 48 h after co-transfection, fluorescence was examined. Scale bar, 100 μm. (D) The fluorescent intensities of cells. (E) The interaction between shrimp miR-34 and wsv330 and wsv359 genes in vivo. Shrimp were co-injected with WSSV and miR-34. At different post-infection times, the expression levels of wsv330 and wsv359 genes were evaluated by quantitative real-time PCR. As a control, miR-34-scrambled was included in the assays. (F) Western blot analysis of wsv330 /wsv359-encoded protein after shrimp were co-injected with WSSV and miR-34. (G) The evaluation of wsv330 and wsv359 silencing in vivo using northern blot analysis. Shrimp were injected with WSSV and wsv330-siRNA or wsv359-siRNA. WSSV alone and siRNA-scrambled were included in the injections. At different post-infection times, the expression of wsv330 and wsv359 was detected by northern blotting. Shrimp β-actin was used as a control. (H) The detection of wsv330 and wsv359 silencing in vivo by western blot analysis. (I) The effects of wsv330 and wsv359 silencing on virus infection in shrimp. The WSSV copy number in wsv330-silenced or wsv359-silenced shrimp was quantified by quantitative real-time PCR. WSSV alone and siRNA-scrambled were included in the injections as controls. (J) The influence of wsv330 and wsv359 silencing on WSSV-infected shrimp mortality. After silencing of wsv330 or wsv359, the cumulative mortality of WSSV-infected shrimp was monitored daily. (K) A model for miR-34-mediated antiviral activity in shrimp. Throughout, statistically significant differences among treatments are represented with asterisks: ∗p < 0.05, ∗∗p < 0.01.
Figure 3
Figure 3
Inhibitory effects on breast cancer progression of shrimp miR-34 from cooked shrimp fed miR-34-expressing bacteria (A) Northern blot analysis of mature shrimp miR-34 in shrimp. Shrimp were fed bacteria-miR-34. Two days later, shrimp were cooked in a microwave oven for 2 min. Shrimp injected with miR-34 were used as a control. Total RNA was extracted from shrimp muscle and subjected to northern blot analysis to detect miR-34 expression levels. U6 was used as a control. (B) Expression of shrimp miR-34 in breast cancer cells. Shrimp were fed shrimp feed alone or shrimp feed containing bacteria-miR-34 or bacteria-miR-34-scrambled for 2 days and then cooked. The miRNAs extracted from the cooked shrimp muscles were transfected into MDA-MB-231 or MDA-MB-435 cells. At 36 h after transfection, mature shrimp miR-34 level in cells was detected using northern blot. Cells without treatment served as a negative control. (C) Influence of shrimp miR-34 on breast cancer cell growth from cooked shrimp fed miR-34-expressing bacteria. A cell proliferation assay was performed with MDA-MB-231 or MDA-MB-435 cells transfected with miRNAs from muscle of cooked shrimp fed bacteria-miR-34. Shrimp fed shrimp feed alone and those fed shrimp feed containing bacteria-miR-34-scrambled were included in the assays. As a negative control, cells that did not receive treatment were also assayed. (D) Effects of shrimp miR-34 on breast cancer cell migration from cooked shrimp fed miR-34-expressing bacteria. A wound healing assay was performed to evaluate metastasis of MDA-MB-231 or MDA-MB-435 cells at 36 h after transfection with miRNAs from muscle of cooked shrimp fed bacteria-miR-34. Shrimp fed shrimp feed alone and those fed shrimp feed containing bacteria-miR-34-scrambled were used as controls. (E) The role of shrimp miR-34 from cooked shrimp fed miR-34-expressing bacteria in breast cancer cell cycle. MDA-MB-231/435 cells were treated with miRNAs extracted from cooked shrimp fed shrimp feed containing bacteria-miR-34 or bacteria-miR-34-scrambled; 36 h later, the cell cycle was examined. (F) The impact of shrimp miR-34 on breast cancer cell migration from cooked shrimp fed shrimp feed containing bacteria-miR-34 was determined with Boyden chamber assays. MDA-MB-231 or 435 cells were treated with miRNAs from muscles of cooked shrimp fed miR-34-expressing bacteria. At 36 h after transfection, a cell migration assay was performed. (G) Influence of miR-34 on breast cancer cell adhesion. At 36 h after MDA-MB-231 or 435 cells were transfected with miRNAs from cooked shrimp fed bacteria-miR-34, cell adhesive ability was assessed. (H) Role of miR-34 in breast cancer cell invasion. MiRNAs from cooked shrimp fed bacteria-miR-34 were transfected into MDA-MB-231 or 435 cells, and a cell invasion assay was performed 36 h after transfection. (I) Expression levels of miR-34 target genes in breast cancer cells. MDA-MB-231 or 435 cells were transfected with miRNAs from cooked shrimp fed bacteria-miR-34. At 36 h after transfection, expression levels of CCND1, CDK6, CCNE2, E2F3, MET, and FOSL1 were quantified by quantitative real-time PCR. (J) Protein levels of miR-34 target genes in breast cancer cells. Western blot analysis was conducted to detect protein levels. β-tubulin was used as a control. Cells without treatment served as negative control. Throughout, statistically significant differences among treatments are represented with asterisks: ∗p < 0.05, ∗∗p < 0.01. Scale bar, 100 μm.
Figure 4
Figure 4
Suppression of breast tumor growth and metastasis by shrimp miR-34 from cooked shrimp fed miR-34-expressing bacteria in vivo (A) Model of the animal experiment. Breast cancer cells (MDA-MB-231) were injected into nude mice. Nude mice were fed cooked muscle from shrimp fed shrimp feed alone (shrimp feed) or those fed cooked muscle of shrimp fed miR-34-expressing bacteria (shrimp miR-34 feed) every 2 days. Subsequently, tumor growth and metastasis were examined. (B) Tumor growth curves measured weekly 2 weeks after cell injection. (C) Representative images of solid tumors harvested 6 weeks after cell injection. (D) Shrimp miR-34 expression levels in the blood of mice. Six weeks after injecting breast cancer cells (MDA-MB-231), blood was collected from mice with different treatments. The expression level of miR-34 in the blood was examined by quantitative real-time PCR. (E) Quantitative real-time PCR analysis of miR-34 expression level in solid tumors derived from mice with different treatments. (F) Quantitative real-time PCR analysis of miR-34 target genes in solid tumors of mice with different treatments. (G) The expression level of miR-34 target genes encoding proteins in solid tumors. Western blot was used to detect protein levels. β-tubulin was included as a control. (H) Immunohistochemical analysis of miR-34 target gene-encoding proteins in solid tumors. Brown and blue colors represented proteins and nuclei, respectively. Proteins that were detected were indicated on the left. Scale bar, 100 μm. (I) Representative images of mouse lungs harvested 4 weeks after cell injection. (J) Images displaying tumor nodules per lung for mice that received different treatments. (K) MiR-34 expression level in blood of nude mice. Four weeks after cell injection, RNA was extracted from the blood of mice and analyzed using quantitative real-time PCR. (L) Model expressing the role of shrimp miR-34 in tumorigenesis through food intake. Throughout, statistically significant differences among treatments are indicated with asterisks: ∗∗p < 0.01.

Similar articles

Cited by

References

    1. Chen I.T., Aoki T., Huang Y.T., Hirono I., Chen T.C., Huang J.Y., Chang G.D., Lo C.F., Wang H.C. White spot syndrome virus induces metabolic changes resembling the warburg effect in shrimp hemocytes in the early stage of infection. J. Virol. 2011;85:12919–12928. - PMC - PubMed
    1. Kong T., Ren X., Lin S., Li S., Gong Y. Elucidation of metabolic responses in mud crab Scylla paramamosain challenged to WSSV infection by integration of metabolomics and transcriptomics. Dev. Comp. Immunol. 2020;113:103799. - PubMed
    1. Drakesmith H., Prentice A. Viral infection and iron metabolism. Nat. Rev. Microbiol. 2008;6:541–552. - PubMed
    1. Diamond D.L., Syder A.J., Jacobs J.M., Sorensen C.M., Walters K.A., Proll S.C., McDermott J.E., Gritsenko M.A., Zhang Q., Zhao R. Temporal proteome and lipidome profiles reveal hepatitis C virus-associated reprogramming of hepatocellular metabolism and bioenergetics. PLoS Pathog. 2010;6:e1000719. - PMC - PubMed
    1. Arnold P.A., Johnson K.N., White C.R. Physiological and metabolic consequences of viral infection in Drosophila melanogaster. J. Exp. Biol. 2013;216:3350–3357. - PubMed