

A risk score model with five long non-coding RNAs for predicting prognosis in gastric cancer: an integrated analysis combining TCGA and GEO datasets
- PMID: 33614260
- PMCID: PMC7879943
- DOI: 10.7717/peerj.10556
A risk score model with five long non-coding RNAs for predicting prognosis in gastric cancer: an integrated analysis combining TCGA and GEO datasets
Abstract
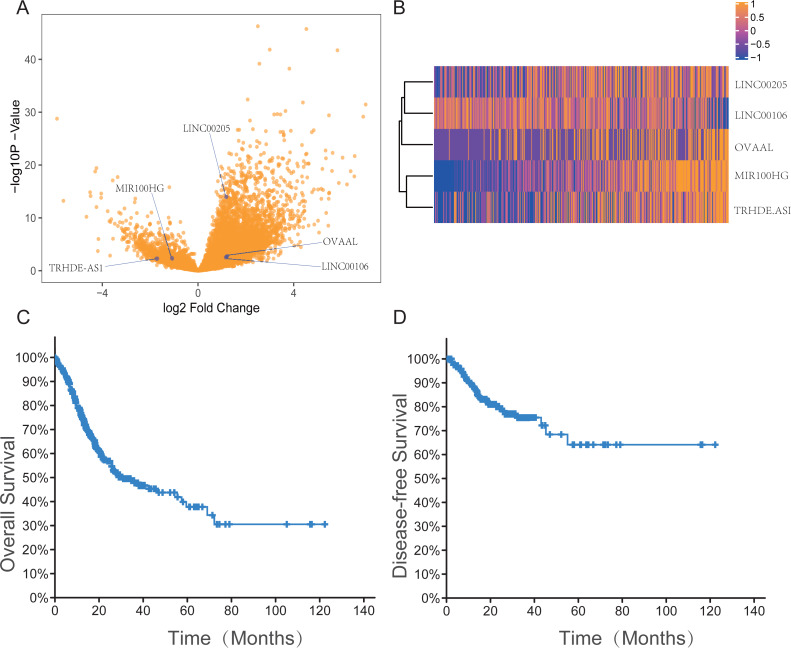
Background: Gastric cancer (GC) is one of the most common carcinomas of the digestive tract, and the prognosis for these patients may be poor. There is evidence that some long non-coding RNAs(lncRNAs) can predict the prognosis of patients with GC. However, few lncRNA signatures have been used to predict prognosis. Herein, we aimed to construct a risk score model based on the expression of five lncRNAs to predict the prognosis of patients with GC and provide new potential therapeutic targets.
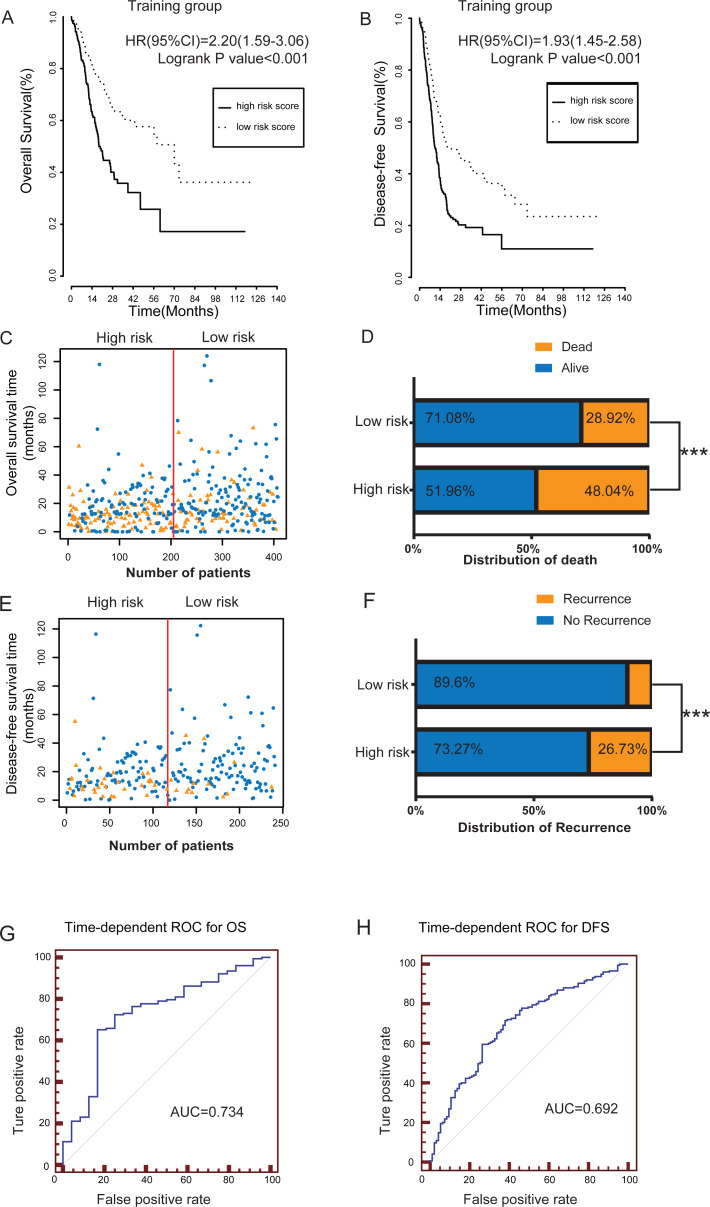
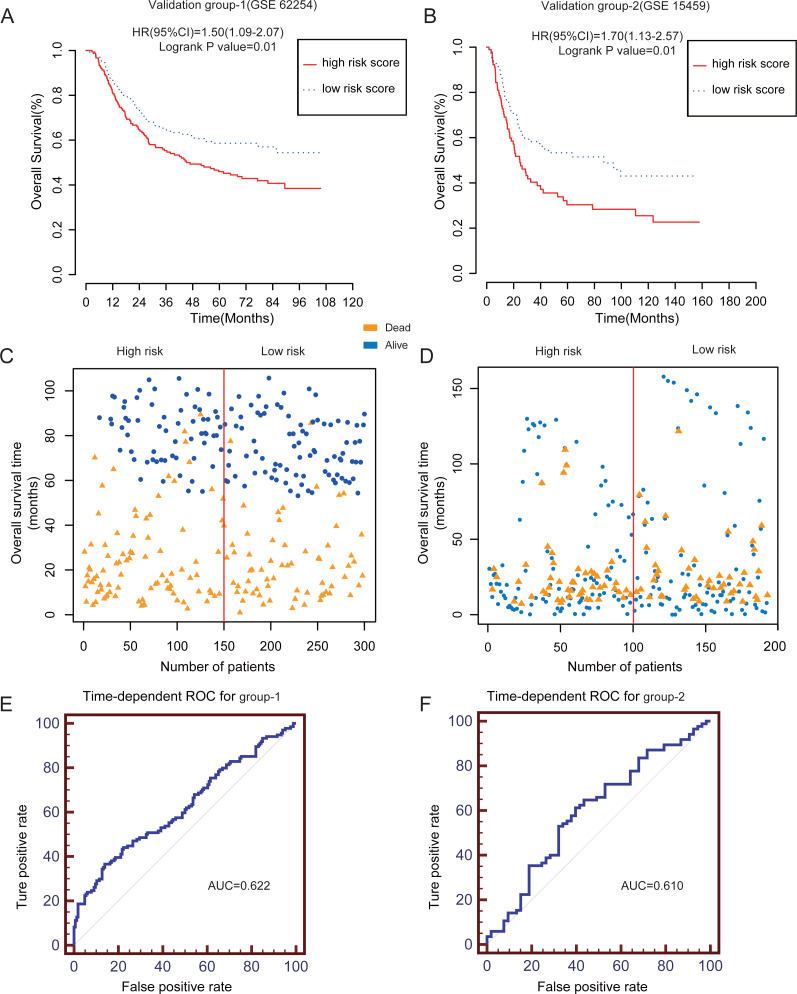
Methods: We performed differentially expressed and survival analyses to identify differentially expressed survival-ralated lncRNAs by using GC patient expression profile data from The Cancer Genome Atlas (TCGA) database. We then established a formula including five lncRNAs to predict the prognosis of patients with GC. In addition, to verify the prognostic value of this risk score model, two independent Gene Expression Omnibus (GEO) datasets, GSE62254 (N = 300) and GSE15459 (N = 200), were employed as validation groups.
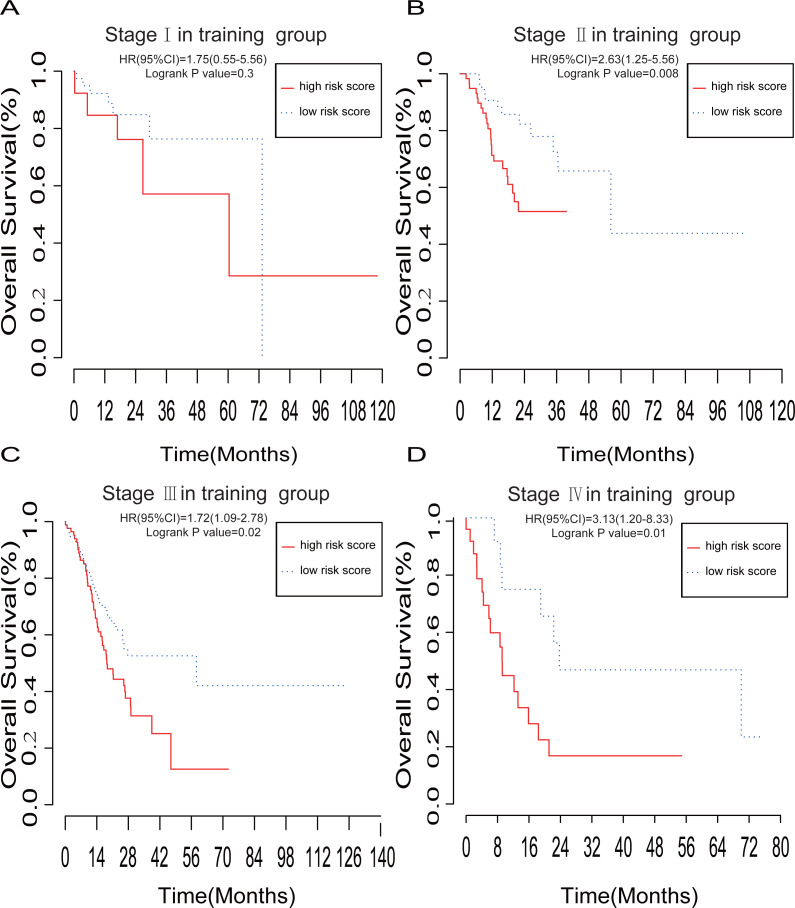
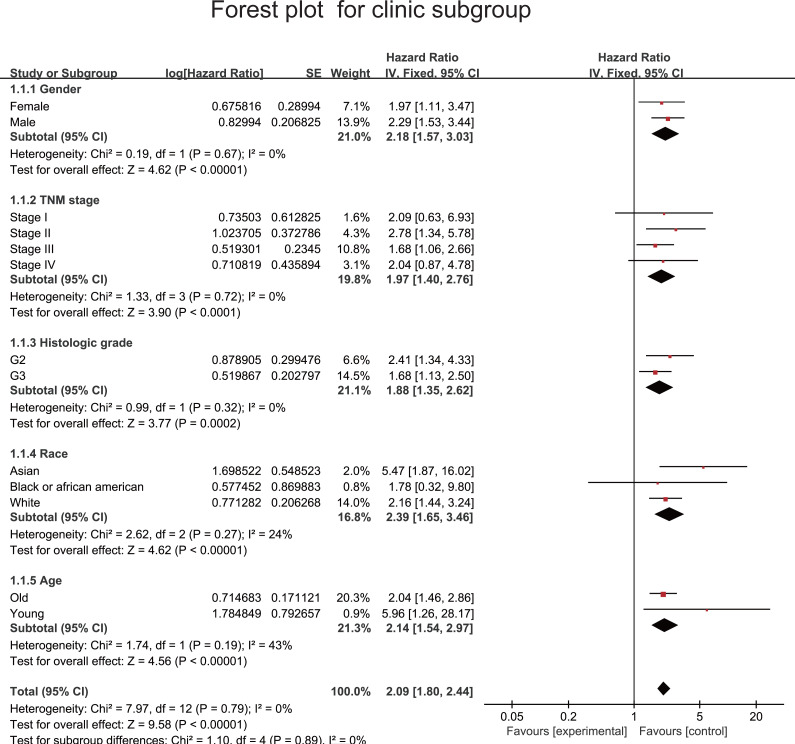
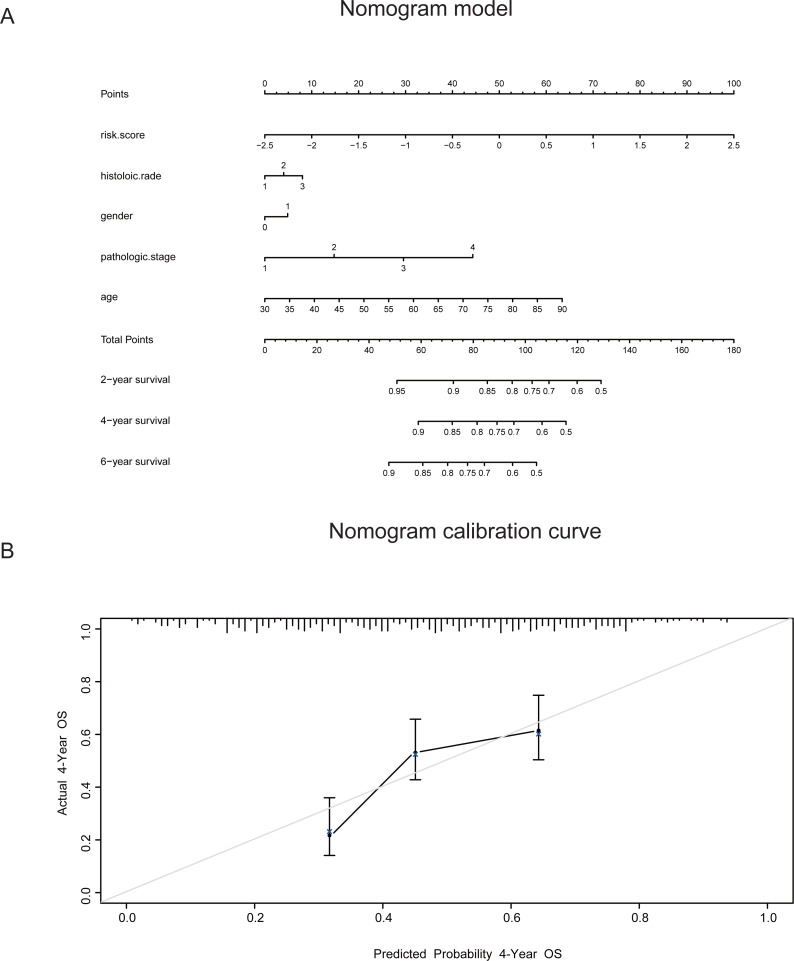
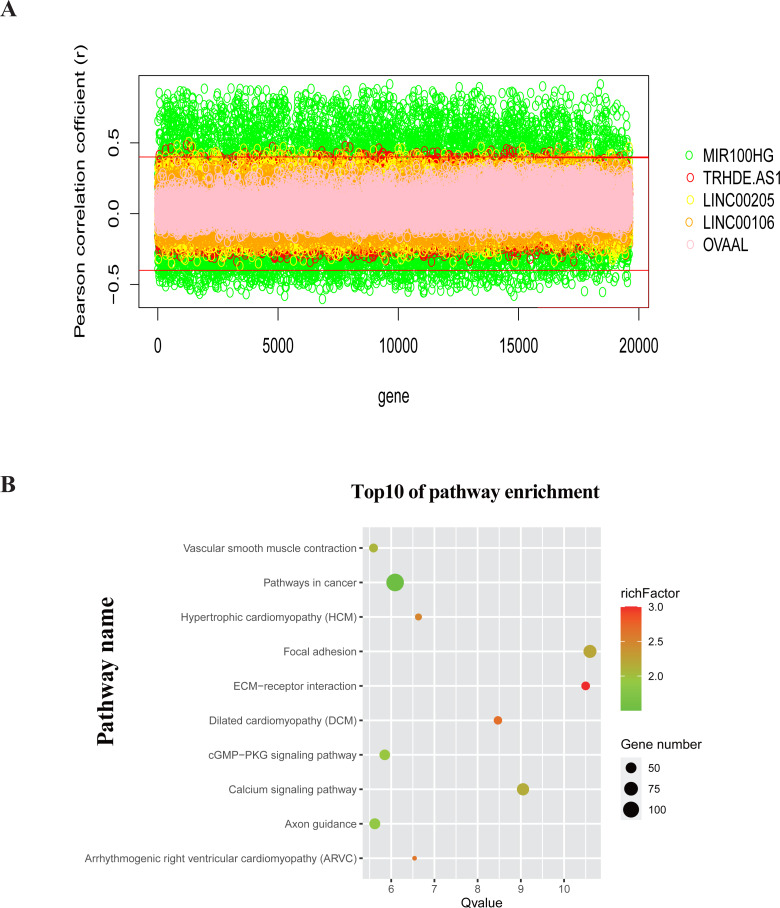
Results: Based on the characteristics of five lncRNAs, patients with GC were divided into high or low risk subgroups. The prognostic value of the risk score model with five lncRNAs was confirmed in both TCGA and the two independent GEO datasets. Furthermore, stratification analysis results showed that this model had an independent prognostic value in patients with stage II-IV GC. We constructed a nomogram model combining clinical factors and the five lncRNAs to increase the accuracy of prognostic prediction. Enrichment analysis based on the Kyoto Encyclopedia of Genes and Genomes (KEGG) suggested that the five lncRNAs are associated with multiple cancer occurrence and progression-related pathways.
Conclusion: The risk score model including five lncRNAs can predict the prognosis of patients with GC, especially those with stage II-IV, and may provide potential therapeutic targets in future.
Keywords: Gastric cancer; LINC00106; LINC00205; Long non-coding RNA; MIR100HG; OVAAL; Prognosis; TRHDE-AS1.
©2021 Wu et al.
Conflict of interest statement
The authors declare there are no competing interests.
Figures
Similar articles
-
Long non-coding RNA profile study identifies a metabolism-related signature for colorectal cancer.Mol Med. 2021 Aug 3;27(1):83. doi: 10.1186/s10020-021-00343-x. Mol Med. 2021. PMID: 34344319 Free PMC article.
-
Identification of functional lncRNAs in gastric cancer by integrative analysis of GEO and TCGA data.J Cell Biochem. 2019 Oct;120(10):17898-17911. doi: 10.1002/jcb.29058. Epub 2019 May 28. J Cell Biochem. 2019. PMID: 31135068
-
Prognostic signature and immune landscape of 5-methylcytosine-related long non-coding RNAs in gastric cancer.Heliyon. 2024 Sep 14;10(18):e37290. doi: 10.1016/j.heliyon.2024.e37290. eCollection 2024 Sep 30. Heliyon. 2024. PMID: 39323814 Free PMC article.
-
Role of Long Non-Coding RNAs in the Chemoresistance of Gastric Cancer: A Systematic Review.Onco Targets Ther. 2021 Jan 18;14:503-518. doi: 10.2147/OTT.S294378. eCollection 2021. Onco Targets Ther. 2021. PMID: 33500626 Free PMC article. Review.
-
Gastric juice non-coding RNAs as potential biomarkers for gastric cancer.Front Physiol. 2023 Apr 26;14:1179582. doi: 10.3389/fphys.2023.1179582. eCollection 2023. Front Physiol. 2023. PMID: 37179825 Free PMC article. Review.
Cited by
-
LncmiRHG-MIR100HG: A new budding star in cancer.Front Oncol. 2022 Sep 23;12:997532. doi: 10.3389/fonc.2022.997532. eCollection 2022. Front Oncol. 2022. PMID: 36212400 Free PMC article. Review.
-
Development of an immunogenic cell death-related lncRNAs signature for prognostic risk assessment in gastric cancer.Transl Cancer Res. 2024 Aug 31;13(8):4420-4440. doi: 10.21037/tcr-24-344. Epub 2024 Aug 27. Transl Cancer Res. 2024. PMID: 39262480 Free PMC article.
-
Analysis and prognostic significance of tumour immune infiltrates and immune microenvironment of m6A-related lncRNAs in patients with gastric cancer.BMC Med Genomics. 2022 Jul 25;15(1):164. doi: 10.1186/s12920-022-01318-5. BMC Med Genomics. 2022. PMID: 35879790 Free PMC article.
-
MIR4435-2HG in exosomes promotes gastric carcinogenesis by inducing M2 polarization in macrophages.Front Oncol. 2022 Nov 22;12:1017745. doi: 10.3389/fonc.2022.1017745. eCollection 2022. Front Oncol. 2022. PMID: 36483041 Free PMC article.
-
Neutrophil estimation and prognosis analysis based on existing lung squamous cell carcinoma datasets: the development and validation of a prognosis prediction model.Transl Lung Cancer Res. 2024 Aug 31;13(8):2023-2037. doi: 10.21037/tlcr-24-411. Epub 2024 Aug 19. Transl Lung Cancer Res. 2024. PMID: 39263021 Free PMC article.
References
-
- Barrett T, Wilhite SE, Ledoux P, Evangelista C, Kim IF, Tomashevsky M, Marshall KA, Phillippy KH, Sherman PM, Holko M, Yefanov A, Lee H, Zhang N, Robertson CL, Serova N, Davis S, Soboleva A. NCBI GEO: archive for functional genomics data sets–update. Nucleic Acids Research. 2013;41:D991–D995. doi: 10.1093/nar/gks1193. - DOI - PMC - PubMed
LinkOut - more resources
Full Text Sources
Other Literature Sources
Miscellaneous
