

Modeling and tracking Covid-19 cases using Big Data analytics on HPCC system platformm
- PMID: 33614394
- PMCID: PMC7883950
- DOI: 10.1186/s40537-021-00423-z
Modeling and tracking Covid-19 cases using Big Data analytics on HPCC system platformm
Abstract
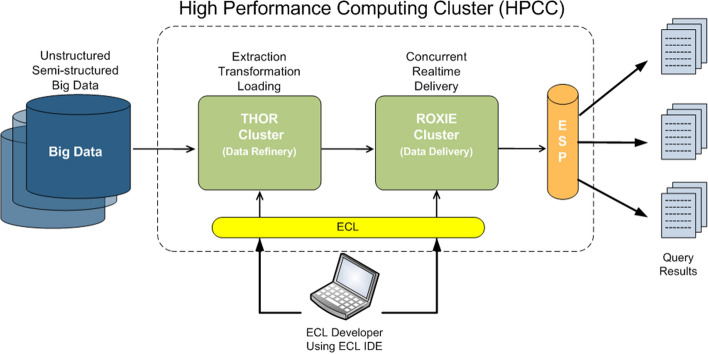
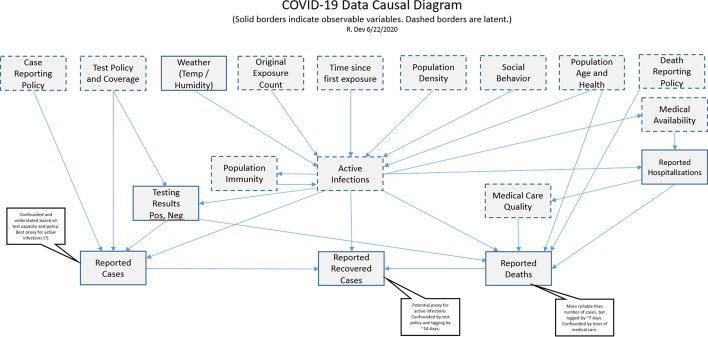
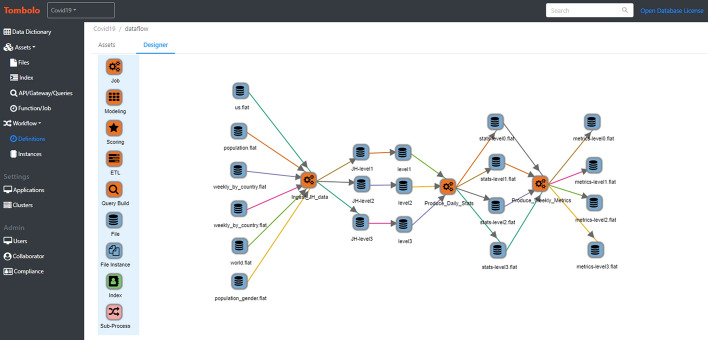
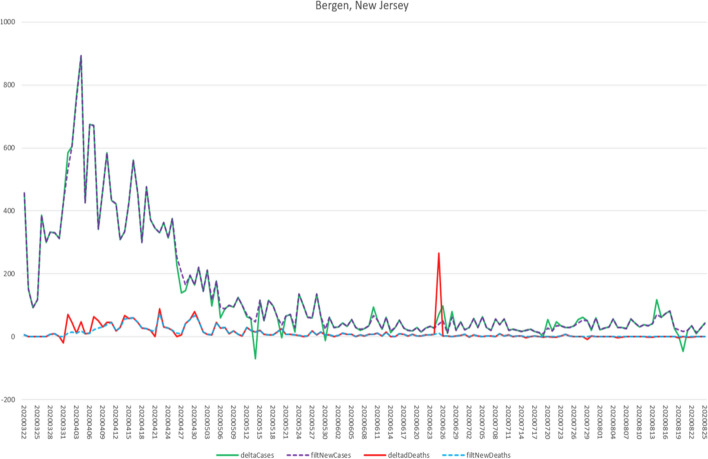
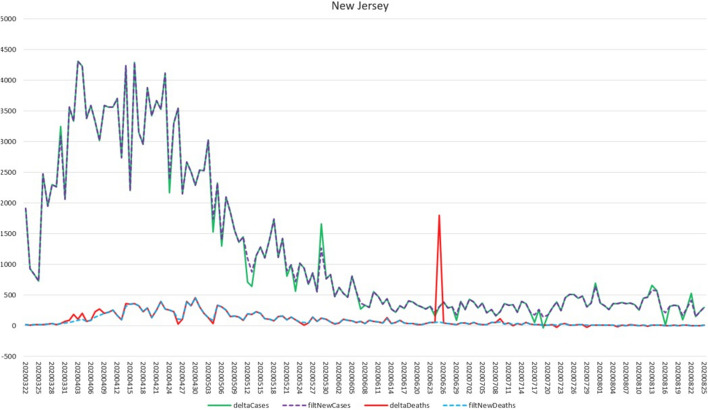
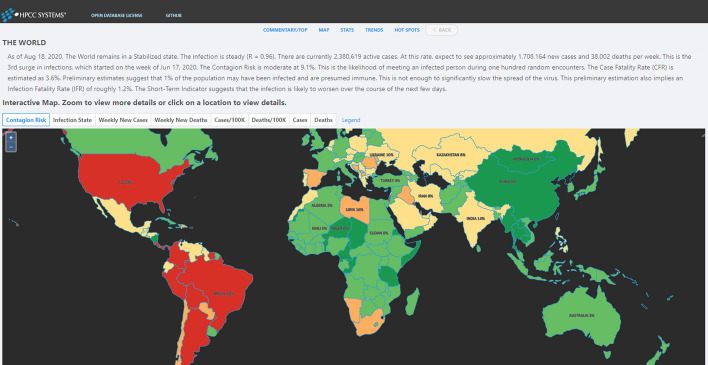
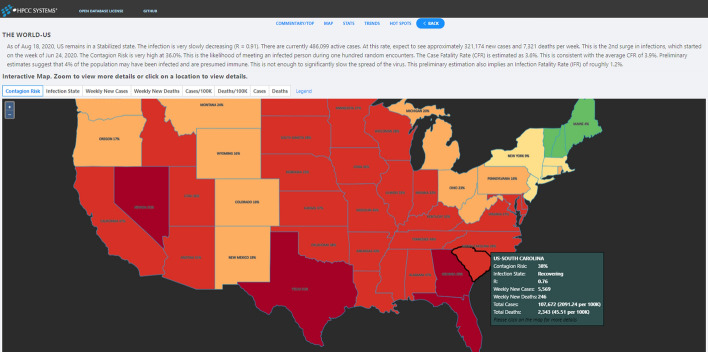
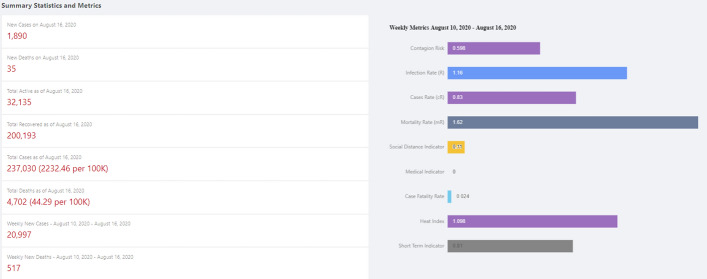
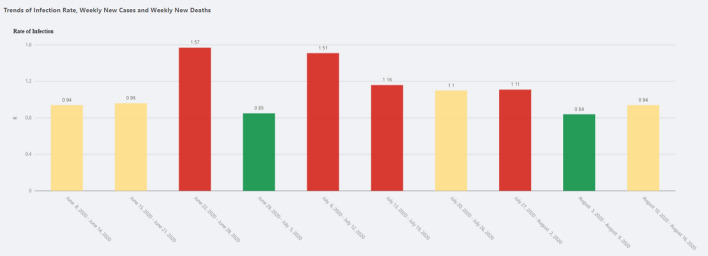
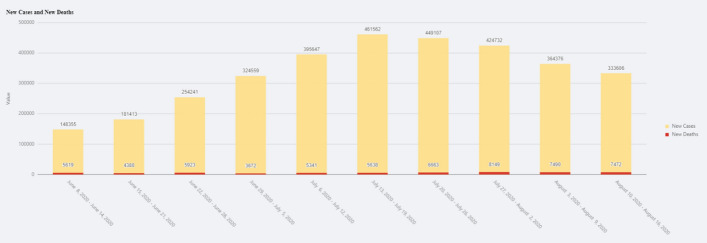
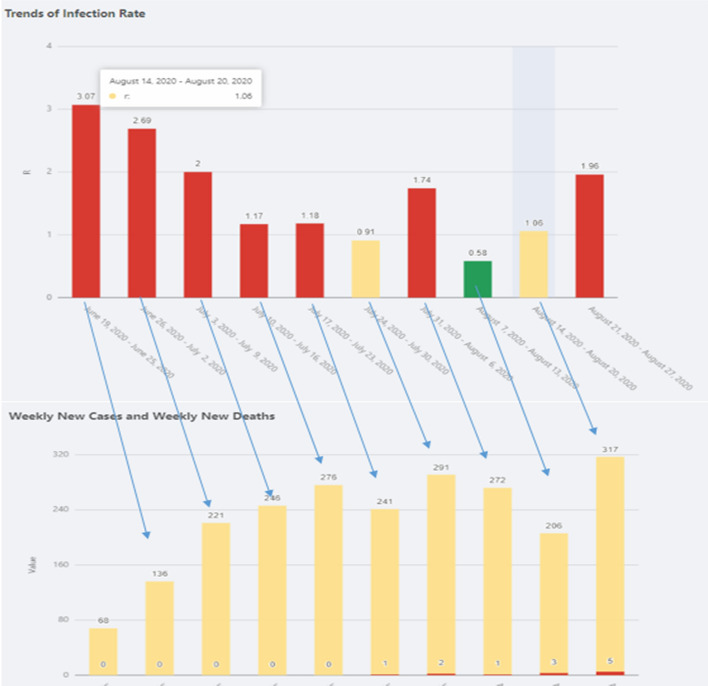
This project is funded by the US National Science Foundation (NSF) through their NSF RAPID program under the title "Modeling Corona Spread Using Big Data Analytics." The project is a joint effort between the Department of Computer & Electrical Engineering and Computer Science at FAU and a research group from LexisNexis Risk Solutions. The novel coronavirus Covid-19 originated in China in early December 2019 and has rapidly spread to many countries around the globe, with the number of confirmed cases increasing every day. Covid-19 is officially a pandemic. It is a novel infection with serious clinical manifestations, including death, and it has reached at least 124 countries and territories. Although the ultimate course and impact of Covid-19 are uncertain, it is not merely possible but likely that the disease will produce enough severe illness to overwhelm the worldwide health care infrastructure. Emerging viral pandemics can place extraordinary and sustained demands on public health and health systems and on providers of essential community services. Modeling the Covid-19 pandemic spread is challenging. But there are data that can be used to project resource demands. Estimates of the reproductive number (R) of SARS-CoV-2 show that at the beginning of the epidemic, each infected person spreads the virus to at least two others, on average (Emanuel et al. in N Engl J Med. 2020, Livingston and Bucher in JAMA 323(14):1335, 2020). A conservatively low estimate is that 5 % of the population could become infected within 3 months. Preliminary data from China and Italy regarding the distribution of case severity and fatality vary widely (Wu and McGoogan in JAMA 323(13):1239-42, 2020). A recent large-scale analysis from China suggests that 80 % of those infected either are asymptomatic or have mild symptoms; a finding that implies that demand for advanced medical services might apply to only 20 % of the total infected. Of patients infected with Covid-19, about 15 % have severe illness and 5 % have critical illness (Emanuel et al. in N Engl J Med. 2020). Overall, mortality ranges from 0.25 % to as high as 3.0 % (Emanuel et al. in N Engl J Med. 2020, Wilson et al. in Emerg Infect Dis 26(6):1339, 2020). Case fatality rates are much higher for vulnerable populations, such as persons over the age of 80 years (> 14 %) and those with coexisting conditions (10 % for those with cardiovascular disease and 7 % for those with diabetes) (Emanuel et al. in N Engl J Med. 2020). Overall, Covid-19 is substantially deadlier than seasonal influenza, which has a mortality of roughly 0.1 %. Public health efforts depend heavily on predicting how diseases such as those caused by Covid-19 spread across the globe. During the early days of a new outbreak, when reliable data are still scarce, researchers turn to mathematical models that can predict where people who could be infected are going and how likely they are to bring the disease with them. These computational methods use known statistical equations that calculate the probability of individuals transmitting the illness. Modern computational power allows these models to quickly incorporate multiple inputs, such as a given disease's ability to pass from person to person and the movement patterns of potentially infected people traveling by air and land. This process sometimes involves making assumptions about unknown factors, such as an individual's exact travel pattern. By plugging in different possible versions of each input, however, researchers can update the models as new information becomes available and compare their results to observed patterns for the illness. In this paper we describe the development a model of Corona spread by using innovative big data analytics techniques and tools. We leveraged our experience from research in modeling Ebola spread (Shaw et al. Modeling Ebola Spread and Using HPCC/KEL System. In: Big Data Technologies and Applications 2016 (pp. 347-385). Springer, Cham) to successfully model Corona spread, we will obtain new results, and help in reducing the number of Corona patients. We closely collaborated with LexisNexis, which is a leading US data analytics company and a member of our NSF I/UCRC for Advanced Knowledge Enablement. The lack of a comprehensive view and informative analysis of the status of the pandemic can also cause panic and instability within society. Our work proposes the HPCC Systems Covid-19 tracker, which provides a multi-level view of the pandemic with the informative virus spreading indicators in a timely manner. The system embeds a classical epidemiological model known as SIR and spreading indicators based on causal model. The data solution of the tracker is built on top of the Big Data processing platform HPCC Systems, from ingesting and tracking of various data sources to fast delivery of the data to the public. The HPCC Systems Covid-19 tracker presents the Covid-19 data on a daily, weekly, and cumulative basis up to global-level and down to the county-level. It also provides statistical analysis for each level such as new cases per 100,000 population. The primary analysis such as Contagion Risk and Infection State is based on causal model with a seven-day sliding window. Our work has been released as a publicly available website to the world and attracted a great volume of traffic. The project is open-sourced and available on GitHub. The system was developed on the LexisNexis HPCC Systems, which is briefly described in the paper.
Keywords: Big Data; Covid-19; HPCC system; Modeling Corona spread; SARS-Cov-2; Spreading indicators.
© The Author(s) 2021.
Figures
Similar articles
-
Heterogeneity in transmissibility and shedding SARS-CoV-2 via droplets and aerosols.Elife. 2021 Apr 16;10:e65774. doi: 10.7554/eLife.65774. Elife. 2021. PMID: 33861198 Free PMC article.
-
Estimating global, regional, and national daily and cumulative infections with SARS-CoV-2 through Nov 14, 2021: a statistical analysis.Lancet. 2022 Jun 25;399(10344):2351-2380. doi: 10.1016/S0140-6736(22)00484-6. Epub 2022 Apr 8. Lancet. 2022. PMID: 35405084 Free PMC article.
-
Letter to the Editor: THE IMPACT OF THE COVID-19 PANDEMIC ON SCHIZOPHRENIA PATIENTS.Turk Psikiyatri Derg. 2021 Fall;32(3):219-221. doi: 10.5080/u26175. Turk Psikiyatri Derg. 2021. PMID: 34637131 English, Turkish.
-
The Rapid Development and Early Success of Covid 19 Vaccines Have Raised Hopes for Accelerating the Cancer Treatment Mechanism.Arch Razi Inst. 2021 Mar;76(1):1-6. doi: 10.22092/ari.2021.353761.1612. Epub 2021 Mar 1. Arch Razi Inst. 2021. PMID: 33818952 Free PMC article.
-
Reconstruction of a resilient and secure community and medical care system in the coronavirus era - English translation of the Japanese opinion released from the Science Council of Japan.Geriatr Gerontol Int. 2025 Apr;25(4):481-490. doi: 10.1111/ggi.15073. Epub 2025 Feb 19. Geriatr Gerontol Int. 2025. PMID: 39970940 Free PMC article.
Cited by
-
COVID-19 multiwaves as multiphase percolation: a general N-sigmoidal equation to model the spread.Eur Phys J Plus. 2023;138(5):393. doi: 10.1140/epjp/s13360-023-04014-0. Epub 2023 May 8. Eur Phys J Plus. 2023. PMID: 37192840 Free PMC article.
-
Big data in corneal diseases and cataract: Current applications and future directions.Front Big Data. 2023 Feb 1;6:1017420. doi: 10.3389/fdata.2023.1017420. eCollection 2023. Front Big Data. 2023. PMID: 36818823 Free PMC article. Review.
-
Forecasting COVID-19 Pandemic Using Prophet, ARIMA, and Hybrid Stacked LSTM-GRU Models in India.Comput Math Methods Med. 2022 May 5;2022:1556025. doi: 10.1155/2022/1556025. eCollection 2022. Comput Math Methods Med. 2022. PMID: 35529266 Free PMC article.
-
Quantifying the Regional Disproportionality of COVID-19 Spread: Modeling Study.JMIR Form Res. 2025 Jan 3;9:e59230. doi: 10.2196/59230. JMIR Form Res. 2025. PMID: 39757976 Free PMC article.
-
The forecast of COVID-19 spread risk at the county level.J Big Data. 2021;8(1):99. doi: 10.1186/s40537-021-00491-1. Epub 2021 Jul 7. J Big Data. 2021. PMID: 34249603 Free PMC article.
References
-
- Emanuel EJ, et al. Fair allocation of scarce medical resources in the time of covid-19. N Engl J Med. 2020. - PubMed
-
- Shaw J, Villanustre F, Furht B, Agarwal A, Jain A. Modeling Ebola Spread and Using HPCC/KEL System. In: Big Data Technologies and Applications 2016 (pp. 347-385). Springer, Cham..
LinkOut - more resources
Full Text Sources
Other Literature Sources
Miscellaneous