. 2021 Mar:36:100803.
doi: 10.1016/j.uclim.2021.100803. Epub 2021 Feb 13.

Air pollution and COVID-19 lockdown in a large South American city: Santiago Metropolitan Area, Chile

Affiliations

Air pollution and COVID-19 lockdown in a large South American city: Santiago Metropolitan Area, Chile

Richard Toro A et al. Urban Clim. 2021 Mar.

Abstract

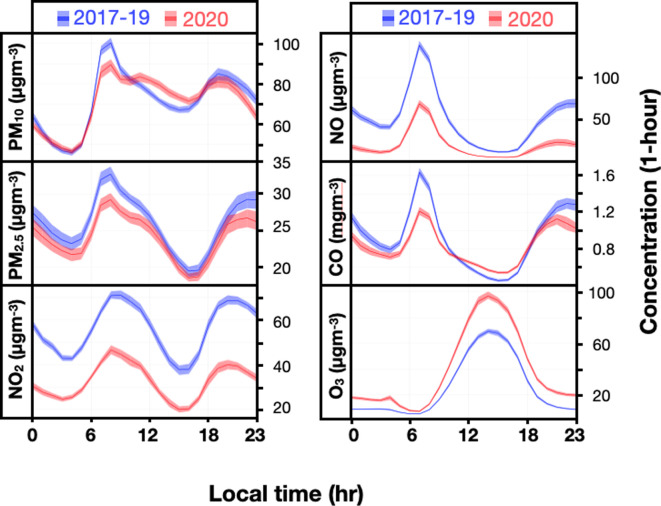
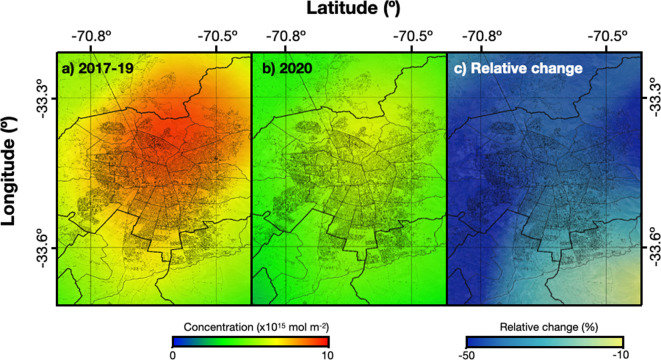
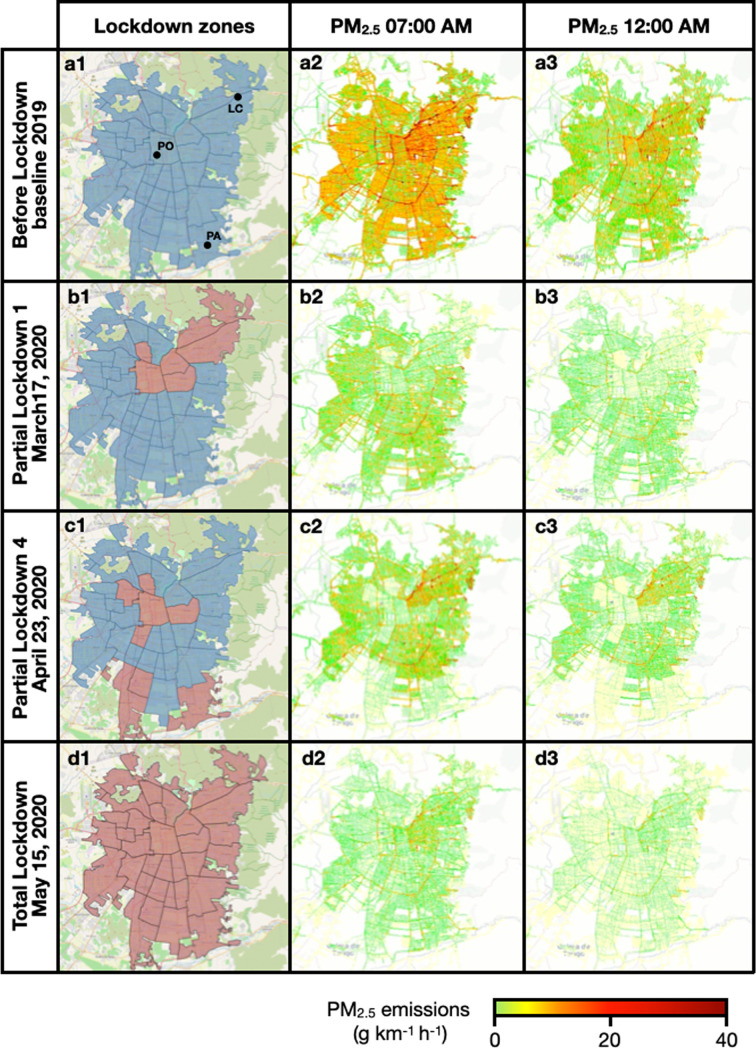
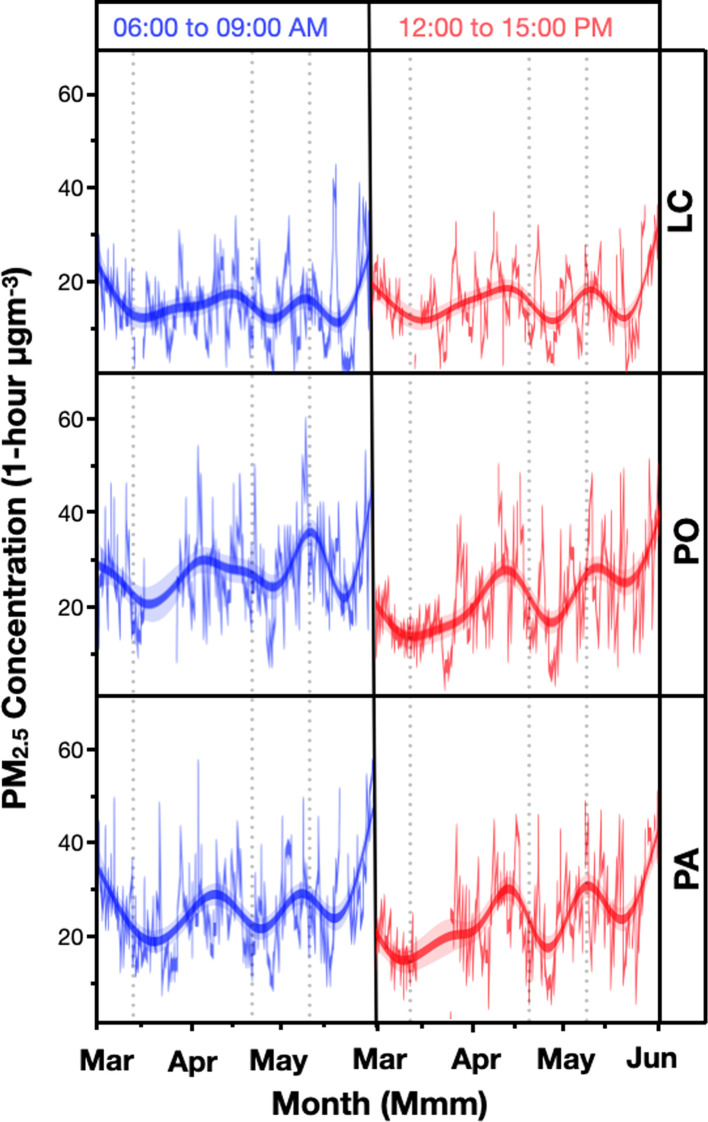
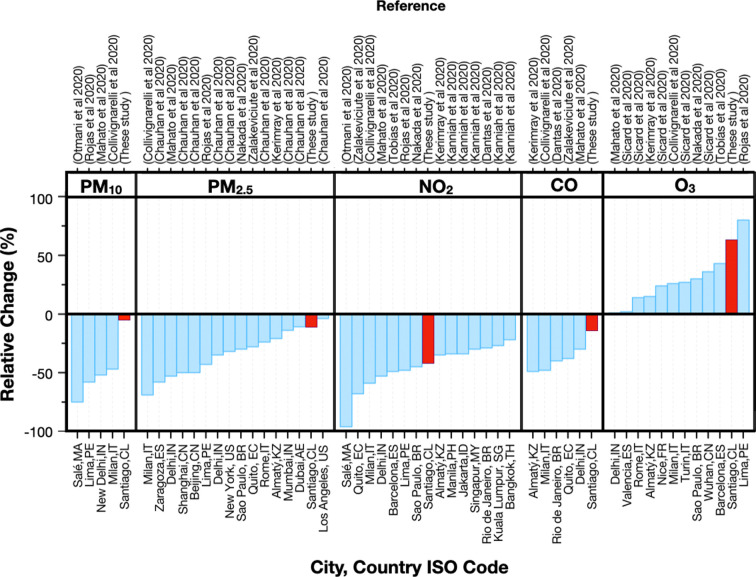
The implementation of confinement and physical distancing measures to restrict people's activities and transit in the midst of the COVID-19 pandemic allowed us to study how these measures affect the air quality in urban areas with high pollution rates, such as Santiago, Chile. A comparative study between the concentrations of PM10, PM2.5, NOx, CO, and O3 during the months of March to May 2020 and the corresponding concentrations during the same period in 2017-2019 is presented. A combination of surface measurements from the air quality monitoring network of the city, remote satellite measurements, and simulations of traffic activity and road transport emissions allowed us to quantify the change in the average concentrations of each pollutant. Average relative changes of traffic emissions (between 61% and 68%) implied statistically significant concentrations reductions of 54%, 13%, and 11% for NOx, CO, and PM2.5, respectively, during the pandemic period compared to historical period. In contrast, the average concentration of O3 increased by 63% during 2020 compared to 2017-2019. The nonlinear response observed in the pollution levels can be attributed to the changes in the vehicular emission patterns during the pandemic and to the role of other sources such as residential emissions or secondary PM.

Keywords: COVID-19 lockdown; Traffic emission rates; Urban air quality.


Conflict of interest statement

The authors declare that they have no known competing financial interests or personal relationships that could have appeared to influence the work reported in this paper.

Figures

Unlabelled Image
Graphical abstract
Fig. 1
Fig. 1
Evolution of the number of confirmed cases of COVID-19 infections in Chile (red) and in the Santiago Metropolitan Area (SMA, dashed orange) and the percentage change in the use of public transport (dotted green). Source data: MINSAL 2020. (For interpretation of the references to colour in this figure legend, the reader is referred to the web version of this article.)
Fig. 2
Fig. 2
Daily variability of pollutants concentrations for the historical (2017–2019) and current periods (2020).
Fig. 3
Fig. 3
Spatial distributions of the mean concentrations of NO2 (satellite data) in SMA during March 15 to May 31, 2017–2019 (a) and March 15 to May 31, 2020 (b), along with the percentage changes (c).
Fig. 4
Fig. 4
Lockdown geographical coverage and differences in PM2,5 emissions comparing 2020 and 2019 in the SMA.. Colour legend: blue means zones (communes) without mandatory confinement, red indicates zones with mandatory confinement. Mandatory lockdowns started on March 27 for 7 northeast communes (partial lockdown 1). On April 23 a group of 8 central-southern communes were under confinement (partial lockdown 4), moving into total lockdown from May 15 onwards. Black dots in figure a1 show three areas of the city (LC: Las Condes; PO: Parque O'Higgins and PA: Puente Alto). (For interpretation of the references to colour in this figure legend, the reader is referred to the web version of this article.)
Fig. 5
Fig. 5
Time series of 1-h PM2.5 concentrations from March to May 2020; in the morning (06:00 to 09:00 AM) and afternoon (12:00 to 15:00 PM) periods at three air quality monitoring stations of the SMA (LC: Las Condes; PO: Parque O'Higgins and PA: Puente Alto, see Figure 4a1). Dotted gray lines indicate the days March 17, April 23 and May 15.
Fig. 6
Fig. 6
Comparison of relative changes in the concentration of atmospheric pollutants due to countermeasures against COVID-19 in cities around the world (SMA in red). (Collivignarelli et al., 2020; Dantas et al., 2020; Mahato et al., 2020; Nakada and Urban, 2020; Tobías et al., 2020; Rojas et al., 2021; Chauhan and Singh, 2020; Kanniah et al., 2020; Kerimray et al., 2020; Otmani et al., 2020; Sicard et al., 2020) (For interpretation of the references to colour in this figure legend, the reader is referred to the web version of this article.)

References

    1. Abdullah S., Mansor A.A., Napi N.N.L.M., Mansor W.N.W., Ahmed A.N., Ismail M., Ramly Z.T.A. Air quality status during 2020 Malaysia movement control order (MCO) due to 2019 novel coronavirus (2019-nCoV) pandemic. Sci. Total Environ. 2020;729:139022. - PMC - PubMed
    1. Anjum N.A. 2020. Good in the Worst: COVID-19 Restrictions and Ease in Global Air Pollution.
    1. Bao R., Zhang A. Does lockdown reduce air pollution? Evidence from 44 cities in northern China. Sci. Total Environ. 2020;139052 - PMC - PubMed
    1. Berman J.D., Ebisu K. Changes in U.S. air pollution during the COVID-19 pandemic. Sci. Total Environ. 2020:139864. - PMC - PubMed
    1. Carslaw D. University of York and Ricardo Energy & Environment; 2019. The openair manual open-source tools for analysing air pollution data, version: 12th November 2019.https://bit.ly/2zIdmMO Available online. accesed date: March 2020.

LinkOut - more resources