. 2021 Feb 4:8:608544.
doi: 10.3389/fcell.2020.608544. eCollection 2020.

PTEN Reduces BMP9-Induced Osteogenic Differentiation Through Inhibiting Wnt10b in Mesenchymal Stem Cells

Affiliations

PTEN Reduces BMP9-Induced Osteogenic Differentiation Through Inhibiting Wnt10b in Mesenchymal Stem Cells

Fu-Shu Li et al. Front Cell Dev Biol. .

Abstract

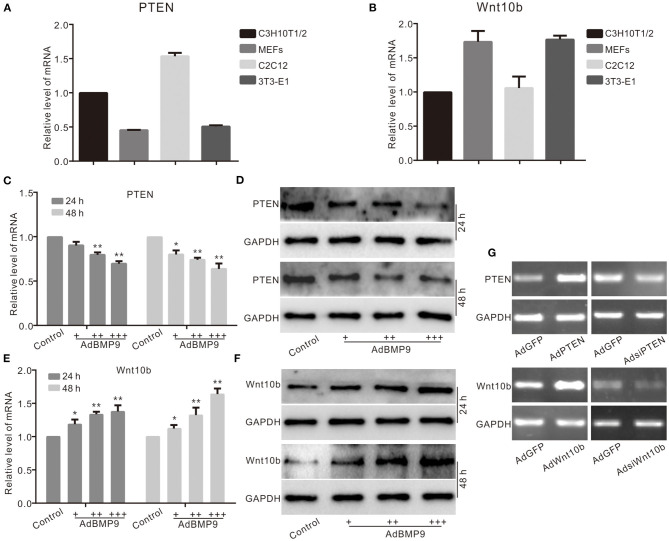
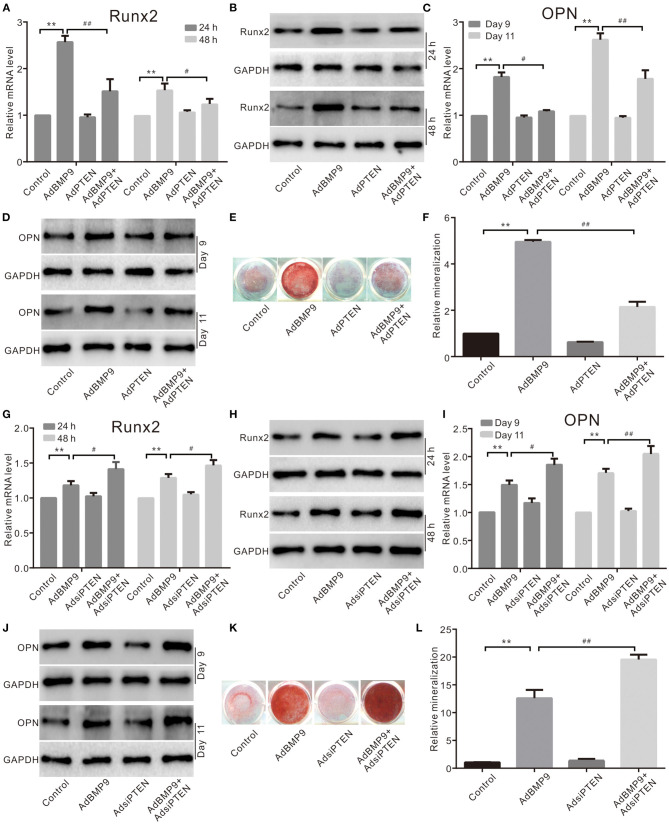
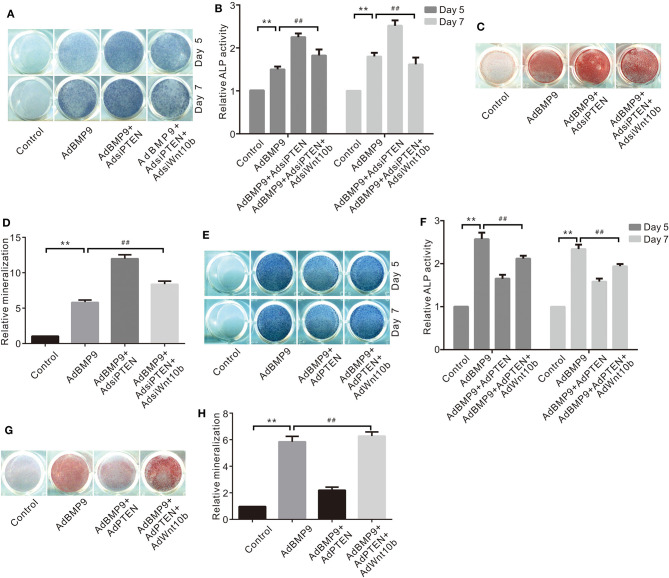
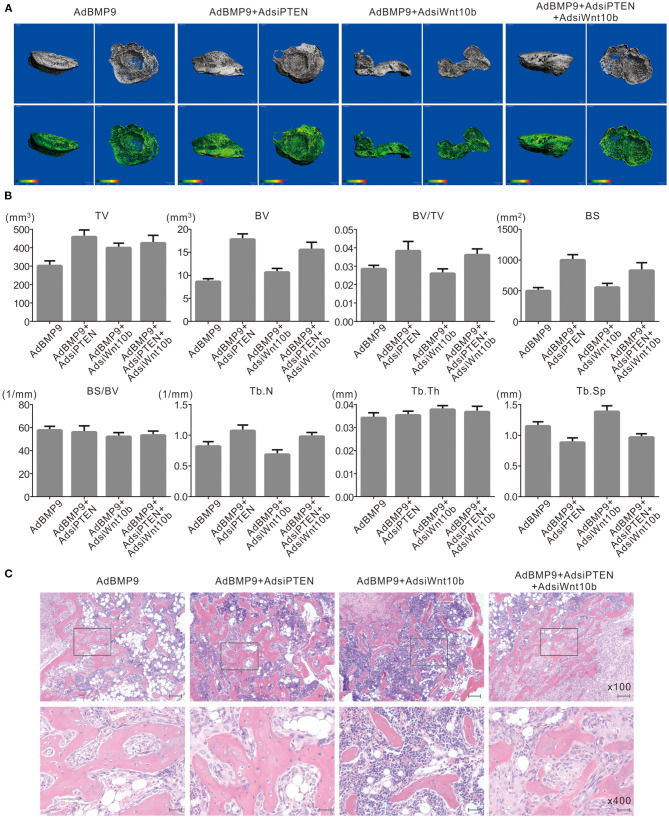
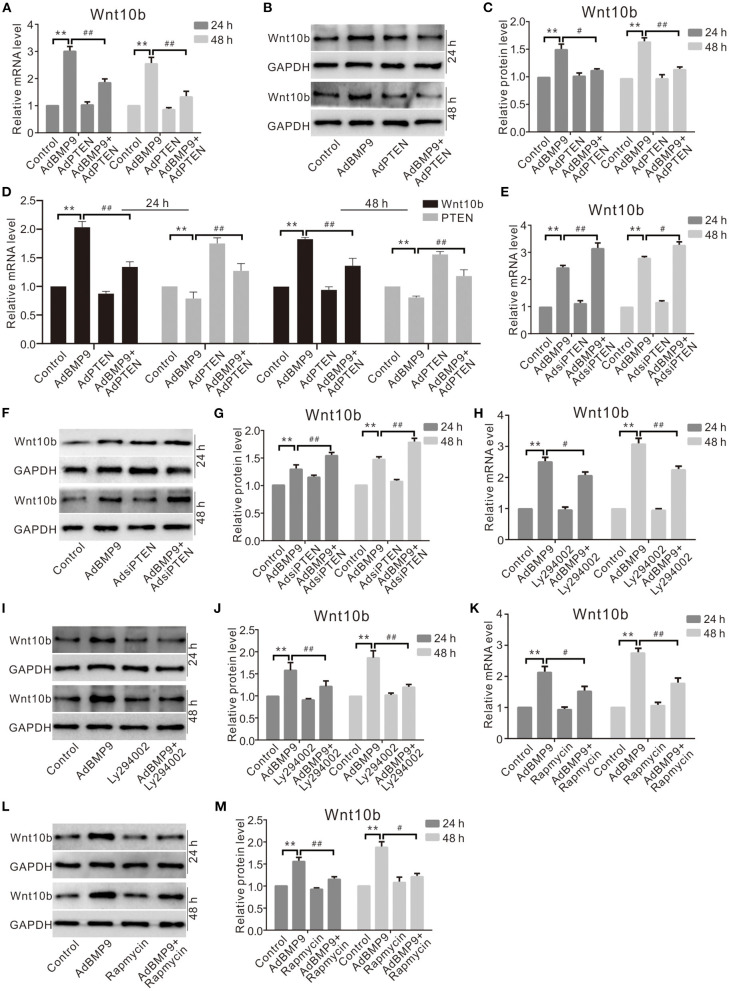
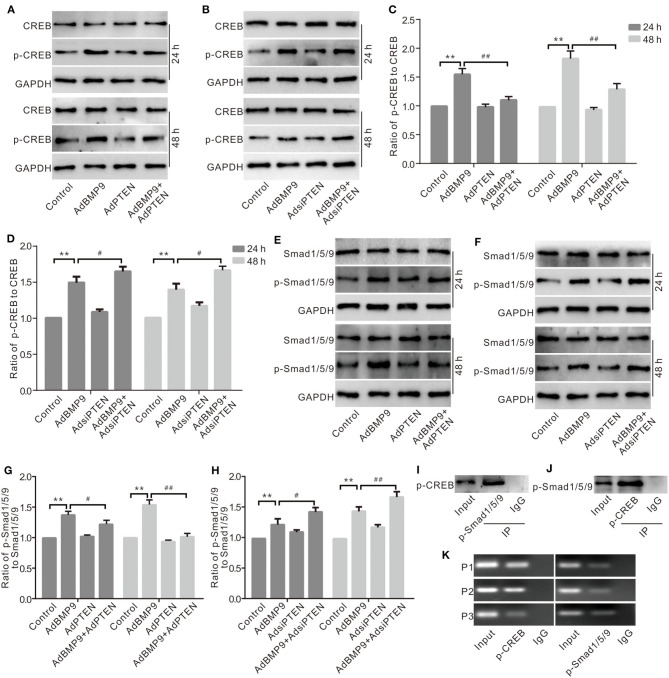
Bone morphogenetic protein 9 (BMP9) is one of the most efficacious osteogenic cytokines. PTEN and Wnt10b are both implicated in regulating the osteogenic potential of BMP9, but the potential relationship between them is unknown. In this study, we determined whether PTEN could reduce the expression of Wnt10b during the osteogenic process initialized by BMP9 in mesenchymal stem cells (MSCs) and the possible molecular mechanism. We find that PTEN is inhibited by BMP9 in MSCs, but Wnt10b is increased simultaneously. The BMP9-induced osteogenic markers are reduced by PTEN but increased by silencing PTEN. The effects of knockdown PTEN on elevating BMP9-induced osteogenic markers are almost abolished by knockdown of Wnt10b. On the contrary, the BMP9-increased ALP activities and mineralization are both inhibited by PTEN but almost reversed by the combination of Wnt10b. Bone masses induced by BMP9 are enhanced by knockdown of PTEN, which is reduced by knockdown of Wnt10b. The BMP9-increased Wnt10b is decreased by PTEN but enhanced by knockdown of PTEN. Meanwhile, the BMP9-induced Wnt10b is also reduced by a PI3K-specific inhibitor (Ly294002) or rapamycin, respectively. The BMP9-induced phosphorylation of CREB or Smad1/5/9 is also reduced by PTEN, but enhanced by PTEN knockdown. In addition, p-CREB interacts with p-Smad1/5/9 in MSCs, and p-CREB or p-Smad1/5/9 are both enriched at the promoter region of Wnt10b. Our findings indicate that inhibitory effects of PTEN on BMP9's osteogenic potential may be partially mediated through decreasing the expression of Wnt10b via the disturbance of interaction between CREB and BMP/Smad signaling.

Keywords: BMP9; WNT10B; mesenchymal stem cell; osteogenic differentiation; phosphatase and tensin homolog deleted on chromosome 10.


Conflict of interest statement

The authors declare that the research was conducted in the absence of any commercial or financial relationships that could be construed as a potential conflict of interest.

Figures

Figure 1
Figure 1
Effects of BMP9 on PTEN and Wnt10b in multiple progenitor cells. (A) Real-time PCR assay results show the endogenous mRNA expression of PTEN in different progenitor cells. (B) Real-time PCR assay results show the endogenous mRNA expression of Wnt10b in these progenitor cells. (C) Real-time PCR assay results show the effect of BMP9 on mRNA expression of PTEN in C3H10T1/2 cells (*p < 0.05, **p < 0.01 vs. control). (D) Western blot assay results show the effect of BMP9 on PTEN in C3H10T1/2 cells. (E) Real-time PCR assay results show the effect of BMP9 on Wnt10b in C3H10T1/2 cells (*p < 0.05, **p < 0.01 vs. control). (F) Western blot assay results show the effect of BMP9 on Wnt10b in C3H10T1/2 cells. (G) PCR assay results show the effect of recombinant adenoviruses on the mRNA level of PTEN or Wnt10b in C3H10T1/2 cells.
Figure 2
Figure 2
Effects of PTEN on BMP9-induced osteogenic markers in C3H10T1/2 cells. (A) Real-time PCR assay shows the effect of PTEN and/or BMP9 on the mRNA expression of Runx2 in C3H10T1/2 cells (**p < 0.01 vs. control; #p < 0.05 and ##p < 0.01). (B) Western blot assay shows the effect of PTEN and/or BMP9 on Runx2 in C3H10T1/2 cells. (C) Real-time PCR assay shows the effect of PTEN and/or BMP9 on the mRNA expression of OPN in C3H10T1/2 cells (**p < 0.01 vs. control; #p < 0.05 and ##p < 0.01). (D) Western blot assay shows the effect of PTEN and/or BMP9 on OPN in C3H10T1/2 cells. (E) Alizarin Red S staining shows the effect of PTEN and/or BMP9 on mineralization in C3H10T1/2 cells. (F) Quantification of Alizarin Red S staining shows the effect of PTEN and/or BMP9 on mineralization in C3H10T1/2 cells (**p < 0.01 vs. control; ##p < 0.01). (G) Real-time PCR assay shows the effect of BMP9 and/or PTEN knockdown on Runx2 in C3H10T1/2 cells (**p < 0.01 vs. control; ##p < 0.01). (H) Western blot assay shows the effect of BMP9 and/or PTEN knockdown on Runx2 in C3H10T1/2 cells. (I) Real-time PCR assay shows the effect of BMP9 and/or PTEN knockdown on OPN in C3H10T1/2 cells (**p < 0.01 vs. control; #p < 0.05 and ##p < 0.01). (J) Western blot assay shows the effect of BMP9 and/or PTEN knockdown on OPN in C3H10T1/2 cells. (K) Alizarin Red S staining shows the effect of BMP9 and/or PTEN knockdown on mineralization in C3H10T1/2 cells. (L) Quantification results of Alizarin Red S staining show the effect of BMP9 and/or PTEN knockdown on mineralization in C3H10T1/2 cells (**p < 0.01 vs. control; ##p < 0.01).
Figure 3
Figure 3
Effects of Wnt10b and/or PTEN on BMP9-Induced Osteogenic Markers in C3H10T1/2 Cells. (A) Histochemical staining results show the effect of PTEN knockdown and/or Wnt10b knockdown on ALP activities induced by BMP9. (B) Quantification results of histochemical staining show the effect of PTEN knockdown and/or Wnt10b knockdown on ALP activities induced by BMP9 (**p < 0.01 vs. control, ##p < 0.01). (C) Alizarin Red S staining results show effects of PTEN knockdown and/or Wnt10b knockdown on ALP activities induced by BMP9. (D) Quantification results of Alizarin Red S staining show effects of PTEN knockdown and/or Wnt10b knockdown on ALP activities induced by BMP9 (**p < 0.01 vs. control, ##p < 0.01). (E) Histochemical staining results show the effect of PTEN and/or Wnt10b on ALP activities induced by BMP9. (F) Quantification results of histochemical staining show the effect of PTEN and/or Wnt10b on ALP activities induced by BMP9 (**p < 0.01 vs. control, ##p < 0.01). (G) Alizarin Red S staining results show effects of PTEN and/or Wnt10b on ALP activities induced by BMP9. (H) Quantification results of Alizarin Red S staining show effects of PTEN and/or Wnt10b on ALP activities induced by BMP9 (**p < 0.01 vs. control, ##p < 0.01).
Figure 4
Figure 4
Effects of Wnt10b and PTEN on BMP9-induced osteogenesis in C3H10T1/2 cells. (A) 3-D reconstruction of μ-CT scanning results shows the effect of silencing Wnt10b and/or PTEN on BMP9-induced bone formation in C3H10T1/2 cells (representative data are shown). (B) Quantitative analysis μ-CT scanning results show the effect of silencing Wnt10b and/or silencing PTEN on BMP9-induced bone formation in C3H10T1/2 cells (TV, total volume; BV, bone volume; BS, bone surface area; Tb.N, trabecular number; Tb.Th, trabecular thickness; Tb.Sp, trabecular separation). (C) H and E staining results show the effect of silencing Wnt10b and/or PTEN on BMP9-induced bone formation in C3H10T1/2 cells (Scale is 200 μm for upper panel; scale bar is 50 μm for lower panel).
Figure 5
Figure 5
Effects of PTEN, PI3K, or mTOR on Wnt10b induced by BMP9 in C3H10T1/2 cells. (A) Real-time PCR assay shows the effect of PTEN and/or BMP9 on Wnt10b in C3H10T1/2 cells (**p < 0.01 vs. control; #p < 0.05 and ##p < 0.01 vs. groups treated with BMP9 only). (B) Western blot assay shows effects of PTEN and/or BMP9 on Wnt10b in C3H10T1/2 cells. (C) Quantification of Western blot assay shows effect of PTEN and/or BMP9 on Wnt10b in C3H10T1/2 cells (**p < 0.01 vs. control; ##p < 0.01 vs. groups treated with BMP9 only). (D) Real-time PCR results show the effect of exogenous PTEN and/or BMP9 on Wnt10b in C3H10T1/2 cells as well as PTEN (**p < 0.01 vs. control). (E) Real-time PCR assay shows the effect of PTEN knockdown and/or BMP9 on Wnt10b in C3H10T1/2 cells (**p < 0.01 vs. control; ##p < 0.01 vs. groups treated with BMP9 only). (F) Western blot assay shows the effect of PTEN knockdown and/or BMP9 on Wnt10b in C3H10T1/2 cells. (G) Quantification of Western blot assay shows the effect of PTEN knockdown and/or BMP9 on Wnt10b in C3H10T1/2 cells (**p < 0.01 vs. control; #p < 0.05 and ##p < 0.01 vs. groups treated with BMP9 only). (H) Real-time PCR assay shows effects of Ly294002 and/or BMP9 on Wnt10b in C3H10T1/2 cells (**p < 0.01 vs. control; ##p < 0.01 vs. groups treated with BMP9 only). (I) Western blot assay shows the effect of Ly294002 and/or BMP9 on the level of Wnt10b in C3H10T1/2 cells. (J) Quantification of Western blot assay shows effects of Ly294002 and/or BMP9 on Wnt10b in C3H10T1/2 cells (**p < 0.01 vs. control; ##p < 0.01 vs. groups treated with BMP9 only). (K) Real-time PCR assay shows the effect of rapamycin and/or BMP9 on Wnt10b in C3H10T1/2 cells (**p < 0.01 vs. control; ##p < 0.01 vs. groups treated with BMP9 only). (L) Western blot assay shows the effect of rapamycin and/or BMP9 on Wnt10b in C3H10T1/2 cells. (M) Quantification of Western blot assay shows effect of rapamycin and/or BMP9 on Wnt10b in C3H10T1/2 cells (**p < 0.01 vs. control; #p < 0.05 and ##p < 0.01 vs. groups treated with BMP9 only).
Figure 6
Figure 6
Effects of CREB and BMP/Smad signaling on the expression of Wnt10b in C3H10T1/2 cells. (A) Western blot assay shows the effect of PTEN and/or BMP9 on CREB and phospho-CREB (p-CREB) in C3H10T1/2 cells. (B) Western blot assay shows the effect of PTEN knockdown and/or BMP9 on CREB and p-CREB in C3H10T1/2 cells. (C) Quantification of Western blot assay shows the effect of PTEN and/or BMP9 on p-CREB in C3H10T1/2 cells (**p < 0.01 vs. control; #p < 0.05 and ##p < 0.01 vs. groups treated with BMP9 only). (D) Quantification of Western blot assay shows effect of PTEN knockdown and/or BMP9 on p-CREB in C3H10T1/2 cells (**p < 0.01 vs. control; #p < 0.05 and ##p < 0.01 vs. groups treated with BMP9 only). (E) Western blot assay shows the effect of PTEN and/or BMP9 on Smad1/5/9 and p-Smad1/5/9 in C3H10T1/2 cells. (F) Western blot assay shows the effect of PTEN knockdown and/or BMP9 on Smad1/5/9 and p-Smad1/5/9 in C3H10T1/2 cells. (G) Quantification of Western blot assay shows the effect of PTEN and/or BMP9 on p-Smad1/5/9 in C3H10T1/2 cells (**p < 0.01 vs. control; ##p < 0.01 vs. groups treated with BMP9 only). (H) Quantification of Western blot assay shows effect of PTEN knockdown and/or BMP9 on p-Smad1/5/9 in C3H10T1/2 cells (**p < 0.01 vs. control; ##p < 0.01 vs. groups treated with BMP9 only). (I) IP assay shows the interaction between p-Smad1/5/9 and p-CREB in C3H10T1/2 cells. (J) IP assay shows the interaction between p-CREB and p-Smad1/5/9 in C3H10T1/2 cells. (K) ChIP assay shows the enrichment of p-CREB or p-Smad1/5/9 in the promoter region of Wnt10b C3H10T1/2 cells.

Similar articles

Cited by

References

    1. Aslanidi G., Kroutov V., Philipsberg G., Lamb K., Campbell-Thompson M., Walter G. A., et al. (2007). Ectopic expression of Wnt10b decreases adiposity and improves glucose homeostasis in obese rats. Am. J. Physiol. Endocrinol. Metab. 293, E726–E736. 10.1152/ajpendo.00248.2007 - DOI - PubMed
    1. Balemans W., Ebeling M., Patel N., Van Hul E., Olson P., Dioszegi M., et al. . (2001). Increased bone density in sclerosteosis is due to the deficiency of a novel secreted protein (SOST). Hum. Mol. Genet. 10, 537–543. 10.1093/hmg/10.5.537 - DOI - PubMed
    1. Baron R., Rawadi G. (2007). Targeting the Wnt/beta-catenin pathway to regulate bone formation in the adult skeleton. Endocrinology 148, 2635–2643. 10.1210/en.2007-0270 - DOI - PubMed
    1. Bazzichetto C., Conciatori F., Pallocca M., Falcone I., Fanciulli M., Cognetti F., et al. . (2019). PTEN as a prognostic/predictive biomarker in cancer: an unfulfilled promise? Cancers (Basel) 11:435. 10.3390/cancers11040435 - DOI - PMC - PubMed
    1. Bennett C. N., Longo K. A., Wright W. S., Suva L. J., Lane T. F., Hankenson K. D., et al. . (2005). Regulation of osteoblastogenesis and bone mass by Wnt10b. Proc. Natl. Acad. Sci. U. S. A. 102, 3324–3329. 10.1073/pnas.0408742102 - DOI - PMC - PubMed