. 2021 Feb 4:9:607332.
doi: 10.3389/fcell.2021.607332. eCollection 2021.

The BMP2 Signaling Axis Promotes Invasive Differentiation of Human Trophoblasts

Affiliations

The BMP2 Signaling Axis Promotes Invasive Differentiation of Human Trophoblasts

Jiali You et al. Front Cell Dev Biol. .

Abstract

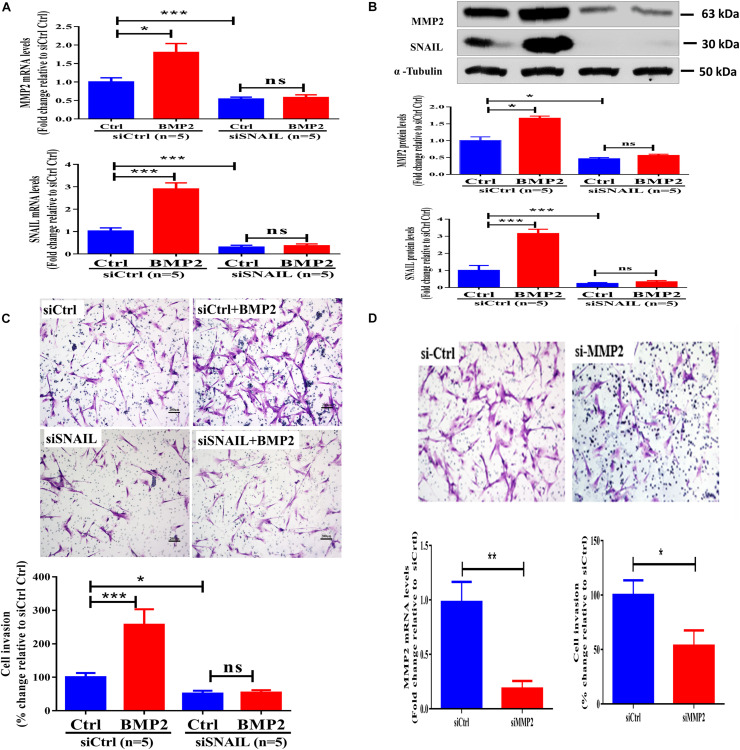
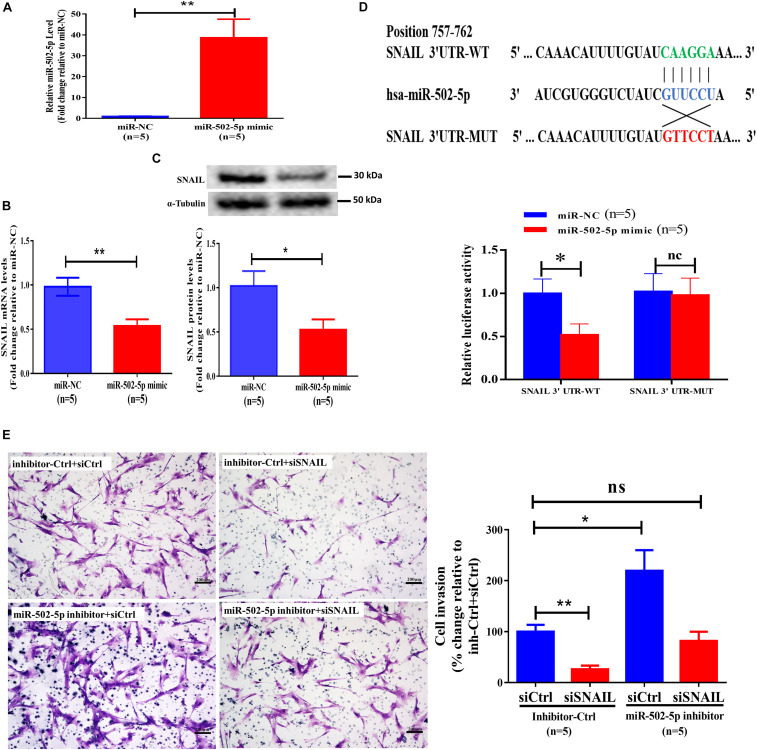
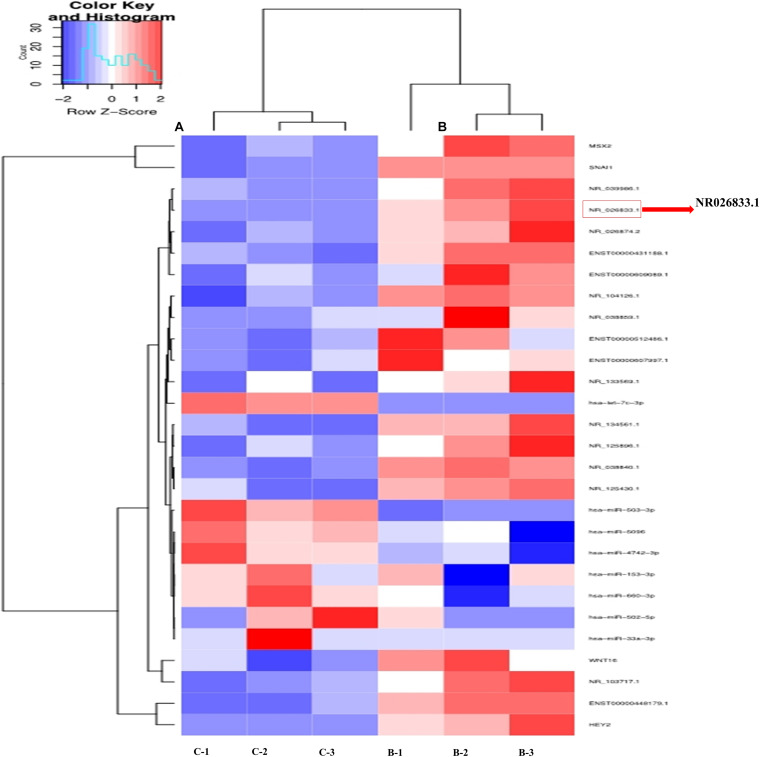
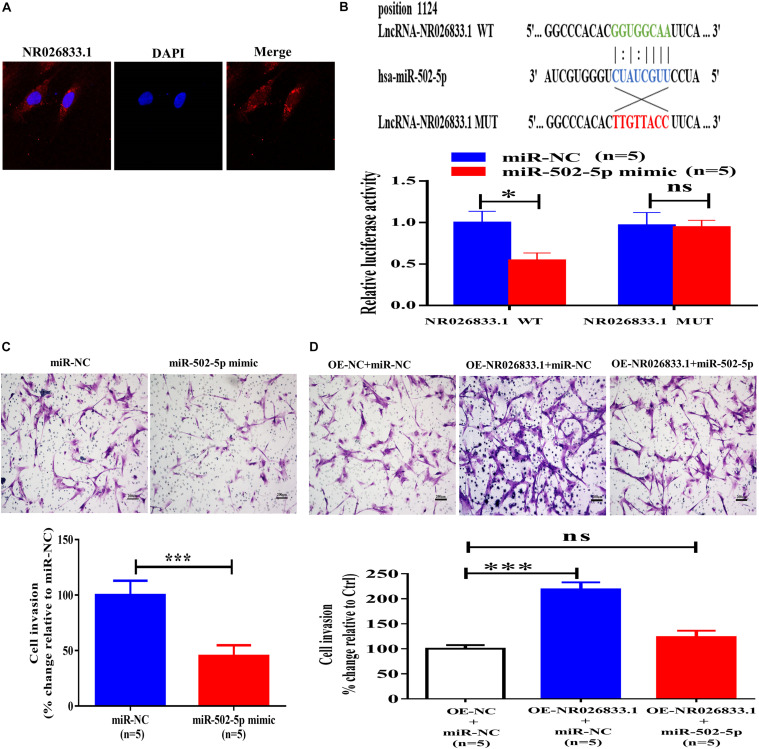
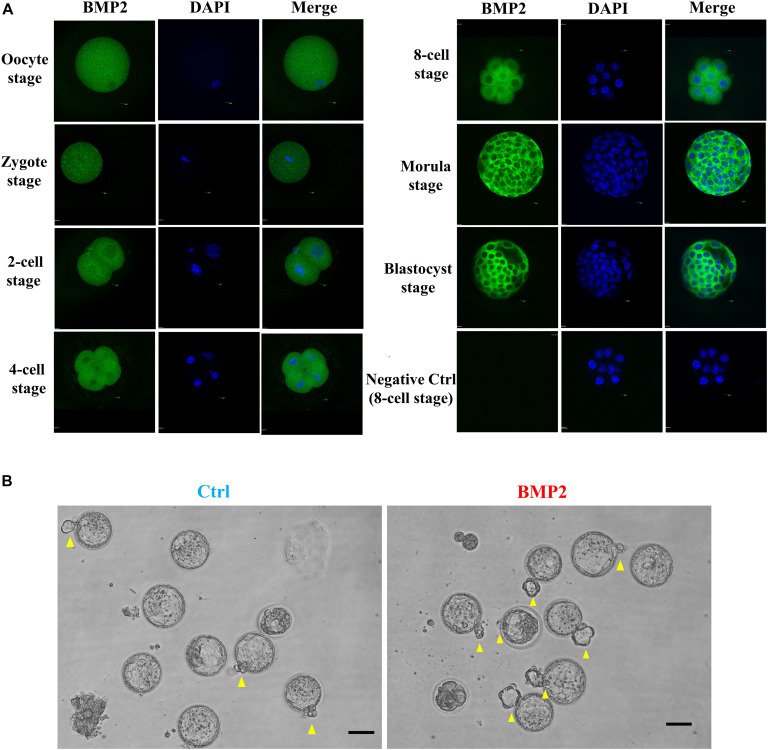
Embryo implantation and trophoblast invasion are principal limiting factors of pregnancy establishment. Aberrant embryo development or improper trophoblast differentiation and invasion may lead to various unfavorable pregnancy-related outcomes, including early pregnancy loss (EPL). Our clinical data show that the serum BMP2 levels were significantly increased during the first trimester of pregnancy and that the serum and BMP2 expression levels were lower in women with EPL than in women with normal early pregnancies. Moreover, we observed that BMP2 was expressed in oocytes and trophoblast cells of cleaved embryos and blastocysts prior to implantation in both humans and mice. Exogenous BMP2 promoted embryonic development by enhancing blastocyst formation and hatching in mice. LncRNA NR026833.1 was upregulated by BMP2 and promoted SNAIL expression by competitively binding to miR-502-5p. SNAIL induced MMP2 expression and promoted cell invasion in primary extravillous trophoblast cells. BMP2 promotes the invasive differentiation of mouse trophoblast stem cells by downregulating the expression of TS cell marker and upregulating the expression of trophoblast giant cell marker and labyrinthine/spongiotrophoblast marker. Our findings provide significant insights into the regulatory roles of BMP2 in the development of the placenta, which may give us a framework to explore new therapeutic strategies to pregnancy-related complications.

Keywords: BMP2; early pregnancy loss; embryo development; lncRNA; trophoblast differentiation; trophoblast invasion.


Conflict of interest statement

The authors declare that the research was conducted in the absence of any commercial or financial relationships that could be construed as a potential conflict of interest.

Figures

FIGURE 1
FIGURE 1
BMP2 expression in women with normal early pregnancies and EPL. (A) Comparison of the circulating BMP2 levels in non-pregnant (Non-P) women (n = 50), normal early pregnant women (NP, n = 50) and women with EPL (n = 50). The serum samples collected from these women were measured using ELISA. (B) The expression and localization of BMP2 in human preimplantation embryos. Human preimplantation embryos, including the zygote, 4-cell, 8-16-cell, morula and blastocyst stages, were fixed and probed with a specific antibody against human BMP2 followed by probing with a fluorescein isothiocyanate-conjugated secondary antibody or DAPI counterstaining. PBS without primary antibody was used as a negative control. The images were detected using confocal microscopy. (C) Expression and localization of BMP2 in first-trimester human placental villus tissues obtained from women with NPs and EPL. The images were detected using immunohistochemistry staining. PBS containing rabbit IgG1 isotype was used as a negative control. Stronger brown cytoplasmic staining of BMP2 was detected in the cell column EVTs (yellow arrowheads), syncytiotrophoblasts (black arrowheads) and CTBs (green arrowheads) of the placental villous tissues obtained from women with NPs (scale bar 1/4 200 mm in 100 × images and scale bar 1/4 50 mm in 400 × images). (D,E) The mRNA (D) and protein (E) levels of BMP2 in villous tissue obtained from women with NPs (n = 50) and EPL (n = 50) were examined using RT-qPCR and western blot analyses, respectively. The relative amounts of mRNA were calculated using the 2–ΔΔCt method and normalized to that of the internal control gene GAPDH. The relative amounts of protein were normalized to that of the internal control α-tubulin. Differences between groups were determined by either Student’s t-test or one-way analysis of variance (*P < 0.05, ***P < 0.001).
FIGURE 2
FIGURE 2
BMP2 upregulates MMP2 expression and promotes cell invasion in primary human EVT cells. (A) Primary human EVT cells were treated with a vehicle control (Ctrl) or 25 ng/mL BMP2 for 72 h, and cell invasion was examined using the Matrigel-coated transwell invasion assay. A representative image of the assay (scale bar represents 200 μm) and quantitative results are shown separately. Primary human EVT cells were seeded in 24-well plates, and the cells were treated every 24 h (24, 48 and 72 h) with Ctrl or 25 ng/mL BMP2 for a total of 72 h. Cell viability was determined using a CCK-8 assay. (B) The correlation between BMP2 treatment and the EMT signaling pathway sing the gene set enrichment analysis plot. (C,D) Primary human EVT cells were treated for 12 h (C) or 24 h (D) with Ctrl or 25 ng/mL BMP2 and the mRNA (C) and protein (D) levels of MMP2 were examined using RT-qPCR and western blot analyses, respectively. GAPDH and α-tubulin were used to normalize the RT-qPCR and western blot results, respectively. (E) Primary human EVT cells were treated for 24 h with Ctrl or 25 ng/mL BMP2 and MMP2 activity was examined using ELISA. The results are expressed as the mean ± SEM of five independent experiments (n = 5, *P < 0.05, **P < 0.01). Differences between groups were determined by Student’s t-test.
FIGURE 3
FIGURE 3
SNAIL mediates the BMP2-induced upregulation of MMP2 and the increase in cell invasion of primary human EVT cells. (A,B) Primary human EVT cells were transfected with 25 nM control siRNA (siCtrl) or 25 nM SNAIL-specific siRNA (siSNAIL) for 48 h, and the cells were treated with Ctrl or 25 ng/mL BMP2 for an additional 12 h (A) or 24 h (B). The mRNA (A) and protein (B) levels of MMP2 and SNAIL were examined using the RT-qPCR and western blot results, respectively. (C) Primary human EVT cells were transfected with 25 nM siCtrl or 25 nM siSNAIL for 24 h, and the cells were treated with Ctrl or 25 ng/mL BMP2 for an additional 48 h. Cell invasion was examined using the Matrigel-coated transwell invasion assay. (D) Primary human EVT cells were transfected with 25 nM siCtrl or 25 nM siMMP2 for 24 h. The mRNA levels of MMP2 and cell invasion was examined using RT-qPCR and Matrigel-coated transwell invasion assay, respectively. The results are expressed as the mean ± SEM of five independent experiments (n = 5, P < 0.05; ∗∗∗P < 0.001; NS, no significant difference). Differences between groups were determined by one-way analysis of variance.
FIGURE 4
FIGURE 4
MiR-502-5p suppresses SNAIL expression and decreases SNAIL-mediated cell invasion in primary human EVT cells. (A–C) Primary human EVT cells were transfected for 24 h with 25 nM miR-NC (as a negative control) or 25 nM miR-502-5p mimic, and the miR-505-5p levels (A) were examined using RT-qPCR. The mRNA (B) and protein (C) levels of SNAIL were examined using RT-qPCR and western blot analyses, respectively. (D) Primary human EVT cells were transfected for 24 h with 3&2032;-UTR SNAIL-luciferase reporter (SNAIL 3&2032;-UTR-WT) or 3&2032;-UTR SNAIL mutant-luciferase reporter (SNAIL 3&2032;-UTR-MUT) along with 25 nM miR-NC or 25 nM miR-502-5p mimic. The luciferase activities of cells were detected using a dual-luciferase assay. (E) Primary human EVT cells were cotransfected with 25 nM miRNA inhibitor negative control (inhibitor Ctrl) or 25 nM miR-502-5p inhibitor for 24 h as well as 25 nM siCtrl or 25 nM siSNAIL for 24 h. Cell invasion was examined using the Matrigel-coated transwell invasion assay. The results are expressed as the mean ± SEM of five independent experiments (n = 5, *P < 0.05; **P < 0.001; NS, no significant difference). Differences between groups were determined by Student’s t-test or one-way analysis of variance.
FIGURE 5
FIGURE 5
ALK2 or ALK3 mediates BMP2-induced upregulation of SNAIL and MMP2 in primary EVT cells. (A,B) Primary human EVT cells were pretreated with vehicle control or DMH-1 (0.5 μM) for 60 min and the cells were treated with Ctrl or 25 ng/mL BMP2 for an additional 12 h. The mRNA levels of SNAIL (A) and MMP2 (B) were examined using RT-qPCR. (C,D), Primary human EVT cells were pretreated with vehicle control or DMH-1 (0.5 μM) for 60 min and the cells were treated with Ctrl or 25 ng/mL BMP2 for an additional 24 h. The protein levels of SNAIL (C) and MMP2 (D) were examined using western blot analysis. The results are expressed as the mean ± SEM of four independent experiments (n = 4, *P < 0.05; NS, no significant difference). Differences between groups were determined by one-way analysis of variance.
FIGURE 6
FIGURE 6
Hierarchical clustering analysis of lncRNA and microRNA expression in primary human EVT cells treated with Ctrl (n = 3) or 25 ng/mL BMP2 (n = 3). Each row represents one type of RNA, and each column represents a sample (A) Ctrl; (B) BMP2 treatment). The color scale shown at the top illustrates the relative RNA expression level; red represents high expression, and blue represents low expression.
FIGURE 7
FIGURE 7
NR026833.1 induces SNAIL expression and promotes cell invasion in primary human EVT cells. (A) Primary human EVT cells were treated with Ctrl or 25 ng/mL BMP2 for 12 h, and the levels of NR026833.1 were examined using RT-qPCR. (B) Correlation of the relative mRNA levels of BMP2 and those of NR026833.1 in villous tissues obtained from women with NPs (n = 50). (C) The relative levels of NR026833.1 in villous tissue obtained from women with NPs (n = 50) and EPL (n = 50) were examined using RT-qPCR. (D,E) Primary human EVT cells were transfected with 25 nM siCtrl or 25 nM NR026833.1-specific siRNA (si NR026833.1) for 48 h, and the mRNA (E) and protein (F) levels of SNAIL were examined using RT-qPCR and western blot analyses, respectively. (F) Primary human EVT cells were transfected with 25 nM siCtrl or 25 nM si NR026833.1 for 48 h. Cell invasion was examined using a Matrigel-coated transwell invasion assay. The results are expressed as the mean ± SEM of at least five independent experiments (*P < 0.05; ***P < 0.001). Differences between groups were determined by Student’s t-test.
FIGURE 8
FIGURE 8
NR026833.1 binds to miR-502-5p and promotes cell invasion in primary human EVT cells. (A) Localization of NR026833.1 (red) in primary human EVT cells using immunostaining. DAPI staining (blue) was used to determine the location of the nuclei. (B) Primary human EVT cells were transfected for 24 h with an NR026833.1-luciferase reporter (NR026833.1-WT) or an NR026833.1 mutant-luciferase reporter (NR026833.1-MUT) along with 25 nM miRNA-NC or 25 nM miR-502-5p mimic. The luciferase activities of the cells were detected using a dual-luciferase assay. (C) Primary human EVT cells were transfected for 24 h with 25 nM miR-NC or 25 nM miR-502-5p mimic, and cell invasion was examined using a Matrigel-coated transwell invasion assay. (D) Primary human EVT cells were transfected for 24 h with miR-NC plus overexpression vector negative control (OE-NC), miR-NC plus overexpression NR026833.1 (OE-NR026833.1) or miR-502-5p mimic plus OE-NR026833.1, and cell invasion was examined using a Matrigel-coated transwell invasion assay. The results are expressed as the mean ± SEM of five independent experiments (n = 5, *P < 0.05; ***P < 0.001; NS, no significant difference). Differences between groups were determined by Student’s t-test.
FIGURE 9
FIGURE 9
BMP2 promotes the development of mouse preimplantation embryos. (A) The expression and localization of BMP2 in mouse preimplantation embryos. Mouse preimplantation embryos, including the oocyte, zygote, 2-cell, 4-cell, 8-cell, morula and blastocyst stages, were fixed and probed with a specific antibody against mouse BMP2 followed by probing with a fluorescein isothiocyanate-conjugated secondary antibody or DAPI counterstaining. The images were detected using confocal microscopy. (B) BMP2 accelerates the processes of blastocyst formation and hatching. Mouse 2-cell embryos were cultured in HTF medium with Ctrl or 100 ng/mL BMP2 for 72 h. The processes of blastocyst formation and hatching (yellow arrowheads) were detected with microscopic observation. Six independent experiments (n = 6) were performed, and similar results were obtained (the total number of embryos in the control group was 110 and that in the BMP2 group was 111). The scale bars represent 50 μm.
FIGURE 10
FIGURE 10
BMP2 promotes the invasive differentiation of mouse TS cells. (A) TS cells were treated with Ctrl or 100 ng/mL BMP2 every 24 h for up to 7 days, and three cell marker genes, including Eomes (TS cell marker), Tpbpa (SpT marker) and Ctsq (TGC marker), were examined using RT-qPCR. (B) TS cells were treated with Ctrl or 100 ng/mL BMP2 for 4 days, and cell images were detected with microscopic observation. Undifferentiated TS cells showed a colony with characteristic tightly packed cells (yellow arrowheads), while differentiated TS cells showed a typical TGC morphology (blue arrowheads). These differentiated TS cells showed a flattened appearance and increased cell, nuclei and perinuclear granule sizes (blue arrowheads). The scale bars represent 200 μm. (C) TS cells were treated with Ctrl or 100 ng/mL BMP2 every 24 h for a total of 72 h, and cell invasion was examined using a Matrigel-coated transwell invasion assay. Cell viability was determined using a CCK-8 assay. (D) TS cells were treated for 12 or 24 h with Ctrl or 100 ng/mL BMP2, and the mRNA (12 h) and protein (24 h) levels of MMP2 and SNAIL were examined using RT-qPCR and western blot analyses, respectively. TS cells were treated for 24 h with Ctrl or 100 ng/mL BMP2, and the MMP2 activity was examined using ELISA. GAPDH and α-tubulin were used to normalize the RT-qPCR and western blot results, respectively. The results are expressed as the mean ± SEM of three independent experiments (n = 3, *P < 0.05, **P < 0.01 and ***P < 0.001). Differences between groups were determined by Student’s t-test or one-way analysis of variance.
FIGURE 11
FIGURE 11
A schematic diagram of the regulatory role of the BMP2/NR026833.1/SNAIL/MMP2 signaling axis in promoting the invasive differentiation of trophoblasts. Left panel figure. LncRNA NR026833.1 is upregulated by BMP2 and promotes the expression of SNAIL (target gene of miR-502-5p) by acting as a decoy to competitively bind to miR-502-5p. The upregulation of SNAIL further acts as a transcription factor that induces the production of MMP2, which in turn promotes cell invasion in primary EVT cells. Right panel figure. In humans and mice, BMP2 is expressed in the oocyte and all embryo stages (especially the trophectoderm). Exogenous BMP2 enhances embryonic development by increasing blastocyst formation and hatching. Additionally, BMP2 promotes the invasive differentiation of TS cells by upregulating the expression of SNAIL and MMP2.

Similar articles

Cited by

References

    1. Bai S. X., Wang Y. L., Qin L., Xiao Z. J., Herva R., Piao Y. S. (2005). Dynamic expression of matrix metalloproteinases (MMP-2, -9 and -14) and the tissue inhibitors of MMPs (TIMP-1, -2 and -3) at the implantation site during tubal pregnancy. Reproduction 129 103–113. 10.1530/rep.1.00283 - DOI - PubMed
    1. Bak R. O., Mikkelsen J. G. (2014). miRNA sponges: soaking up miRNAs for regulation of gene expression. Wiley Interdiscip. Rev. RNA 5 317–333. 10.1002/wrna.1213 - DOI - PubMed
    1. Bartel D. P. (2004). MicroRNAs: genomics, biogenesis, mechanism, and function. Cell 116 281–297. - PubMed
    1. Bianchi D. W., Wilkins-Haug L. E., Enders A. C., Hay E. D. (1993). Origin of extraembryonic mesoderm in experimental animals: relevance to chorionic mosaicism in humans. Am. J. Med. Genet. 46 542–550. 10.1002/ajmg.1320460517 - DOI - PubMed
    1. Blechschmidt K., Mylonas I., Mayr D., Schiessl B., Schulze S., Becker K. F., et al. (2007). Expression of E-cadherin and its repressor snail in placental tissue of normal, preeclamptic and HELLP pregnancies. Virchows Arch. 450 195–202. 10.1007/s00428-006-0343-x - DOI - PubMed

LinkOut - more resources