

Development and validation of an open-source, disposable, 3D-printed in vitro environmental exposure system for Transwell culture inserts
- PMID: 33614779
- PMCID: PMC7882787
- DOI: 10.1183/23120541.00705-2020
Development and validation of an open-source, disposable, 3D-printed in vitro environmental exposure system for Transwell culture inserts
Abstract
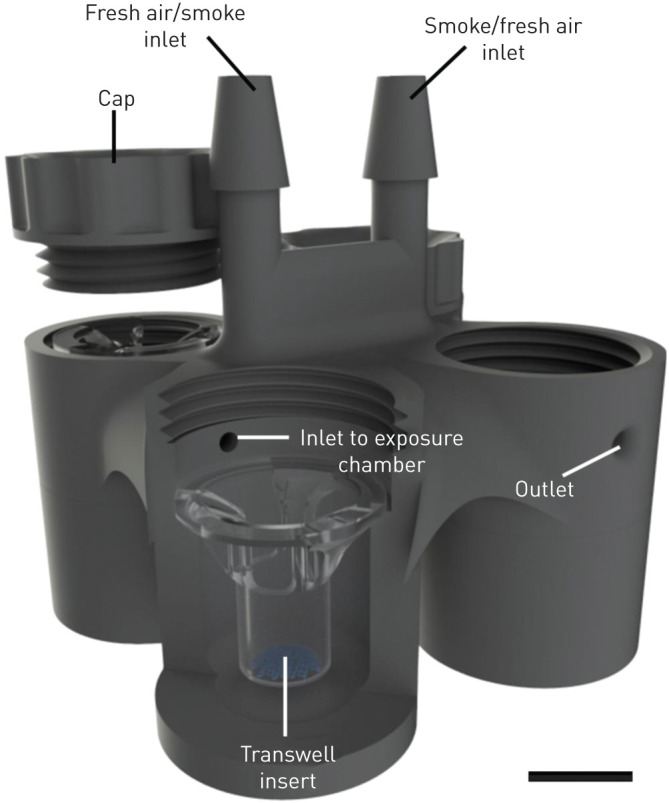
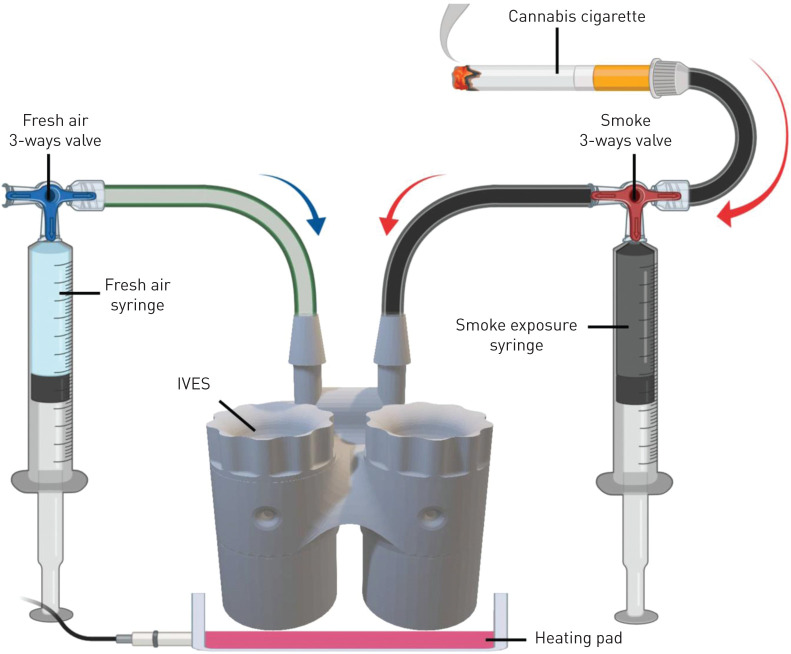
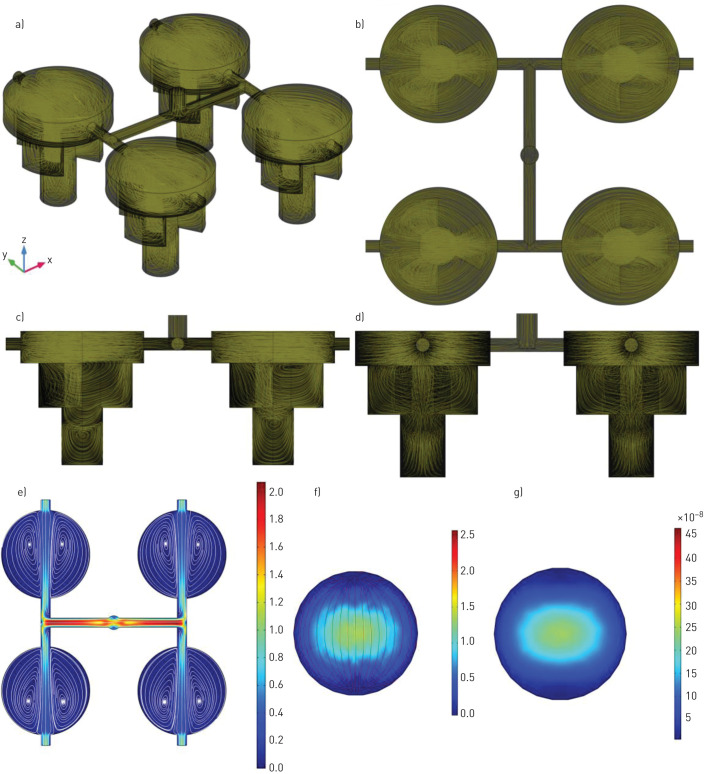
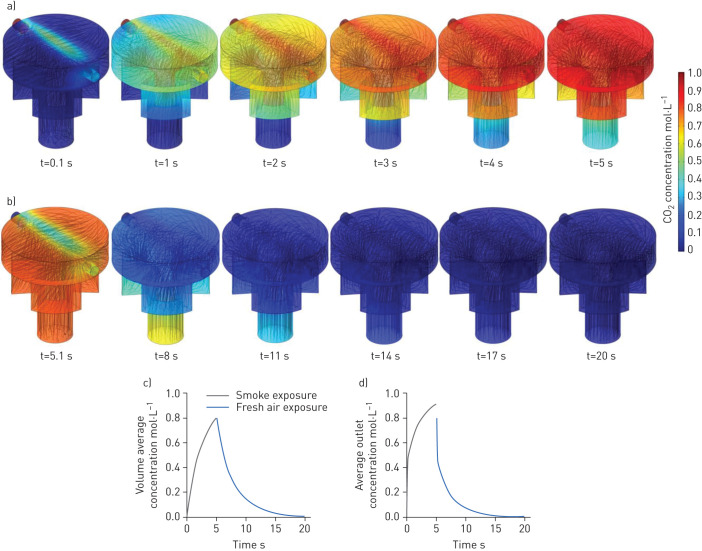
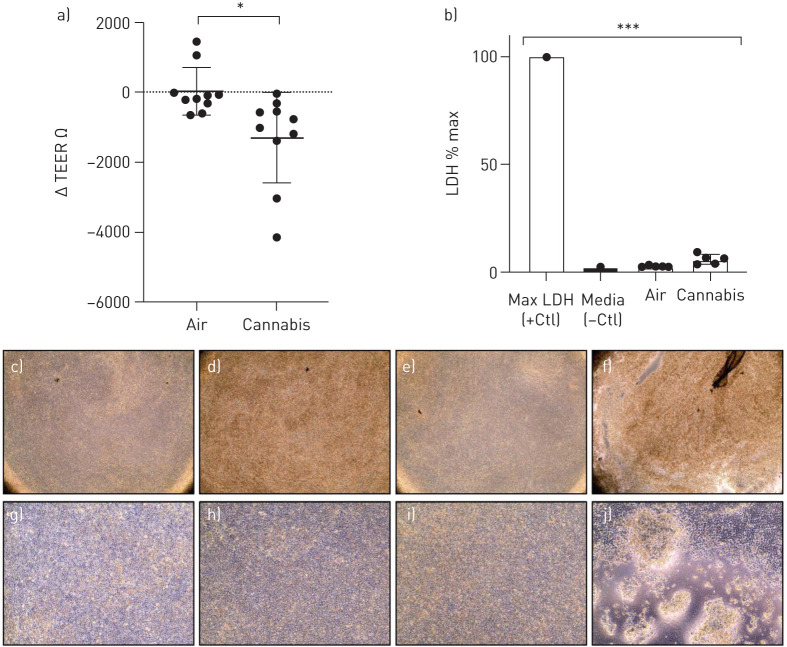
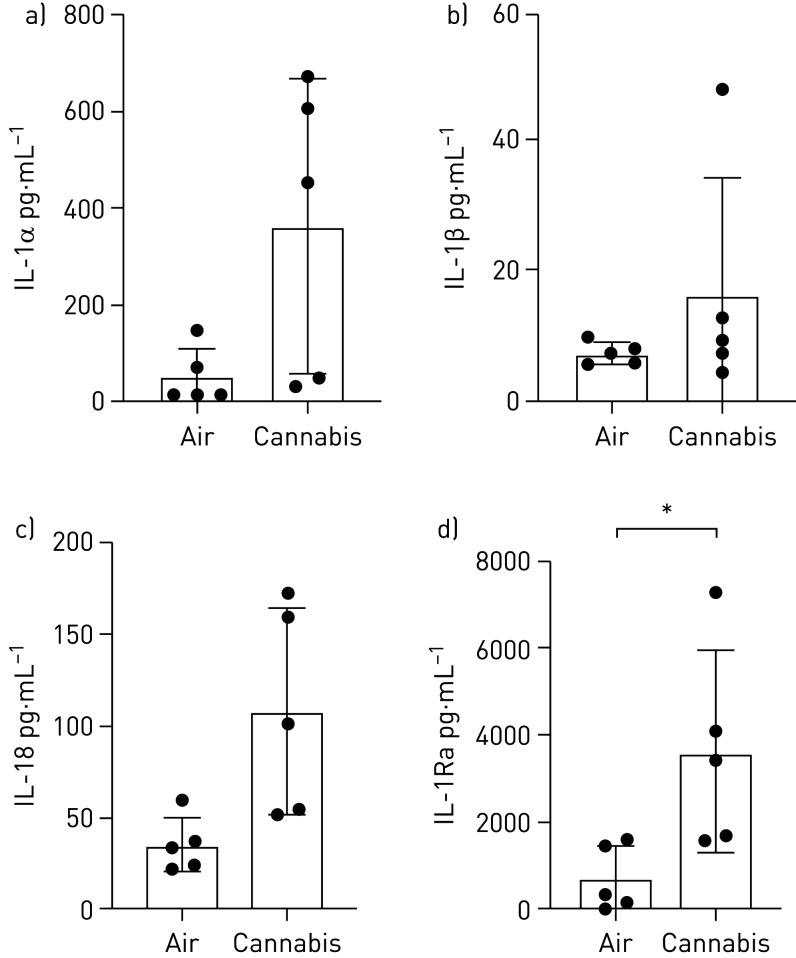
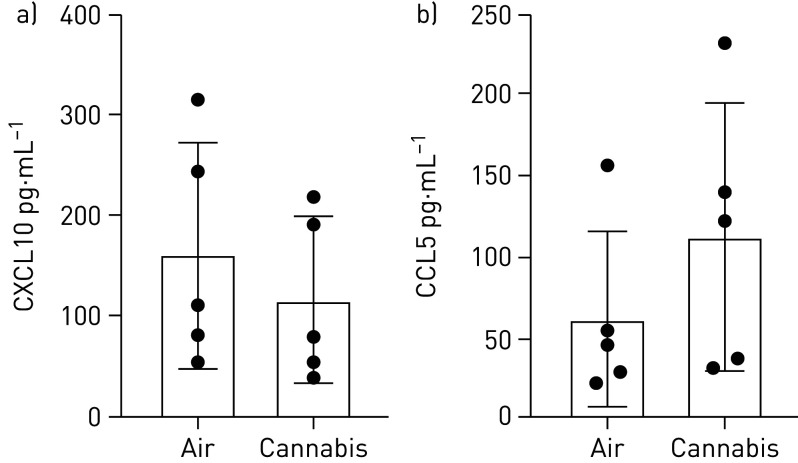
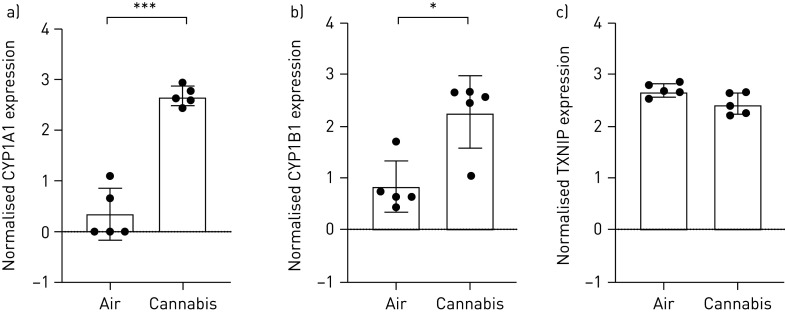
Accessible in vitro models recapitulating the human airway that are amenable to study whole cannabis smoke exposure are needed for immunological and toxicological studies that inform public health policy and recreational cannabis use. In the present study, we developed and validated a novel three-dimensional (3D)-printed in vitro exposure system (IVES) that can be directly applied to study the effect of cannabis smoke exposure on primary human bronchial epithelial cells. Using commercially available design software and a 3D printer, we designed a four-chamber Transwell insert holder for exposures to whole smoke. COMSOL Multiphysics software was used to model gas distribution, concentration gradients, velocity profile and shear stress within IVES. Following simulations, primary human bronchial epithelial cells cultured at the air-liquid interface on Transwell inserts were exposed to whole cannabis smoke using a modified version of the Foltin puff procedure. Following 24 h, outcome measurements included cell morphology, epithelial barrier function, lactate dehydrogenase (LDH) levels, cytokine expression and gene expression. Whole smoke delivered through IVES possesses velocity profiles consistent with uniform gas distribution across the four chambers and complete mixing. Airflow velocity ranged between 1.0 and 1.5 µm·s-1 and generated low shear stresses (<<1 Pa). Human airway epithelial cells exposed to cannabis smoke using IVES showed changes in cell morphology and disruption of barrier function without significant cytotoxicity. Cannabis smoke elevated interleukin-1 family cytokines and elevated CYP1A1 and CYP1B1 expression relative to control, validating IVES smoke exposure impacts in human airway epithelial cells at a molecular level. The growing legalisation of cannabis on a global scale must be paired with research related to potential health impacts of lung exposures. IVES represents an accessible, open-source, exposure system that can be used to model varying types of cannabis smoke exposures with human airway epithelial cells grown under air-liquid interface culture conditions.
Copyright ©ERS 2021.
Conflict of interest statement
Conflict of interest: A. Chandiramohan has nothing to disclose. Conflict of interest: M. Dabaghi has nothing to disclose. Conflict of interest: J.A. Aguiar has nothing to disclose. Conflict of interest: N. Tiessen has nothing to disclose. Conflict of interest: M. Stewart has nothing to disclose. Conflict of interest: Q.T. Cao has nothing to disclose. Conflict of interest: J.P. Nguyen has nothing to disclose. Conflict of interest: N. Makhdami has nothing to disclose. Conflict of interest: G. Cox has nothing to disclose. Conflict of interest: A.C. Doxey has nothing to disclose. Conflict of interest: J.A. Hirota has nothing to disclose.
Figures
Similar articles
-
Transcriptomic and barrier responses of human airway epithelial cells exposed to cannabis smoke.Physiol Rep. 2019 Oct;7(20):e14249. doi: 10.14814/phy2.14249. Physiol Rep. 2019. PMID: 31646766 Free PMC article.
-
Burn Pit Smoke Condensate-Mediated Toxicity in Human Airway Epithelial Cells.Chem Res Toxicol. 2024 May 20;37(5):791-803. doi: 10.1021/acs.chemrestox.4c00064. Epub 2024 Apr 23. Chem Res Toxicol. 2024. PMID: 38652897 Free PMC article.
-
Impact assessment of repeated exposure of organotypic 3D bronchial and nasal tissue culture models to whole cigarette smoke.J Vis Exp. 2015 Feb 12;(96):52325. doi: 10.3791/52325. J Vis Exp. 2015. PMID: 25741927 Free PMC article.
-
Pulmonary effects of inhaled cannabis smoke.Am J Drug Alcohol Abuse. 2019;45(6):596-609. doi: 10.1080/00952990.2019.1627366. Epub 2019 Jul 12. Am J Drug Alcohol Abuse. 2019. PMID: 31298945 Review.
-
Use of airway epithelial cell culture to unravel the pathogenesis and study treatment in obstructive airway diseases.Pulm Pharmacol Ther. 2017 Aug;45:101-113. doi: 10.1016/j.pupt.2017.05.008. Epub 2017 May 11. Pulm Pharmacol Ther. 2017. PMID: 28502841 Review.
Cited by
-
Open-source, three-dimensionally printed manifolds for exposure studies using human airway epithelial cells.ERJ Open Res. 2025 Jun 30;11(3):00703-2024. doi: 10.1183/23120541.00703-2024. eCollection 2025 May. ERJ Open Res. 2025. PMID: 40589909 Free PMC article.
-
A Robust Protocol for Decellularized Human Lung Bioink Generation Amenable to 2D and 3D Lung Cell Culture.Cells. 2021 Jun 18;10(6):1538. doi: 10.3390/cells10061538. Cells. 2021. PMID: 34207111 Free PMC article.
-
Development and validation of a mouse model of contemporary cannabis smoke exposure.ERJ Open Res. 2021 Jul 19;7(3):00107-2021. doi: 10.1183/23120541.00107-2021. eCollection 2021 Jul. ERJ Open Res. 2021. PMID: 34291110 Free PMC article.
-
3D Bioprinting Strategies, Challenges, and Opportunities to Model the Lung Tissue Microenvironment and Its Function.Front Bioeng Biotechnol. 2021 Nov 24;9:773511. doi: 10.3389/fbioe.2021.773511. eCollection 2021. Front Bioeng Biotechnol. 2021. PMID: 34900964 Free PMC article. Review.
References
LinkOut - more resources
Full Text Sources
Molecular Biology Databases