. 2021 Jan 26:20:352-363.
doi: 10.1016/j.omto.2021.01.014. eCollection 2021 Mar 26.

HDAC inhibition prevents transgene expression downregulation and loss-of-function in T-cell-receptor-transduced T cells

Affiliations

HDAC inhibition prevents transgene expression downregulation and loss-of-function in T-cell-receptor-transduced T cells

Tamson V Moore et al. Mol Ther Oncolytics. .

Abstract

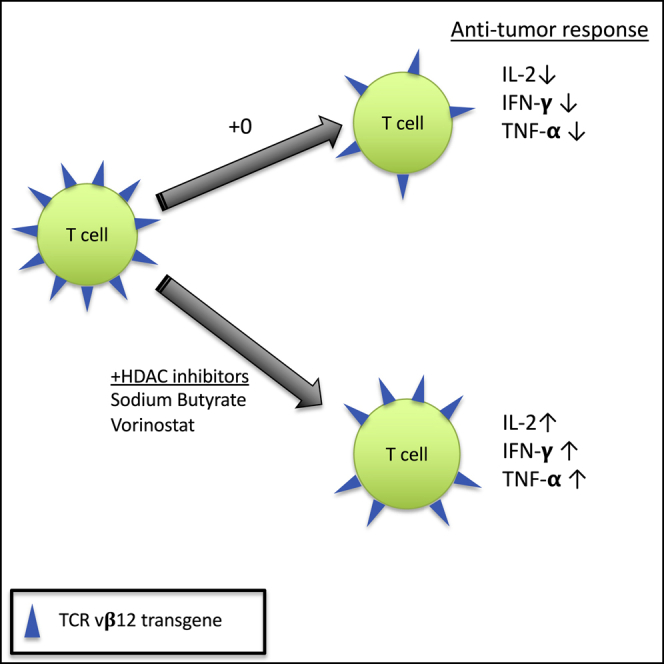
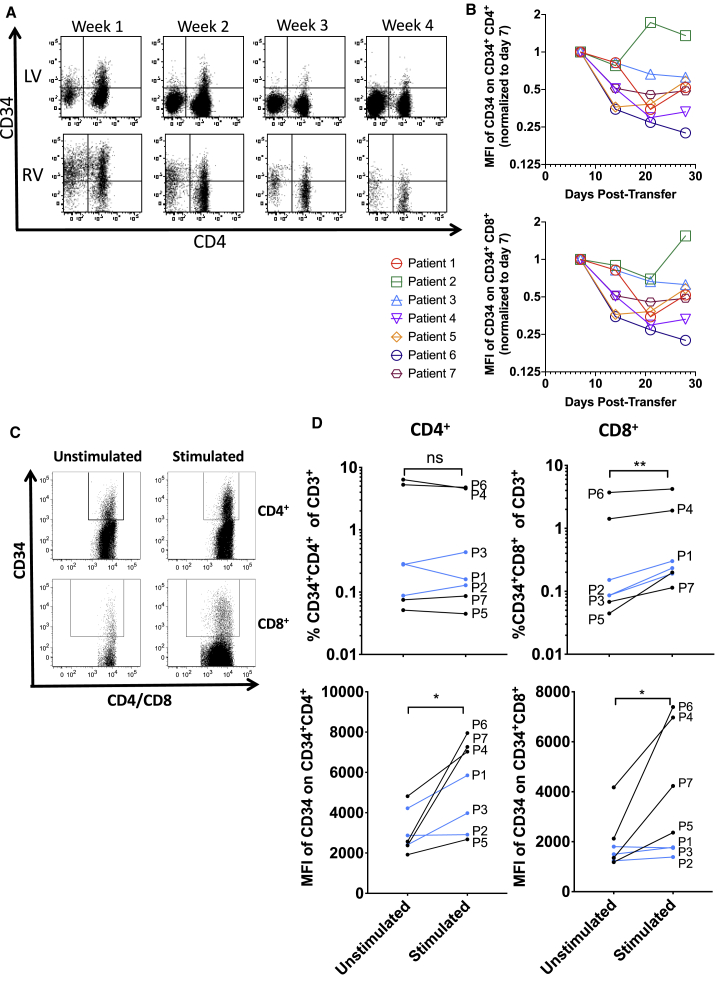
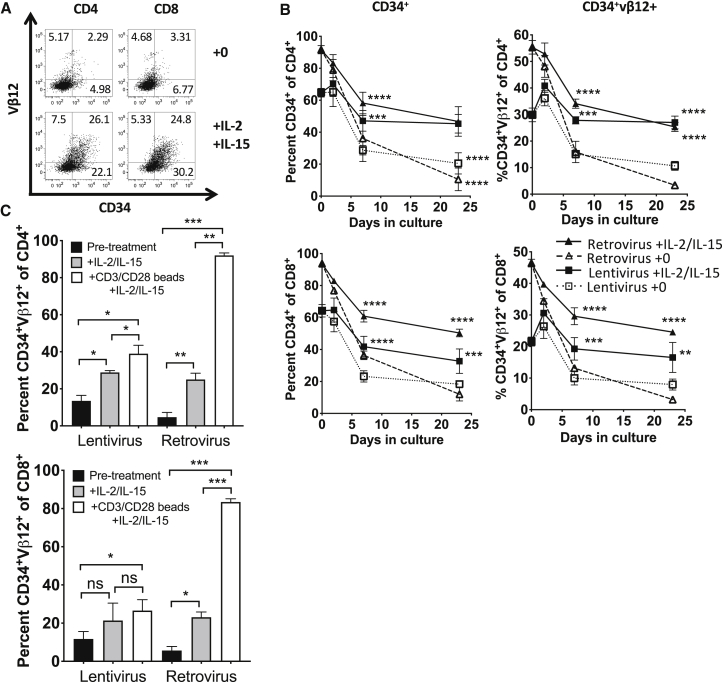
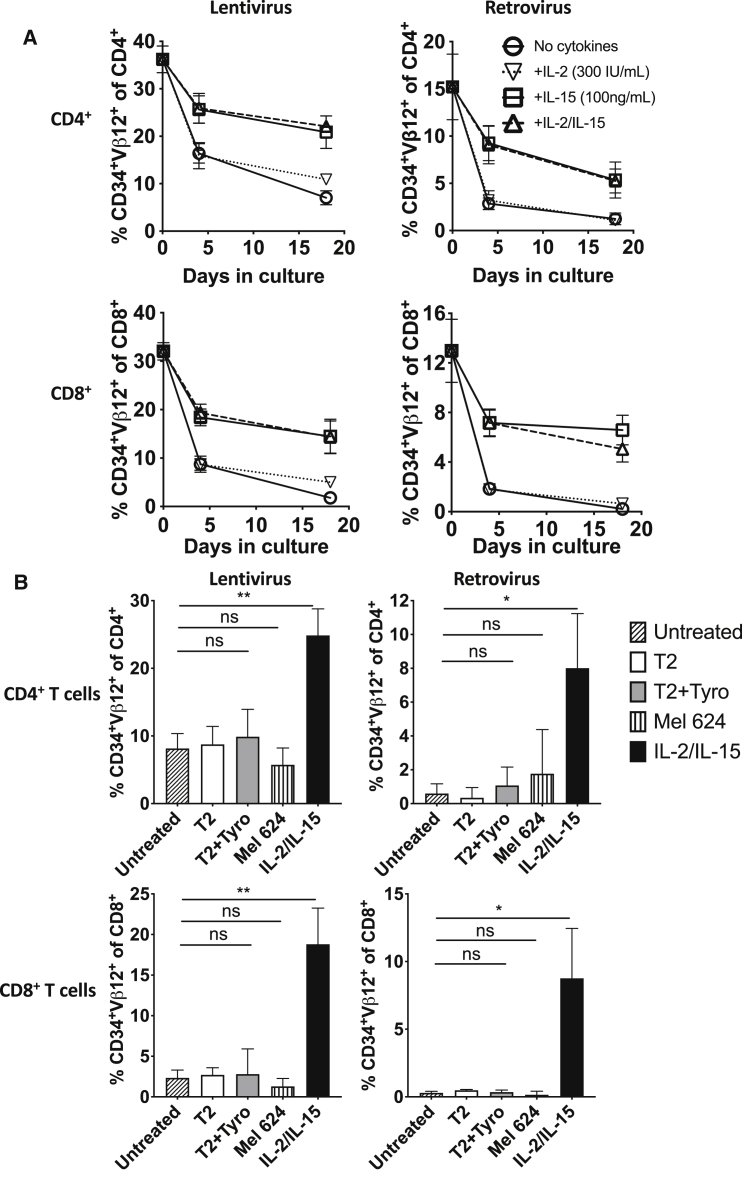
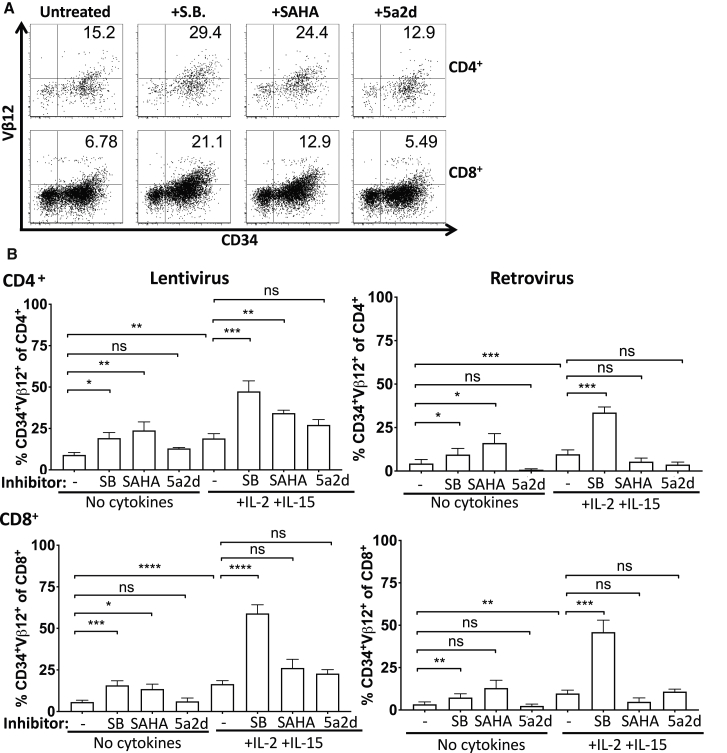
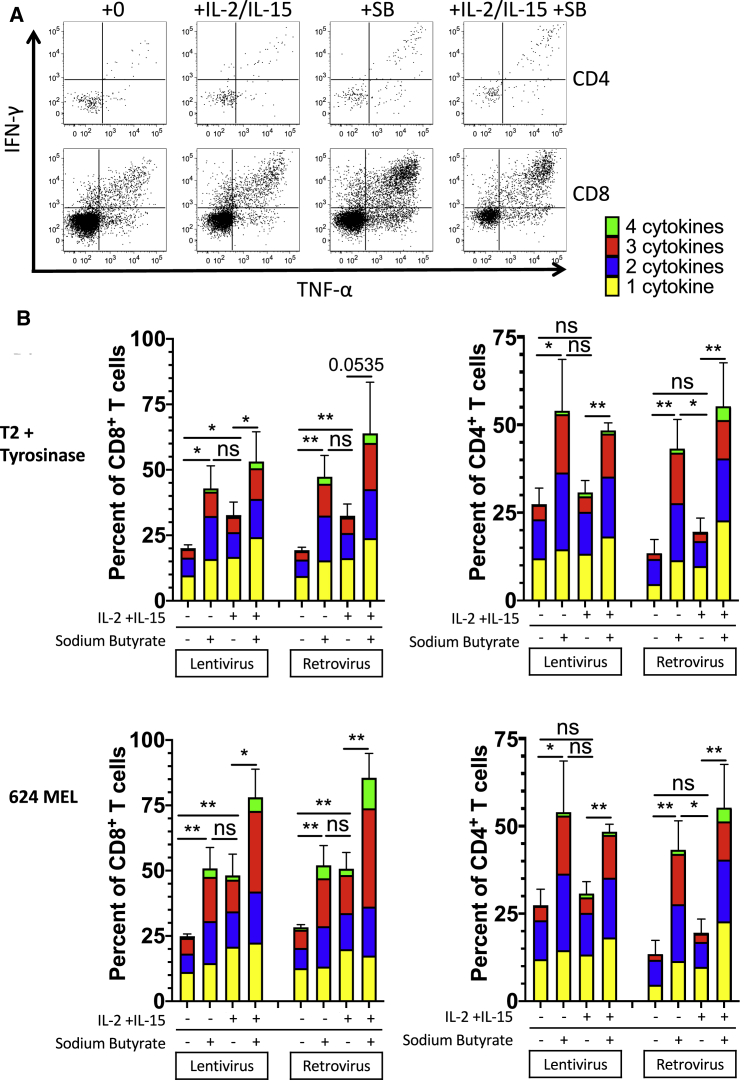
T cells that are gene-modified with tumor-specific T cell receptors are a promising treatment for metastatic melanoma patients. In a clinical trial, we treated seven metastatic melanoma patients with autologous T cells transduced to express a tyrosinase-reactive T cell receptor (TCR) (TIL 1383I) and a truncated CD34 molecule as a selection marker. We followed transgene expression in the TCR-transduced T cells after infusion and observed that both lentiviral- and retroviral-transduced T cells lost transgene expression over time, so that by 4 weeks post-transfer, few T cells expressed either lentiviral or retroviral transgenes. Transgene expression was reactivated by stimulation with anti-CD3/anti-CD28 beads and cytokines. TCR-transduced T cell lentiviral and retroviral transgene expression was also downregulated in vitro when T cells were cultured without cytokines. Transduced T cells cultured with interleukin (IL)-15 maintained transgene expression. Culturing gene-modified T cells in the presence of histone deacetylase (HDAC) inhibitors maintained transgene expression and functional TCR-transduced T cell responses to tumor. These results implicate epigenetic processes in the loss of transgene expression in lentiviral- and retroviral-transduced T cells.

Keywords: HDAC inhibitors; TCR-transduced T cells; cancer immunotherapy; cell therapy; functional responses; gene silencing; gene-modified T cells; sodium butyrate; transgene silencing; vorinostat.


Conflict of interest statement

T.V.M. G.M.S., M.D., S.Y.W., A.V.D, C.R.W., K.A.H., J.J.S., C.V.G., C.F., J.F., T.M., M.T., D.M., B.D.C. B.A.F., and M.I.N. have no conflicts of interest to disclose. J.I.C. is on the speakers’ bureau for Bristol Meyers Squibb (BMS) and Merck; is a consultant for Clinigen; receives research support (to institution) from BMS, Prometheus, AVEO, and Roche/Genentech; and has a family member employed full time by BMS.

Figures

None
Graphical abstract
Figure 1
Figure 1
Transgene expression is reversibly downregulated in patients (A and B) Cryopreserved patient PBMCs were thawed and analyzed by flow cytometry for expression of CD34 on live CD3+CD4+CD34+ or live CD3+CD8+CD34+ T cells. (A) Expression of CD34 versus CD4 on live CD3+ T cells for a patient given lentivirally transduced T cells (top, LV) and retrovirally transduced T cells (bottom, RV). (B) MFI of CD34 on live CD34+ CD4+ (top) and CD34+ CD8+ (bottom) T cells. (C and D) Patient blood samples were thawed then rested or cultured in complete media with IL-2 (300 IU/mL) and IL-15 (100 ng/mL) for 2 days, then restimulated with Human T-Activator CD3/CD28 beads at a 1:1 cell:bead ratio. (C) Expression of CD34 and gating on CD34+CD4+ and CD34+CD8+ are shown. (D, top) The percent CD34+CD4+ (left) and CD34+CD8+ (right) are shown for every patient; (bottom) the MFI of CD34 on CD34+CD4+ (left) and CD34+CD8+ (right) T cells is shown for every patient. Patients receiving lentiviral-transduced T cells are shown in blue, while those receiving retroviral-transduced T cells are shown in black. p values were calculated by a ratio paired t test and summarized with ∗∗p < 0.01 and ∗p < 0.05.
Figure 2
Figure 2
Reversible transgene expression downregulation occurs in the absence of cytokines (A and B) T cells from the apheresis of patients 1–3 were activated, separated into two groups, and transduced with lentivirus or retrovirus and expanded. Transduced T cells were cultured with and without cytokines for 23 days. CD34 and Vβ12 expression was assessed by flow cytometry. (A) Example of CD34 versus Vβ12 expression on CD4+ and CD8+ T cells on day 23. (B) Time course of CD34 (left) and Vβ12 (right) expression on CD4+ (top) and CD8+ (bottom) T cells. Data in (B) were analyzed by 2-way ANOVA and Tukey’s multiple comparisons test. (C) Transduced T cells were cultured for 4 weeks without cytokines, then restimulated. CD34 and Vβ12 expression was assessed on CD4+ and CD8+ T cells prior to and after restimulation for 2 days with IL-2 and IL-15 or with CD3/CD28 beads as well as IL-2 and IL-15. Data in (C) were analyzed by paired t test. p values are summarized as ∗∗∗∗p < 0.0001, ∗∗∗p < 0.001, ∗∗p < 0.01, and ∗p < 0.05.
Figure 3
Figure 3
Culture in IL-15 reduces downregulation of transgene expression Healthy donor T cells were activated, transduced with lentivirus (pLVX-1383I, left) or retrovirus (SAMEN-1383I, RV, right), then CD34-sorted and rapidly expanded. (A) Lentiviral- and retroviral-transduced T cells were then cultured in the presence or absence of IL-2 and IL-15. Expression of CD34 and Vβ12 was assessed by flow cytometry on CD4+ or CD8+ CD3+ T cells at indicated time points. (B) Lentiviral- and retroviral-transduced T cells were cultured for 14 days in the absence or presence of T2 cells, T2 cells pulsed with tyrosinase, 624 MEL cells, or IL-2 (300 IU/mL) and IL-15 (100 ng/mL). Tumor cells were added at a ratio of 1:4 tumor:T cell. On day 12, tumor cells were no longer detectable, and a second dose of tumor cells was added. Error bars represent standard deviation. Significance is shown by Student’s t test with p values summarized as ∗∗p < 0.01, and ∗p < 0.05.
Figure 4
Figure 4
Culture with HDAC inhibitors reduces transgene expression downregulation Transduced T cells (from healthy donors) were cultured for 12 days with no cytokines or with IL-2 and IL-15 in the absence or presence of HDAC inhibitors, sodium butyrate (SB) or suberoylanilide hydroxamic acid (SAHA), or a DNA methyltransferase inhibitor, 5-aza-2′-deoxycytidine (5a2d). (A) Representative fluorescence-activated cell sorting (FACS) plots of CD34 versus vβ12 on CD4+ (top) and CD8+ (bottom) T cells. (B) Comparison of percentages CD34+Vβ12+ of CD4+ (top) and CD8+ (bottom) T cells. Results are representative of at least four donors and three independent experiments. Significance was determined by paired t test (pairing on donor and virus type) with p values summarized as ∗∗∗∗p < 0.0001, ∗∗∗p < 0.001, ∗∗p < 0.01, and ∗p < 0.05
Figure 5
Figure 5
Transduced CD4+ and CD8+ T cell responses to antigen are protected in the absence of cytokines by sodium butyrate Transduced T cells (from healthy donors) were cultured for 10 days with and without sodium butyrate and cytokines. After 10 days, cells were washed and cocultured with T2/tyrosinase or 624 MEL in the presence of Golgi blockers and a labeled anti-CD107a antibody. After the coculture, the cells were stained extracellularly for CD3, CD4, CD8, and CD34; stained with a viability dye; then fixed, permeabilized and stained intracellularly for TNF-α, IFN- γ, and IL-2. Statistics shown are Student’s t test of differences in total cells expressing 1 or more effector molecules (IL-2, IFN-γ, TNF-α, and CD107a). p values are summarized as ∗∗p < 0.01, and ∗p < 0.05.

Similar articles

Cited by

References

    1. Henley S.J., Ward E.M., Scott S., Ma J., Anderson R.N., Firth A.U., Thomas C.C., Islami F., Weir H.K., Lewis D.R. Annual report to the nation on the status of cancer, part I: National cancer statistics. Cancer. 2020;126:2225–2249. - PMC - PubMed
    1. Siegel R.L., Miller K.D., Jemal A. Cancer statistics, 2020. CA Cancer J. Clin. 2020;70:7–30. - PubMed
    1. Yi M., Jiao D., Xu H., Liu Q., Zhao W., Han X., Wu K. Biomarkers for predicting efficacy of PD-1/PD-L1 inhibitors. Mol. Cancer. 2018;17:129. - PMC - PubMed
    1. Rosenberg S.A., Packard B.S., Aebersold P.M., Solomon D., Topalian S.L., Toy S.T., Simon P., Lotze M.T., Yang J.C., Seipp C.A. Use of tumor-infiltrating lymphocytes and interleukin-2 in the immunotherapy of patients with metastatic melanoma. A preliminary report. N. Engl. J. Med. 1988;319:1676–1680. - PubMed
    1. Duong C.P., Yong C.S., Kershaw M.H., Slaney C.Y., Darcy P.K. Cancer immunotherapy utilizing gene-modified T cells: From the bench to the clinic. Mol. Immunol. 2015;67(2 Pt A):46–57. - PubMed

LinkOut - more resources