. 2020 Sep 1;4(3):852-870.
doi: 10.1162/netn_a_00154. eCollection 2020.

Nonlinear response characteristics of neural networks and single neurons undergoing optogenetic excitation

Affiliations

Nonlinear response characteristics of neural networks and single neurons undergoing optogenetic excitation

Jannik Luboeinski et al. Netw Neurosci. .

Abstract

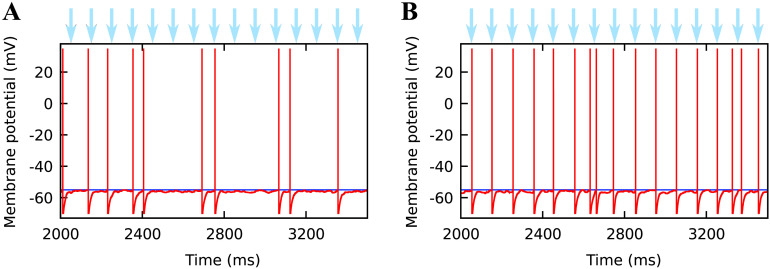
Optogenetic stimulation has become the method of choice for investigating neural computation in populations of neurons. Optogenetic experiments often aim to elicit a network response by stimulating specific groups of neurons. However, this is complicated by the fact that optogenetic stimulation is nonlinear, more light does not always equal to more spikes, and neurons that are not directly but indirectly stimulated could have a major impact on how networks respond to optogenetic stimulation. To clarify how optogenetic excitation of some neurons alters the network dynamics, we studied the temporal and spatial response of individual neurons and recurrent neural networks. In individual neurons, we find that neurons show a monotonic, saturating rate response to increasing light intensity and a nonmonotonic rate response to increasing pulse frequency. At the network level, we find that Gaussian light beams elicit spatial firing rate responses that are substantially broader than the stimulus profile. In summary, our analysis and our network simulation code allow us to predict the outcome of an optogenetic experiment and to assess whether the observed effects can be attributed to direct or indirect stimulation of neurons.

Keywords: Channelrhodopsin; Neural networks; Nonlinear response characteristics; Optogenetics.


Conflict of interest statement

Competing Interests: The authors have declared that no competing interests exist.

Figures

<b>Figure 1.</b>
Figure 1.
Model of light-sensitive channels. (A) The dynamics of the three-state model for ChR2. The light blue arrow indicates a light-dependent transition. (B) Trace of the open, state probability in response to 5, mW/mm2 light stimulation for 500 ms (shown by gray bar). Sustained illumination evokes an initial peak followed by a steady state caused by desensitization. Switching off the light stimulation leads to definite channel closing and a monoexponential decay of the open, state probability back to the baseline. The small fluctuations in the steady state, as magnified in the inset, are caused by the voltage dependence of desensitization.
<b>Figure 2.</b>
Figure 2.
Characteristics of the response dynamics of ChR2 channels and neurons after the steady state has been reached. (A) Open-state probability of ChR2 channels and (B) activity of the related neuron, following stimulation with a frequency of 20 Hz and a light intensity of 5 mW/mm2 (averaged over 900 trials). A steady state is reached quickly after the onset dynamics. (C) Course of a periodic pulse in the steady-state open-state probability of the channels, extracted from the temporal course of a simulation as shown in A. Response pulse duration (full width at half maximum), maximum, and minimum value of the steady-state open-state probability can be determined from this diagram, as indicated by the arrows and the green bar. (D) Course of a periodic pulse in the steady-state activity of a single neuron, averaged over all pulses within 20 s from the temporal course of a simulation as shown in B. Pulse duration, maximum, and minimum of the steady-state activity can be determined from this diagram.
<b>Figure 3.</b>
Figure 3.
Characteristics of the computational setting. (A) Schematic of the network architecture. The excitatory population (‘E’) is stimulated by light. It is bidirectionally coupled to the inhibitory population (‘I’). Both populations are recurrently coupled and receive external colored noise input, whose power spectrum matches that of neuronal populations (Destexhe et al., 2003). (B) Three-dimensional plot of the Gaussian distribution of light intensity that is used to stimulate the excitatory population of the network (standard deviation of 12 grid units). The number of grid units corresponds to the number of neurons along the axes. In this example, the intensity amplitude is 5 mW/mm2. (C) Two-dimensional schematic showing the computation of the population activity 〈ν〉, the spatial width σFR, the height νmax, and the baseline νbase of the activity distribution. The N bar-shaped areas have heights proportional to the mean activity of the respective neuron i. The Gaussian curve is fitted to these mean activities. In our simulations, we employed this concept in three dimensions with N × N neurons.
<b>Figure 4.</b>
Figure 4.
Relationship between light stimulation (light pulses of intensity 2 mW/mm2 at 10 Hz, indicated by light blue arrows) and the membrane potential (red traces) of a single neuron. The threshold potential is indicated by the blue line. The plot starts from 2,000 ms to be sure to show pure steady-state dynamics. (A) For 60,000 channels per neuron, the depolarization caused by light is not sufficient to evoke spiking. Nonetheless, random spikes occur due to external input. (B) For 300,000 channels per neuron, the depolarization caused by light is sufficient to evoke spiking, which leads to synchronization of light stimulation and firing.
<b>Figure 5.</b>
Figure 5.
The nonlinear dependence of the steady-state firing rate response of a neuron holding 300,000 ChR2 channels on stimulus frequency and light intensity. The data points were obtained by averaging over 900 neurons and over the response cycles within 20 s after stimulus onset (e.g., 400 cycles at 20-Hz stimulation), following the method visualized in Figure 2D. (A) The activity response minimum increases with increasing frequency. Light intensity does not have a major impact on the response minimum. (B) Remarkably, as the frequency increases, the activity response maximum decreases. The response maximum grows monotonically with the light intensity until it saturates. (C) The response pulse duration increases with frequency at low frequencies, reaches a maximum and then decreases with frequency at high frequencies. Thus, the relation to frequency is nonmonotonic. Regarding increasing light intensity, there is a trend that the pulse duration decreases until saturation.
<b>Figure 6.</b>
Figure 6.
The nonlinear dependence of the steady-state open-state dynamics of the ChR2 channel on stimulus frequency and light intensity. The method for obtaining the open-state statistics is visualized in Figure 2C. (A) The response minimum of the open-state probability increases with increasing frequency. Light intensity causes a slight increase at higher frequencies, but generally only exhibits a minor effect on the response minimum. (B) The response maximum decreases as the frequency increases. It scales monotonically with light intensity until it saturates. (C) The response pulse duration decreases with frequency, and increases with light intensity until saturation.
<b>Figure 7.</b>
Figure 7.
Network response if neurons express on average 60,000 ChR2 channels per neuron. The firing rate distribution is broader than the light distribution but narrower than the response at a higher expression level (Figure 8). (A) The width σFR of the spatial distribution of activities (cf. Figure 3C) is much larger than the width of the light stimulation. This suggests that neuronal activity spreads widely following narrow light stimulation. The connection probability pc has almost no impact on the response width σFR. The width rises as the light intensity E increases. (B) Height νmax and baseline νbase of the spatial distribution of activities, and population activity 〈ν〉, depicted across different light intensities; pc = 0.5%. (C) Height and baseline of the spatial activity distribution and the population activity are shown across different light intensities; pc = 1.0%. (D) Gaussian fit to the spatial distribution of activities resulting from pc = 1.0% and Ê = 5.0 mW/mm2. The data points denote the time-averaged activity of neurons and their distance to the center of the stimulation (in units of the grid index). The width, height, and baseline of the distribution are estimated by the standard deviation, amplitude, and vertical shift of the Gaussian fit, respectively. The light distribution that evoked the activity distribution is shown to enable comparing the widths. This indicates that a narrow stimulus distribution evokes a broad response distribution (here more than 1.5 times as broad). (E, F) Distributions of time-averaged activities for maximum light intensity Ê = 5.0 mW/mm2 and connectivity pc = 0.5% and pc = 1.0%, respectively. The data in A, B, and C were averaged over 10 trials. In some cases, the standard deviation is very small, such that the error bars are covered by the lines. The spatial stimulation width was kept constant across figures.
<b>Figure 8.</b>
Figure 8.
Network response if neurons express on average 300,000 ChR2 channels per neuron. The firing rate distribution is broader than the light distribution and broader than the activity profile we obtained at a lower expression level (Figure 7). (A) The width σFR of the spatial distribution of activities (cf. Figure 3C) is much larger than the width of the light stimulation. This suggests that neuronal activity spreads widely following narrow light stimulation. The response width σFR is almost independent of the connection probability pc. The width rises as the light intensity E increases. (B) Height νmax and baseline νbase of the spatial distribution of activities, and population activity 〈ν〉 depicted across different light intensities; pc = 0.5%. (C) Height and baseline of the spatial activity distribution and the population activity are shown across different light intensities; pc = 1.0%. (D) Gaussian fit to the spatial distribution of activities resulting from pc = 1.0% and Ê = 5.0 mW/mm2. The data points denote the time-averaged activity of neurons and their distance to the center of the stimulation (in units of the grid index). The width, height, and baseline of the distribution are estimated by the standard deviation, amplitude, and vertical shift of the Gaussian fit, respectively. The light distribution that evoked the activity distribution is shown to enable comparing the widths. This indicates that a narrow stimulus distribution evokes a broad response distribution (here almost 2 times as broad). (E and F) Distributions of time-averaged activities for maximum light intensity Ê = 5.0 mW/mm2 and connectivity pc = 0.5% and pc = 1.0%, respectively. The data in A, B, and C were averaged over ten trials. In some cases, the standard deviation is very small, such that the error bars are covered by the lines. The spatial stimulation width was kept constant across figures.

Similar articles

Cited by

References

    1. Berndt, A., Schoenenberger, P., Mattis, J., Tye, K. M., Deisseroth, K., Hegemann, P., & Oertner, T. G. (2011). High-efficiency channelrhodopsins for fast neuronal stimulation at low light levels. PNAS, 108(18), 7595–7600. - PMC - PubMed
    1. Boyden, E. S., Zhang, F., Bamberg, E., Nagel, G., & Deisseroth, K. (2005). Millisecond-timescale, genetically targeted optical control of neural activity. Nature Neuroscience, 8(9), 1263–1268. - PubMed
    1. Braitenberg, V., & Schüz, A. (1998). Cortex: statistics and geometry of neuronal connectivity (2nd ed.). Berlin, Germany: Springer.
    1. Brunel, N., Chance, F. S., Fourcaud, N., & Abbott, L. (2001). Effects of synaptic noise and filtering on the frequency response of spiking neurons. Physical Review Letters, 86(10), 2186. - PubMed
    1. Cardin, J. A., Carlén, M., Meletis, K., Knoblich, U., Zhang, F., Deisseroth, K., … Moore, C. I. (2009). Driving fast-spiking cells induces gamma rhythm and controls sensory responses. Nature, 459(7247), 663–667. - PMC - PubMed

LinkOut - more resources