

NASH-related increases in plasma bile acid levels depend on insulin resistance
- PMID: 33615207
- PMCID: PMC7878982
- DOI: 10.1016/j.jhepr.2020.100222
NASH-related increases in plasma bile acid levels depend on insulin resistance
Erratum in
-
Erratum Regarding Previously Published Articles.JHEP Rep. 2024 May 18;6(6):101097. doi: 10.1016/j.jhepr.2024.101097. eCollection 2024 Jun. JHEP Rep. 2024. PMID: 38978774 Free PMC article.
Abstract
Background & aims: Plasma bile acids (BAs) have been extensively studied as pathophysiological actors in non-alcoholic steatohepatitis (NASH). However, results from clinical studies are often complicated by the association of NASH with type 2 diabetes (T2D), obesity, and insulin resistance (IR). Here, we sought to dissect the relationship between NASH, T2D, and plasma BA levels in a large patient cohort.
Methods: Four groups of patients from the Biological Atlas of Severe Obesity (ABOS) cohort (Clinical Trials number NCT01129297) were included based on the presence or absence of histologically evaluated NASH with or without coincident T2D. Patients were matched for BMI, homeostatic model assessment 2 (HOMA2)-assessed IR, glycated haemoglobin, age, and gender. To study the effect of IR and BMI on the association of plasma BA and NASH, patients from the HEPADIP study were included. In both cohorts, fasting plasma BA concentrations were measured.
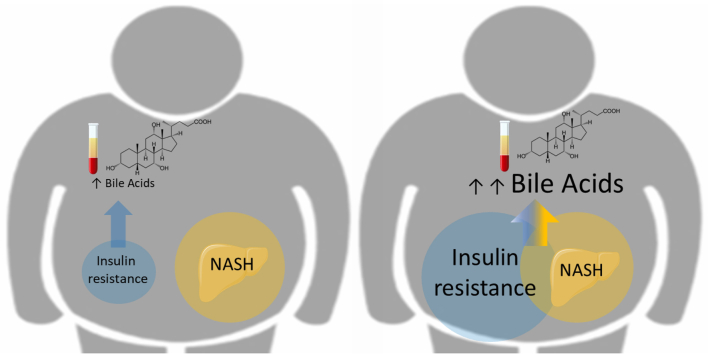
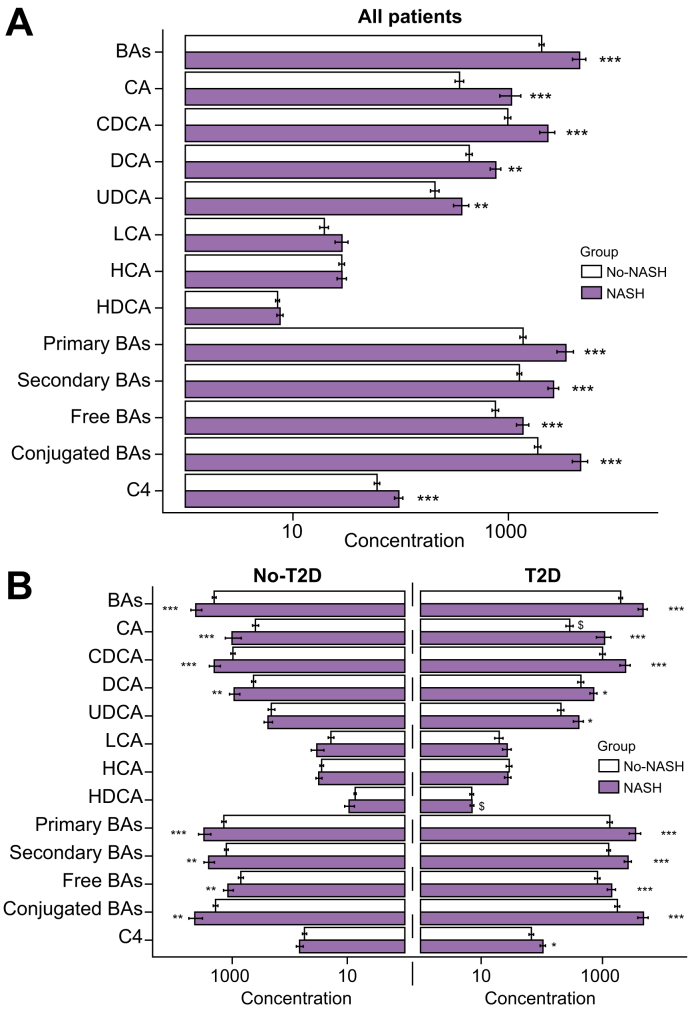
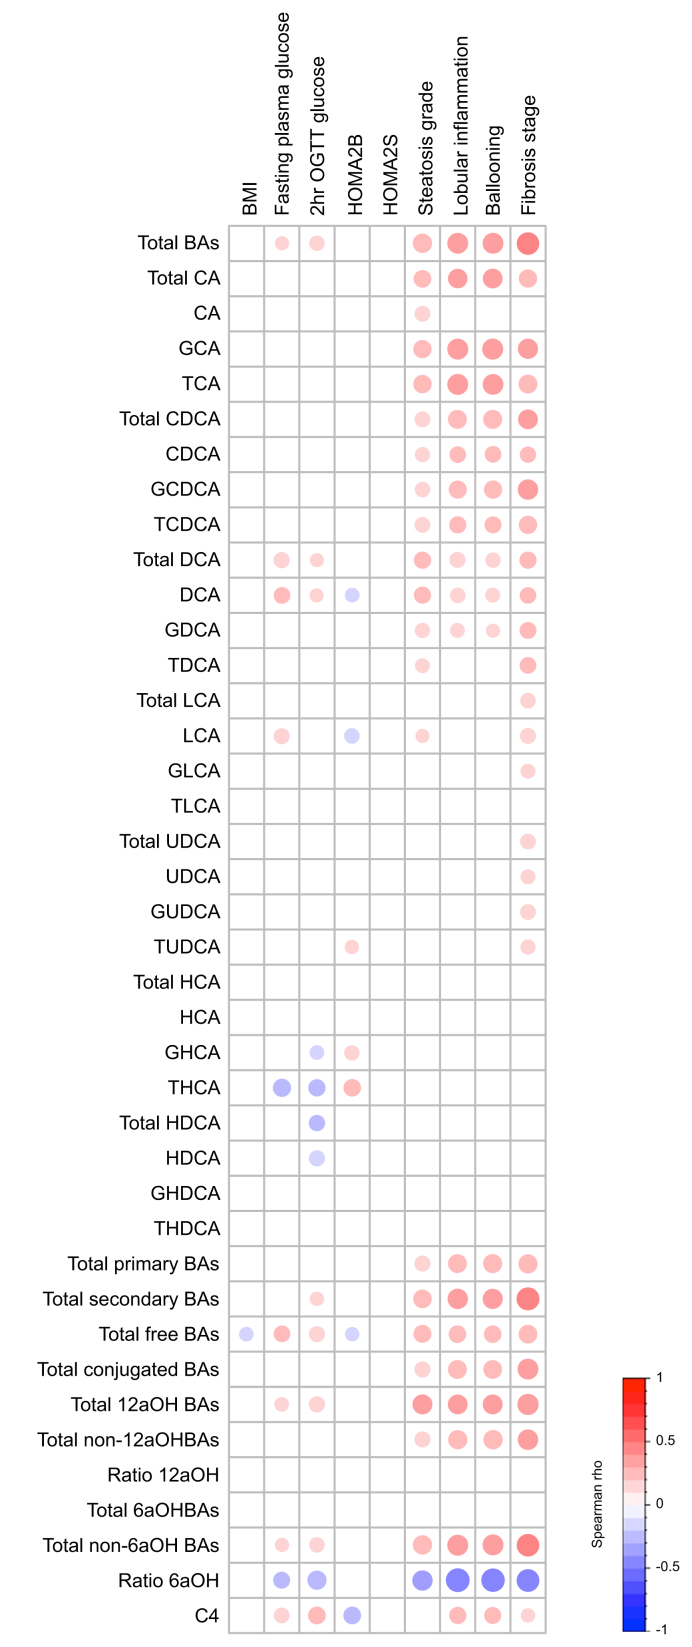
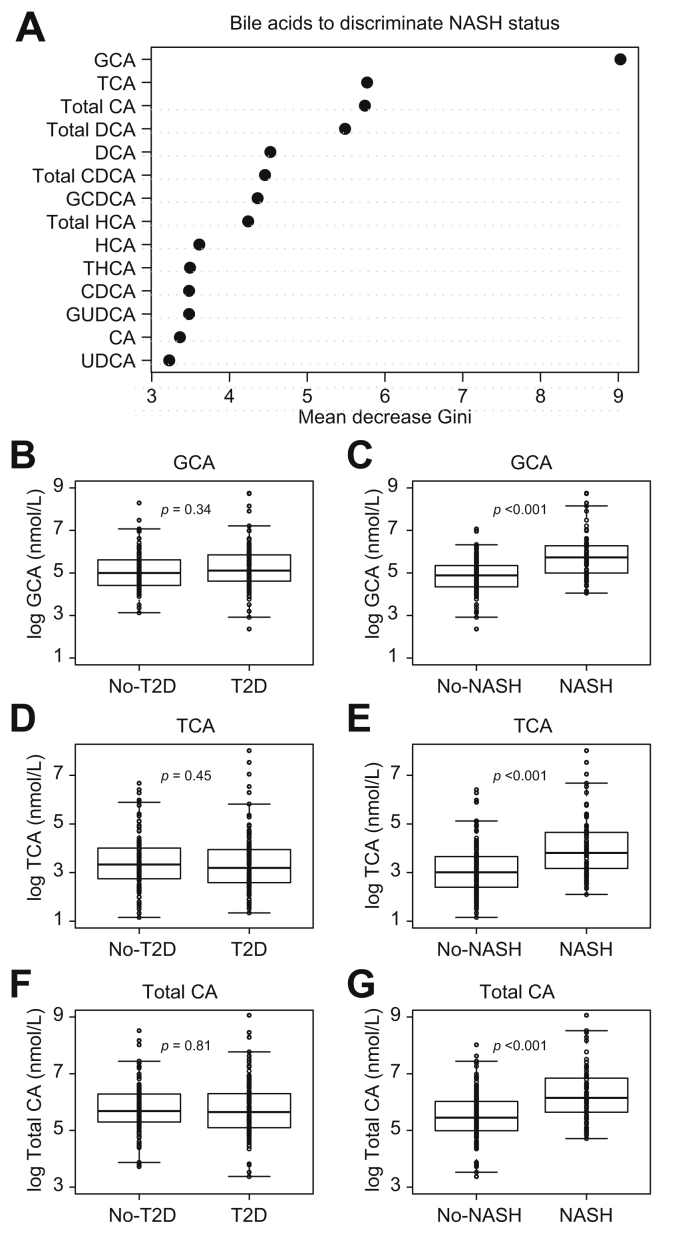
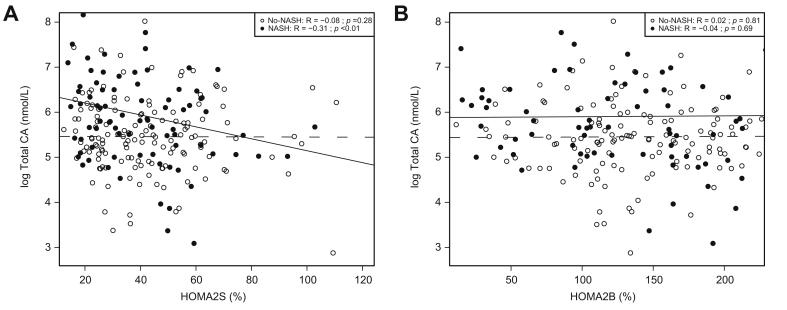
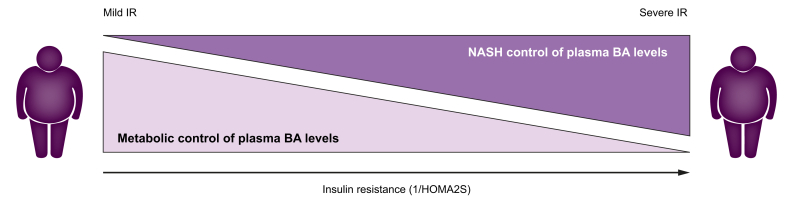
Results: Plasma BA concentrations were higher in NASH compared with No-NASH patients both in T2D and NoT2D patients from the ABOS cohort. As we previously reported that plasma BA levels were unaltered in NASH patients of the HEPADIP cohort, we assessed the impact of BMI and IR on the association of NASH and BA on the combined BA datasets. Our results revealed that NASH-associated increases in plasma total cholic acid (CA) concentrations depend on the degree of HOMA2-assessed systemic IR, but not on β-cell function nor on BMI.
Conclusions: Plasma BA concentrations are elevated only in those NASH patients exhibiting pronounced IR.
Lay summary: Non-alcoholic steatohepatitis (NASH) is a progressive liver disease that frequently occurs in patients with obesity and type 2 diabetes. Reliable markers for the diagnosis of NASH are needed. Plasma bile acids have been proposed as NASH biomarkers. Herein, we found that plasma bile acids are only elevated in patients with NASH when significant insulin resistance is present, limiting their utility as NASH markers.
Keywords: ABOS, Biological Atlas of Severe Obesity; ADA, American Diabetes Association; BA, bile acids; Bile acids; C4, 7alpha-hydroxy-4-cholesten-3-one; CA, cholic acid; CDCA, chenodeoxycholic acid; DCA, deoxycholic acid; Diabetes; FPG, fasting plasma glycaemia; FXR, farnesoid-X-receptor; GCA, glycocholic acid; GCDCA, glycochenodeoxycholic acid; GDCA, glycodeoxycholic acid; GHCA, glycohyocholic acid; GHDCA, glycohyodeoxycholic acid; GLCA, glycolithocholic acid; GUDCA, glycoursodeoxycholic acid; HCA, hyocholic acid; HDCA, hyodeoxycholic acid; HOMA2, homeostatic model assessment 2; HbA1c, glycated haemoglobin; IR, insulin resistance; Insulin resistance; LCA, lithocholic acid; MAFLD, metabolic associated fatty liver disease; NAFL, non-alcoholic fatty liver; NAFLD; NAFLD, non-alcoholic fatty liver disease; NASH; NASH, non-alcoholic steatohepatitis; OGTT, oral glucose tolerance test; Obesity; T2D, type 2 diabetes; TCA, taurocholic acid; TCDCA, taurochenodeoxycholic acid; TDCA, taurodeoxycholic acid; THCA, taurohyocholic acid; THDCA, taurohyodeoxycholic acid; TLCA, taurolithocholic acid; TUDCA, tauroursodeoxycholic acid; Translational study; UDCA, ursodeoxycholic acid.
© 2021 The Authors.
Conflict of interest statement
The authors declare that they have no conflicts of interest that pertain to this work. Please refer to the accompanying ICMJE disclosure forms for further details.
Figures
References
-
- Haas J.T., Francque S., Staels B. Pathophysiology and mechanisms of nonalcoholic fatty liver disease. Annu Rev Physiol. 2016;78:181–205. - PubMed
-
- Stefan N., Häring H.-U., Cusi K. Non-alcoholic fatty liver disease: causes, diagnosis, cardiometabolic consequences, and treatment strategies. Lancet Diabetes Endocrinol. 2019;7:313–324. - PubMed
-
- Eslam M., Sanyal A.J., George J. MAFLD: a consensus-driven proposed nomenclature for metabolic associated fatty liver disease. Gastroenterology. 2020;158:1999–2014. e1. - PubMed
-
- Kuipers F., Bloks V.W., Groen A.K. Beyond intestinal soap – bile acids in metabolic control. Nat Rev Endocrinol. 2014;10:488–498. - PubMed
-
- Chávez-Talavera O., Tailleux A., Lefebvre P., Staels B. Bile acid control of metabolism and inflammation in obesity, type 2 diabetes, dyslipidemia, and nonalcoholic fatty liver disease. Gastroenterology. 2017;152:1679–1694. e3. - PubMed
LinkOut - more resources
Full Text Sources
Other Literature Sources
Research Materials
Miscellaneous
