

COVID-19 antibody seroprevalence in Santa Clara County, California
- PMID: 33615345
- PMCID: PMC7928865
- DOI: 10.1093/ije/dyab010
COVID-19 antibody seroprevalence in Santa Clara County, California
Abstract
Background: Measuring the seroprevalence of antibodies to Severe Acute Respiratory Syndrome Coronavirus 2 (SARS-CoV-2) is central to understanding infection risk and fatality rates. We studied Coronavirus Disease 2019 (COVID-19)-antibody seroprevalence in a community sample drawn from Santa Clara County.
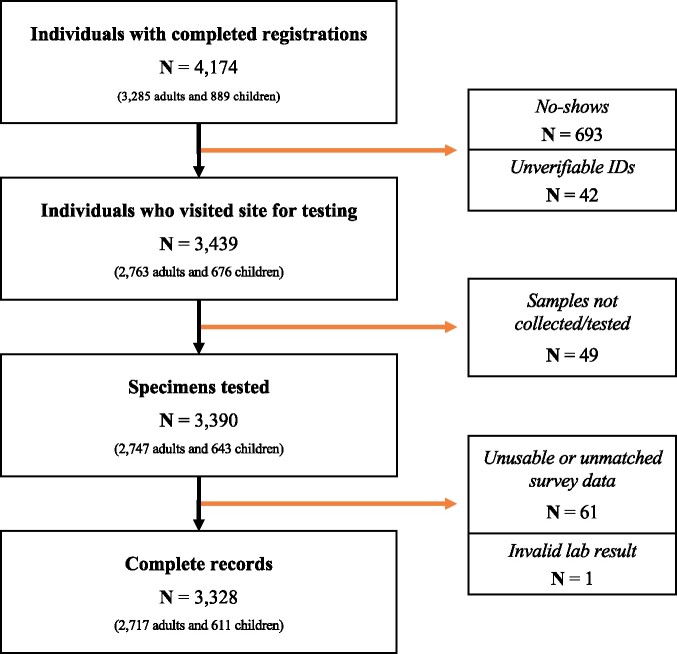
Methods: On 3 and 4 April 2020, we tested 3328 county residents for immunoglobulin G (IgG) and immunoglobulin M (IgM) antibodies to SARS-CoV-2 using a rapid lateral-flow assay (Premier Biotech). Participants were recruited using advertisements that were targeted to reach county residents that matched the county population by gender, race/ethnicity and zip code of residence. We estimate weights to match our sample to the county by zip, age, sex and race/ethnicity. We report the weighted and unweighted prevalence of antibodies to SARS-CoV-2. We adjust for test-performance characteristics by combining data from 18 independent test-kit assessments: 14 for specificity and 4 for sensitivity.
Results: The raw prevalence of antibodies in our sample was 1.5% [exact binomial 95% confidence interval (CI) 1.1-2.0%]. Test-performance specificity in our data was 99.5% (95% CI 99.2-99.7%) and sensitivity was 82.8% (95% CI 76.0-88.4%). The unweighted prevalence adjusted for test-performance characteristics was 1.2% (95% CI 0.7-1.8%). After weighting for population demographics, the prevalence was 2.8% (95% CI 1.3-4.2%), using bootstrap to estimate confidence bounds. These prevalence point estimates imply that 53 000 [95% CI 26 000 to 82 000 using weighted prevalence; 23 000 (95% CI 14 000-35 000) using unweighted prevalence] people were infected in Santa Clara County by late March-many more than the ∼1200 confirmed cases at the time.
Conclusion: The estimated prevalence of SARS-CoV-2 antibodies in Santa Clara County implies that COVID-19 was likely more widespread than indicated by the number of cases in late March, 2020. At the time, low-burden contexts such as Santa Clara County were far from herd-immunity thresholds.
Keywords: COVID-19; infection fatality rate; seroprevalence.
© The Author(s) 2021. Published by Oxford University Press on behalf of the International Epidemiological Association.
Figures
References
-
- Novel Coronavirus Press Archives—Public Health Department—County of Santa Clara. https://www.sccgov.org/sites/phd/DiseaseInformation/novel-coronavirus/Pa...12 April 2020, date last accessed).
-
- Santa Clara County Public Health: COVID-19 Information for Healthcare Providers. https://www.sccgov.org/sites/phd-p/Diseases/novel-coronavirus/Pages/Resp... (23 November 2020, date last accessed).
-
- Report 12—The Global Impact of COVID-19 and Strategies for Mitigation and Suppression. Imperial College London. http://www.imperial.ac.uk/medicine/departments/school-public-health/infe...7 April 2020, date last accessed).
-
- Spychalski P, Błażyńska-Spychalska A, Kobiela J.. Estimating case fatality rates of COVID-19. Lancet Infect Dis 2020:774–775. https://www.thelancet.com/journals/laninf/article/PIIS1473-3099(20)30246... (9 April 2020, date last accessed ). - PMC - PubMed
-
- Onder G, Rezza G, Brusaferro S. Case-fatality rate and characteristics of patients dying in relation to COVID-19 in Italy. JAMA2020;323:1775–1776. https://jamanetwork.com/journals/jama/fullarticle/2763667 (9 April 2020, date last accessed). - PubMed
Publication types
MeSH terms
Substances
LinkOut - more resources
Full Text Sources
Other Literature Sources
Medical
Miscellaneous
