

Patterns of black and white hysterectomy incidence among reproductive aged women
- PMID: 33615466
- PMCID: PMC8522563
- DOI: 10.1111/1475-6773.13633
Patterns of black and white hysterectomy incidence among reproductive aged women
Abstract
Objective: To investigate the intersection of race and economic context in treatment with hysterectomy among reproductive aged women with noncancerous gynecologic conditions.
Data sources: We combined administrative billing records of inpatient and outpatient hysterectomy procedures (N = 28 301) occurring in North Carolina between 2011 and 2014 with census data to calculate county-level hysterectomy rates.
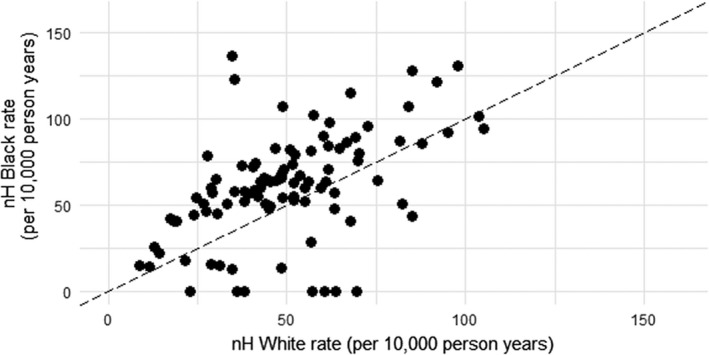
Study design: Spatial analysis techniques examined the distribution of black and white hysterectomy rates across counties, and county-level black and white rate differences were compared across economic contexts.
Data collection/extraction: We restricted to those of premenopausal age identifying as non-Hispanic black or white, undergoing hysterectomy for nonemergent causes (N = 28 301 procedures).
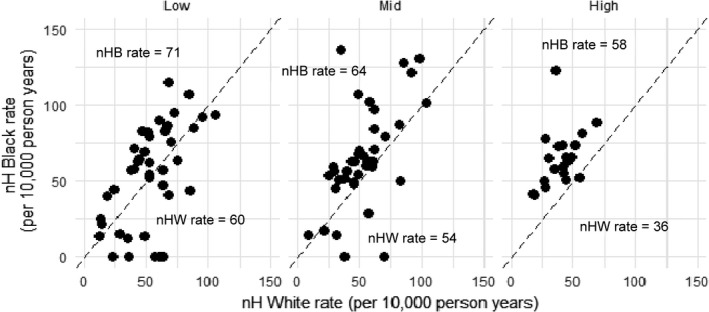
Principal findings: County-level hysterectomy rates were spatially patterned (Moran's I, P < .05) and similarly so for black and white women (LISA, P < .005). The black-white difference in hysterectomy rates was the largest in the high economic tier counties (22/10 000 person-years [PY], P < .05) and smallest in the mid and low economic tier counties (11/10 000 PY, P > .05 and 10/10 000 PY, P > .05, respectively).
Conclusion: Socioeconomic context is important to understand, particularly for black-white disparities in hysterectomy. Efforts should be made to understand the causes of higher rates of hysterectomy among blacks than whites, especially in counties in the highest economic tier.
Keywords: ecological studies; medical geography; obstetrics/gynecology; racial/ethnic differences in health care.
© 2021 Health Research and Educational Trust.
Conflict of interest statement
Authors have no conflicts of interest to declare.
Figures
Similar articles
-
Changing trends in Black-White racial differences in surgical menopause: a population-based study.Am J Obstet Gynecol. 2021 Nov;225(5):502.e1-502.e13. doi: 10.1016/j.ajog.2021.05.045. Epub 2021 Jun 8. Am J Obstet Gynecol. 2021. PMID: 34111405 Free PMC article.
-
For U.S. Black women, shift of hysterectomy to outpatient settings may have lagged behind White women: a claims-based analysis, 2011-2013.BMC Health Serv Res. 2017 Aug 4;17(1):526. doi: 10.1186/s12913-017-2471-1. BMC Health Serv Res. 2017. PMID: 28778163 Free PMC article.
-
Geographic and racial disparities in the quality of surgical care among patients with nonmetastatic uterine cancer.Am J Obstet Gynecol. 2025 Mar;232(3):308.e1-308.e15. doi: 10.1016/j.ajog.2024.09.002. Epub 2024 Sep 7. Am J Obstet Gynecol. 2025. PMID: 39245428
-
Racial/Ethnic Disparities/Differences in Hysterectomy Route in Women Likely Eligible for Minimally Invasive Surgery.J Minim Invasive Gynecol. 2020 Jul-Aug;27(5):1167-1177.e2. doi: 10.1016/j.jmig.2019.09.003. Epub 2019 Sep 10. J Minim Invasive Gynecol. 2020. PMID: 31518712 Free PMC article.
-
Associations of Premenopausal Hysterectomy and Oophorectomy With Breast Cancer Among Black and White Women: The Carolina Breast Cancer Study, 1993-2001.Am J Epidemiol. 2016 Sep 1;184(5):388-99. doi: 10.1093/aje/kwv448. Epub 2016 Aug 23. Am J Epidemiol. 2016. PMID: 27555487 Free PMC article.
Cited by
-
Predictive model for postpartum hemorrhage requiring hysterectomy in a minority ethnic region.World J Clin Cases. 2024 Aug 6;12(22):4865-4872. doi: 10.12998/wjcc.v12.i22.4865. World J Clin Cases. 2024. PMID: 39109042 Free PMC article.
-
Hysterectomy With and Without Oophorectomy, Tubal Ligation, and Risk of Cardiovascular Disease in the Nurses' Health Study II.J Womens Health (Larchmt). 2023 Jul;32(7):747-756. doi: 10.1089/jwh.2022.0207. Epub 2023 May 8. J Womens Health (Larchmt). 2023. PMID: 37155739 Free PMC article.
-
Education level is associated with the occurrence and timing of hysterectomy: A cohort study of Canadian women.Acta Obstet Gynecol Scand. 2024 Nov;103(11):2211-2220. doi: 10.1111/aogs.14959. Epub 2024 Sep 2. Acta Obstet Gynecol Scand. 2024. PMID: 39223035 Free PMC article.
-
The relationship between socioeconomic status and perinatal outcomes in in vitro fertilization conceptions.AJOG Glob Rep. 2024 Feb 23;4(2):100329. doi: 10.1016/j.xagr.2024.100329. eCollection 2024 May. AJOG Glob Rep. 2024. PMID: 38919707 Free PMC article.
-
Analysis of the Relationship between Socioeconomic Status and Incidence of Hysterectomy Using Data of the Korean Genome and Epidemiology Study (KoGES).Healthcare (Basel). 2022 May 27;10(6):997. doi: 10.3390/healthcare10060997. Healthcare (Basel). 2022. PMID: 35742048 Free PMC article.
References
-
- National Center for Health Statistics . Discharges with at least one procedure in nonfederal short‐stay hospitals, by sex, age, and selected procedures: United States, selected years 1990 through 2009–2010. CDC; 2015: Table 90. http://www.cdc.gov/nchs/hus/contents2014.htm#090. Accessed June 9, 2016.
-
- Priya P, Roach EJ. Effect of pre‐operative instruction on anxiety among women undergoing abdominal hysterectomy. Nurs J India. 2013;104(6):245‐248. - PubMed
Publication types
MeSH terms
Grants and funding
LinkOut - more resources
Full Text Sources
Other Literature Sources
Medical
