

The low molecular weight protein tyrosine phosphatase promotes adipogenesis and subcutaneous adipocyte hypertrophy
- PMID: 33615467
- PMCID: PMC8222063
- DOI: 10.1002/jcp.30307
The low molecular weight protein tyrosine phosphatase promotes adipogenesis and subcutaneous adipocyte hypertrophy
Abstract
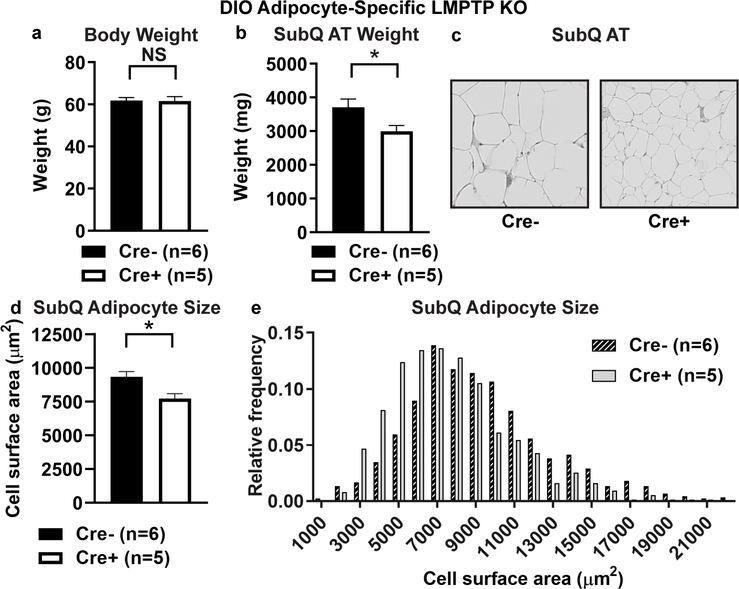
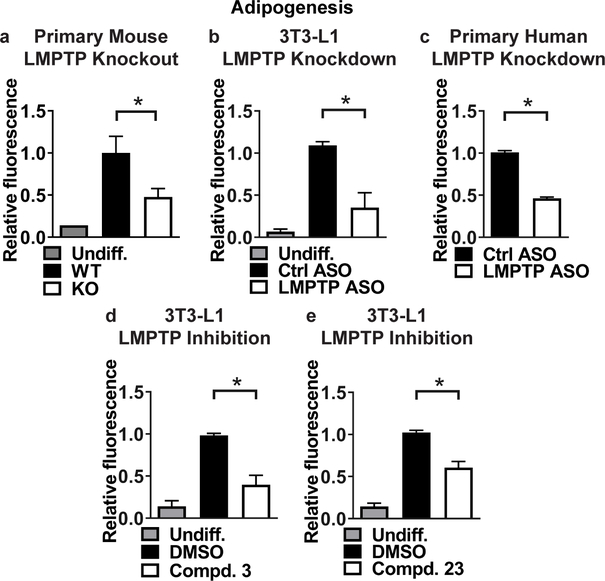
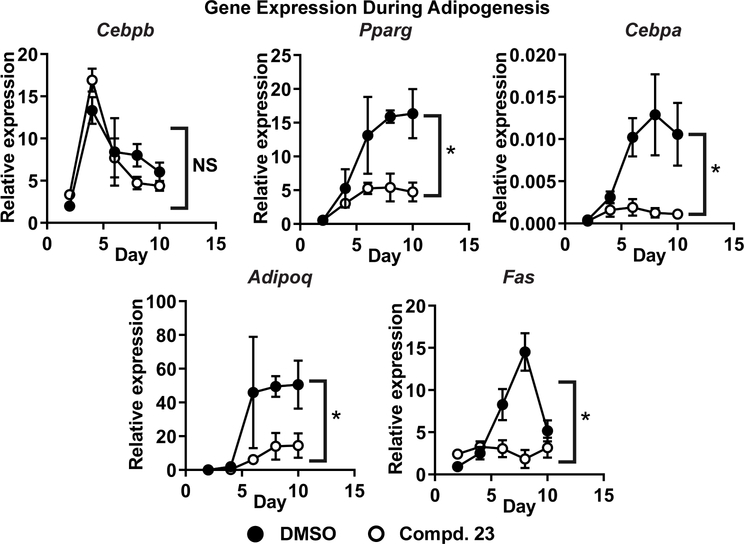
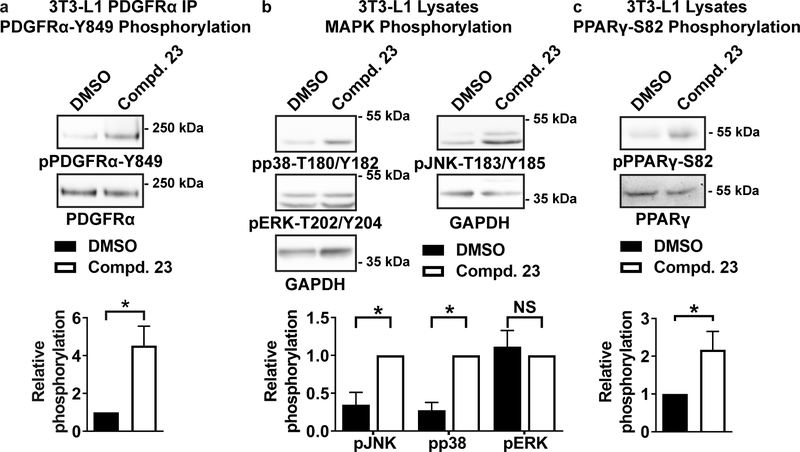
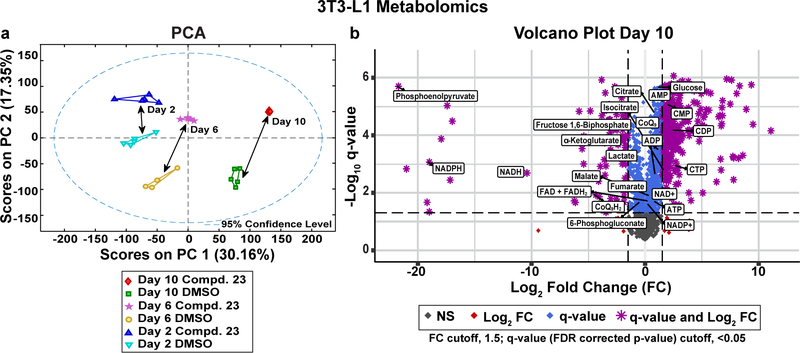
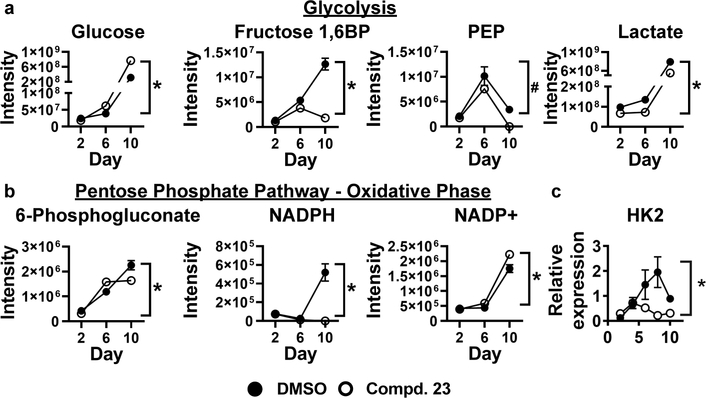
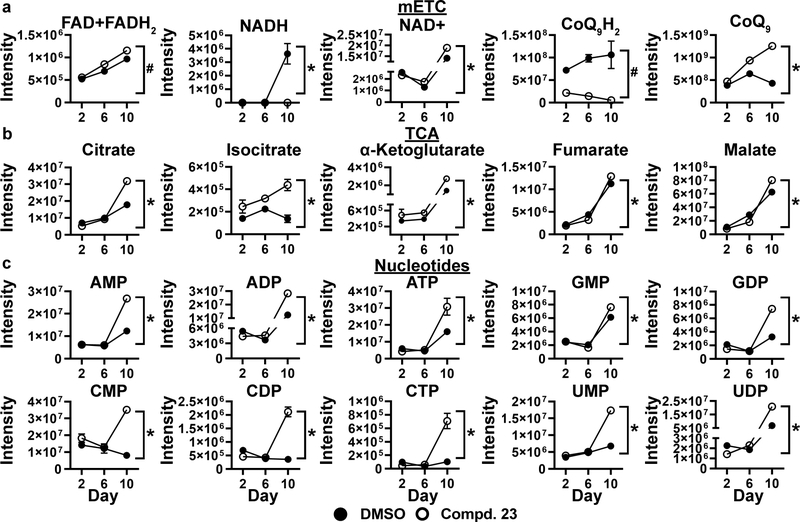
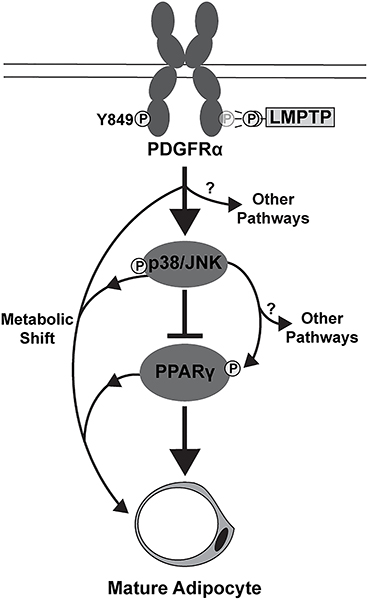
Obesity is a major contributing factor to the pathogenesis of Type 2 diabetes. Multiple human genetics studies suggest that high activity of the low molecular weight protein tyrosine phosphatase (LMPTP) promotes metabolic syndrome in obesity. We reported that LMPTP is a critical promoter of insulin resistance in obesity by regulating liver insulin receptor signaling and that inhibition of LMPTP reverses obesity-associated diabetes in mice. Since LMPTP is expressed in adipose tissue but little is known about its function, here we examined the role of LMPTP in adipocyte biology. Using conditional knockout mice, we found that selective deletion of LMPTP in adipocytes impaired obesity-induced subcutaneous adipocyte hypertrophy. We assessed the role of LMPTP in adipogenesis in vitro, and found that LMPTP deletion or knockdown substantially impaired differentiation of primary preadipocytes and 3T3-L1 cells into adipocytes, respectively. Inhibition of LMPTP in 3T3-L1 preadipocytes also reduced adipogenesis and expression of proadipogenic transcription factors peroxisome proliferator activated receptor gamma (PPARγ) and CCAAT/enhancer-binding protein alpha. Inhibition of LMPTP increased basal phosphorylation of platelet-derived growth factor receptor alpha (PDGFRα) on activation motif residue Y849 in 3T3-L1, resulting in increased activation of the mitogen-associated protein kinases p38 and c-Jun N-terminal kinase and increased PPARγ phosphorylation on inhibitory residue S82. Analysis of the metabolome of differentiating 3T3-L1 cells suggested that LMPTP inhibition decreased cell glucose utilization while enhancing mitochondrial respiration and nucleotide synthesis. In summary, we report a novel role for LMPTP as a key driver of adipocyte differentiation via control of PDGFRα signaling.
Keywords: LMPTP; adipocyte; adipogenesis; phosphorylation; protein tyrosine phosphatase.
© 2021 Wiley Periodicals LLC.
Conflict of interest statement
Conflict of interest statement
N.B. and S.M.S. have a financial interest in Nerio Therapeutics, Inc. Although these authors deem the present publication not to be relevant to the activities at Nerio Therapeutics, Inc, reporting of personal financial interests requires disclosure of this relationship.
Figures
Similar articles
-
Coprinus comatus cap inhibits adipocyte differentiation via regulation of PPARγ and Akt signaling pathway.PLoS One. 2014 Sep 2;9(9):e105809. doi: 10.1371/journal.pone.0105809. eCollection 2014. PLoS One. 2014. PMID: 25181477 Free PMC article.
-
Saikosaponin A and D Inhibit Adipogenesis via the AMPK and MAPK Signaling Pathways in 3T3-L1 Adipocytes.Int J Mol Sci. 2021 Oct 22;22(21):11409. doi: 10.3390/ijms222111409. Int J Mol Sci. 2021. PMID: 34768840 Free PMC article.
-
Blueberry peel extracts inhibit adipogenesis in 3T3-L1 cells and reduce high-fat diet-induced obesity.PLoS One. 2013 Jul 25;8(7):e69925. doi: 10.1371/journal.pone.0069925. Print 2013. PLoS One. 2013. PMID: 23936120 Free PMC article.
-
MicroRNAs as Epigenetic Regulators of Obesity.Adv Exp Med Biol. 2024;1460:595-627. doi: 10.1007/978-3-031-63657-8_20. Adv Exp Med Biol. 2024. PMID: 39287866 Review.
-
Adipogenesis and lipotoxicity: role of peroxisome proliferator-activated receptor gamma (PPARgamma) and PPARgammacoactivator-1 (PGC1).Public Health Nutr. 2007 Oct;10(10A):1132-7. doi: 10.1017/S1368980007000614. Public Health Nutr. 2007. PMID: 17903321 Review.
Cited by
-
Complex I inhibitor of oxidative phosphorylation in advanced solid tumors and acute myeloid leukemia: phase I trials.Nat Med. 2023 Jan;29(1):115-126. doi: 10.1038/s41591-022-02103-8. Epub 2023 Jan 19. Nat Med. 2023. PMID: 36658425 Free PMC article. Clinical Trial.
-
Virtual Screening and Biological Evaluation of Novel Low Molecular Weight Protein Tyrosine Phosphatase Inhibitor for the Treatment of Insulin Resistance.Drug Des Devel Ther. 2023 Apr 21;17:1191-1201. doi: 10.2147/DDDT.S406956. eCollection 2023. Drug Des Devel Ther. 2023. PMID: 37113468 Free PMC article.
-
Glutaminase inhibition in combination with azacytidine in myelodysplastic syndromes: a phase 1b/2 clinical trial and correlative analyses.Nat Cancer. 2024 Oct;5(10):1515-1533. doi: 10.1038/s43018-024-00811-3. Epub 2024 Sep 19. Nat Cancer. 2024. PMID: 39300320 Clinical Trial.
-
Exploration of the intracellular chiral metabolome in pediatric BCP-ALL: a pilot study investigating the metabolic phenotype of IgH locus aberrations.Front Oncol. 2024 Aug 5;14:1413264. doi: 10.3389/fonc.2024.1413264. eCollection 2024. Front Oncol. 2024. PMID: 39161381 Free PMC article.
-
Combined effects of genetic background and diet on mouse metabolism and gene expression.iScience. 2024 Nov 4;27(12):111323. doi: 10.1016/j.isci.2024.111323. eCollection 2024 Dec 20. iScience. 2024. PMID: 39640571 Free PMC article.
References
Publication types
MeSH terms
Substances
Grants and funding
LinkOut - more resources
Full Text Sources
Other Literature Sources
Molecular Biology Databases
Research Materials
Miscellaneous
