Enhanced Live-Cell Delivery of Synthetic Proteins Assisted by Cell-Penetrating Peptides Fused to DABCYL
- PMID: 33615660
- PMCID: PMC8048964
- DOI: 10.1002/anie.202016208
Enhanced Live-Cell Delivery of Synthetic Proteins Assisted by Cell-Penetrating Peptides Fused to DABCYL
Abstract
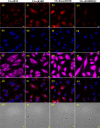
Live-cell delivery of a fully synthetic protein having selectivity towards a particular target is a promising approach with potential applications for basic research and therapeutics. Cell-penetrating peptides (CPPs) allow the cellular delivery of proteins but mostly result in endosomal entrapment, leading to lack of bioavailability. Herein, we report the design and synthesis of a CPP fused to 4-((4-(dimethylamino)phenyl)azo)benzoic acid (DABCYL) to enhance cellular uptake of fluorescently labelled synthetic protein analogues in low micromolar concentration. The attachment of cyclic deca-arginine (cR10) modified with a single lysine linked to DABCYL to synthetic ubiquitin (Ub) and small ubiquitin-like modifier-2 (SUMO-2) scaffolds resulted in a threefold higher uptake efficacy in live cells compared to the unmodified cR10. We could also achieve cR10DABCYL-assisted delivery of Ub and a Ub variant (Ubv) based activity-based probes for functional studies of deubiquitinases in live cells.
Keywords: activity-based probes; cell-penetrating peptides; fluorescence; small ubiquitin like modifier (SUMO); ubiquitin.
© 2021 The Authors. Angewandte Chemie International Edition published by Wiley-VCH GmbH.
Conflict of interest statement
The authors declare no conflict of interest.
Figures


Comment in
-
Chemical passports to cross biological borders.Nat Chem. 2021 Jun;13(6):517-519. doi: 10.1038/s41557-021-00694-2. Nat Chem. 2021. PMID: 34075215 No abstract available.
Similar articles
-
Structure-Uptake Relationship Study of DABCYL Derivatives Linked to Cyclic Cell-Penetrating Peptides for Live-Cell Delivery of Synthetic Proteins.Angew Chem Int Ed Engl. 2022 Nov 21;61(47):e202207551. doi: 10.1002/anie.202207551. Epub 2022 Oct 19. Angew Chem Int Ed Engl. 2022. PMID: 36004945 Free PMC article.
-
Enhanced Delivery of Synthetic Labelled Ubiquitin into Live Cells by Using Next-Generation Ub-TAT Conjugates.Chembiochem. 2018 Dec 18;19(24):2553-2557. doi: 10.1002/cbic.201800649. Epub 2018 Nov 27. Chembiochem. 2018. PMID: 30351505
-
Influence of the Dabcyl group on the cellular uptake of cationic peptides: short oligoarginines as efficient cell-penetrating peptides.Amino Acids. 2021 Jul;53(7):1033-1049. doi: 10.1007/s00726-021-03003-w. Epub 2021 May 25. Amino Acids. 2021. PMID: 34032919 Free PMC article.
-
SUMO and ubiquitin paths converge.Biochem Soc Trans. 2010 Feb;38(Pt 1):34-9. doi: 10.1042/BST0380034. Biochem Soc Trans. 2010. PMID: 20074031 Review.
-
Studies of biochemical crosstalk in chromatin with semisynthetic histones.Curr Opin Chem Biol. 2018 Aug;45:27-34. doi: 10.1016/j.cbpa.2018.02.005. Epub 2018 Feb 27. Curr Opin Chem Biol. 2018. PMID: 29494828 Free PMC article. Review.
Cited by
-
Rational Development and Characterization of a Ubiquitin Variant with Selectivity for Ubiquitin C-Terminal Hydrolase L3.Biomolecules. 2022 Jan 1;12(1):62. doi: 10.3390/biom12010062. Biomolecules. 2022. PMID: 35053210 Free PMC article.
-
Nanocarriers for intracellular delivery of proteins in biomedical applications: strategies and recent advances.J Nanobiotechnology. 2024 Nov 10;22(1):688. doi: 10.1186/s12951-024-02969-5. J Nanobiotechnology. 2024. PMID: 39523313 Free PMC article. Review.
-
Overcoming the cellular barriers and beyond: Recent progress on cell penetrating peptide modified nanomedicine in combating physiological and pathological barriers.Asian J Pharm Sci. 2022 Jul;17(4):523-543. doi: 10.1016/j.ajps.2022.05.002. Epub 2022 Jun 23. Asian J Pharm Sci. 2022. PMID: 36105313 Free PMC article. Review.
-
Cell-Surface-Retained Peptide Additives for the Cytosolic Delivery of Functional Proteins.J Am Chem Soc. 2023 Oct 31;145(45):24535-48. doi: 10.1021/jacs.3c05365. Online ahead of print. J Am Chem Soc. 2023. PMID: 37906525 Free PMC article.
-
Redesigning of Cell-Penetrating Peptides to Improve Their Efficacy as a Drug Delivery System.Pharmaceutics. 2022 Apr 21;14(5):907. doi: 10.3390/pharmaceutics14050907. Pharmaceutics. 2022. PMID: 35631493 Free PMC article. Review.
References
Publication types
MeSH terms
Substances
LinkOut - more resources
Full Text Sources
Other Literature Sources

