. 2021 Feb 22;6(4):e145199.
doi: 10.1172/jci.insight.145199.

B cells modulate mouse allergen-specific T cells in nonallergic laboratory animal-care workers

Affiliations

B cells modulate mouse allergen-specific T cells in nonallergic laboratory animal-care workers

Esther Dawen Yu et al. JCI Insight. .

Abstract

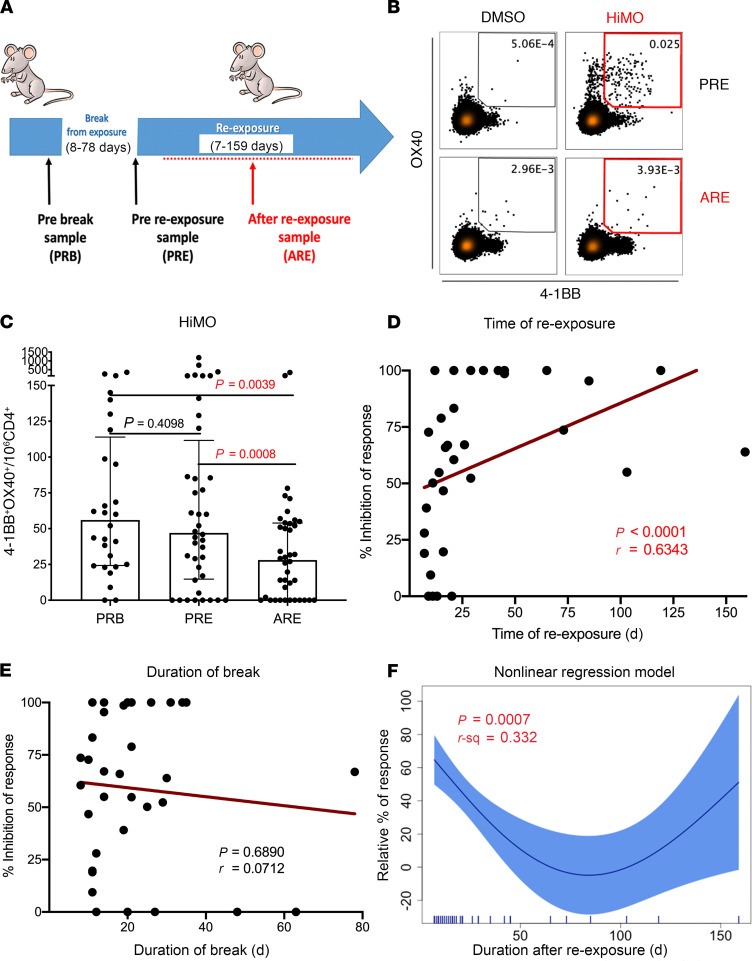
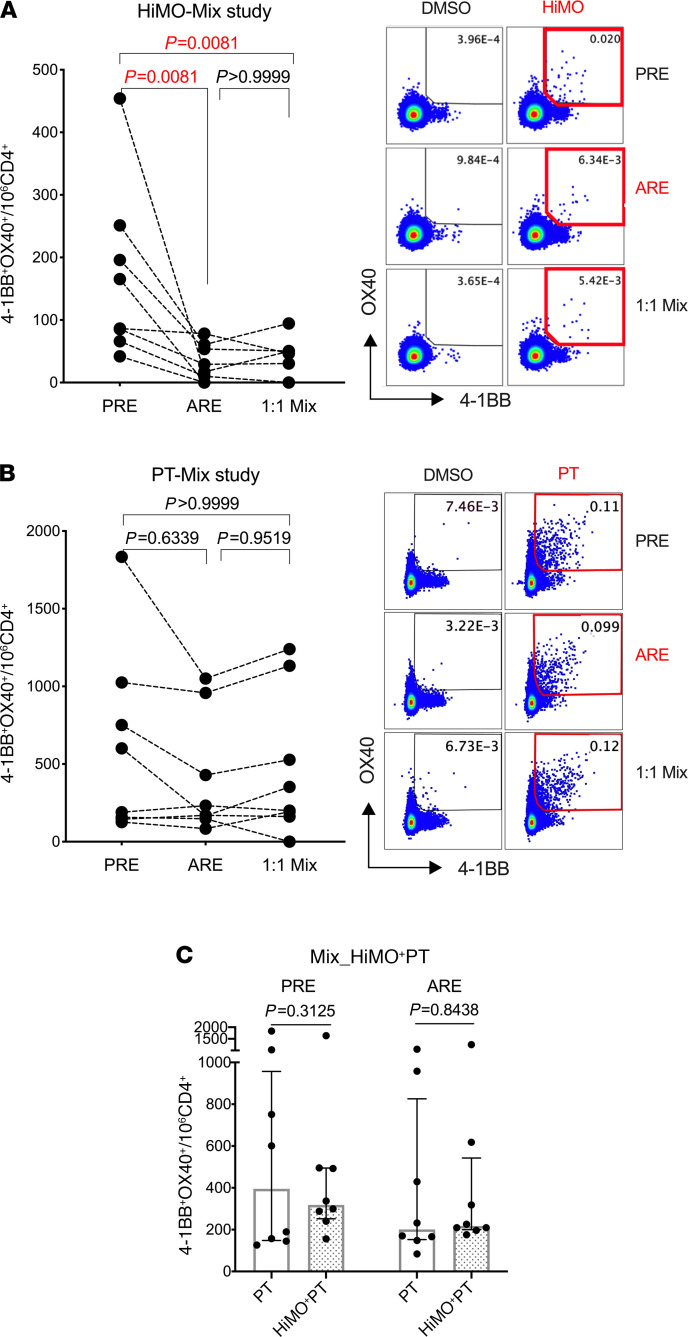
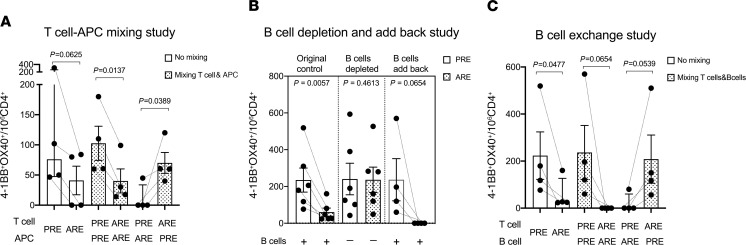
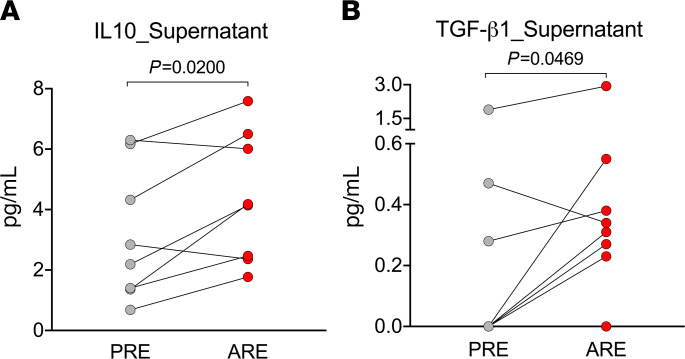
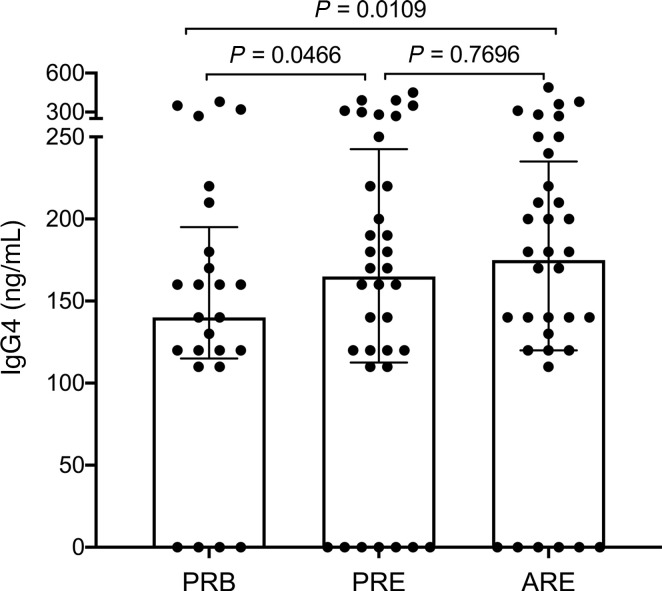
Understanding the mechanisms of allergen-specific immune modulation in nonallergic individuals is key to recapitulate immune tolerance and to develop novel allergy treatments. Herein, we characterized mouse-specific T cell responses in nonallergic laboratory animal-care workers before and after reexposure to mice. PBMCs were collected and stimulated with developed peptide pools identified from high-molecular-weight fractions of mouse allergen extracts. Sizable CD4 T cell responses were noted and were temporarily decreased in most subjects upon reexposure, with the magnitude of decrease positively correlated with time of reexposure but not the duration of the break. Interestingly, the suppression was specific to mouse allergens without affecting responses of bystander antigens. Further, PBMC fractioning studies illustrated that the modulation is unlikely from T cells, while B cell depletion and exchange reversed the suppression of responses, suggesting that B cells may be the key modulators. Increased levels of regulatory cytokines (IL-10 and TGF-β1) in the cell culture supernatant and plasma mouse-specific IgG4 were also observed after reexposure, consistent with B cell-mediated modulation mechanisms. Overall, these results suggest that nonallergic status is achieved by an active, time-related, allergen-specific, B cell-dependent regulatory process upon reexposure, the mechanisms of which should be detailed by further molecular studies.

Keywords: Allergy; Antigen; Immunology; T cells.


Conflict of interest statement

Conflict of interest: The authors have declared that no conflict of interest exists.

Figures

Figure 1
Figure 1. Longitudinal study on exposed nonallergic mouse laboratory workers.
(A) Diagram illustrating the study design of the mouse longitudinal study. Blood samples were collected at 3 time points: pre-break (PRB), after break but pre-reexposure (PRE), and after reexposure (ARE) to mouse. (B and C) Decrease in CD4 T cell responses in nonallergic subjects after reexposure to mouse. Differences in T cell reactivity of 3 groups were detected using AIM assay (C, n = 36). AIM+ signals (4-1BB+OX40+) are represented by numbers per million of CD4 T cells. Data are plotted as median with interquartile range. Statistical analysis was performed by Wilcoxon’s test for paired comparison, with Bonferroni correction for multiple comparison. Time relationship of magnitude of T cell response inhibition was investigated with time of reexposure (D) and duration of break (E) using Spearman’s correlation test (n = 36). Percentage of inhibition = (1 – [ARE response]/[PRE response ]) × 100. (F) Plot of a nonlinear regression model based on cross-sectional data (n = 36) showing a trend of dynamic changes of CD4 T cell responses ARE. Relative percentage of response = (ARE response/PRE response) × 100. Nonlinear generalized additive model was performed using the mgcv package for R.
Figure 2
Figure 2. Before/after reexposure cell-mixing study.
(A and B) Coculture of longitudinal samples (pre-break [PRB] and after reexposure [ARE], mixed in a 1:1 ratio, n = 8) stimulated by mouse (HiMO) and pertussis (PT) antigens. T cell responses of PRE, ARE, and mixed cultures were detected by AIM assay. AIM+ signals (4-1BB+ OX40+) are represented by numbers per million of CD4 T cells. Comparisons among the 3 groups are shown to the left, and flow cytometry images are shown to the rig+ht. Statistical analysis was performed by Friedman’s test corrected for multiple comparison with Dunn’s test. (C) Cell cultures were stimulated with PT alone and PT mixed with mouse antigens simultaneously (n = 8). T cell responses of PT alone and PT+HiMO were compared with Wilcoxon’s test (2-tailed). Data are plotted as median with interquartile range.
Figure 3
Figure 3. Characterizing the key regulatory cell population.
(A) T cell–APC mixing study (n = 4). T cell responses from pre-break (PRB) samples and after reexposure (ARE) samples without mixing are shown (white) as control. T cells and APCs were separated from samples of both visits and mixed with each other. T cell responses from all 4 mixing combination samples are shown (shaded bar). (B) B cell depletion and add-back study. PRE samples are shown in white and ARE samples are represented by shaded bars. T cell responses from original PRE and ARE samples without B cell depletion are shown on the left as controls (n = 6). The T cell response of the same 6 samples after B cell depletion are shown in the middle. Four subjects had their B cells depleted first and then added back to the original samples; those T cell responses are shown on the right. (C) B cell exchange study (n = 4). T cell responses from the original PRE samples and ARE samples are shown in white as control. The shaded bars represent T cell responses from samples with B cells separated first, and then either added back to the original samples (middle) or exchanged between PRE and ARE samples (right). Antigen-specific T cell responses with positive AIM signals (4-1BB+OX40+) are represented by numbers per million of CD4 T cells. Normality of distribution was accessed by Shapiro-Wilk test. Statistical analysis of nonparametric data was performed by Wilcoxon’s test (1-tailed), and statistical analysis of parametric data was performed by paired Student’s t test (1-tailed). Data are plotted as median with interquartile range for nonparametric data and mean ± SEM for parametric data.
Figure 4
Figure 4. Increased regulatory cytokine production in cell culture supernatant of ARE PBMCs stimulated with mouse allergens.
(A) IL-10 responses elicited by HiMO in supernatant of a 24-hour stimulation assay in PRE (gray) and ARE (red) PBMC samples (n = 8). Six of eight subjects had increased IL-10 production in ARE samples. (B) TGF-β1 responses elicited by HiMO in supernatant of a 24-hour stimulation assay in PRE (gray) and ARE (red) PBMC samples (n = 8). Six of eight subjects had increased TGF-β1 production in ARE samples. Statistical analysis was performed by Wilcoxon’s test (2-tailed).
Figure 5
Figure 5. Increased plasma levels of mouse-specific IgG4 observed in the longitudinal study.
Plasma levels of mouse-specific IgG4 in laboratory animal-care workers enrolled in the longitudinal study at 3 different visits: PRB, PRE, and ARE (n = 36, 11 subjects did not have plasma samples saved at the PRB visit). Data are plotted as mean ± SEM. Statistical analysis was performed by mixed-effects analysis with Tukey’s test corrected for multiple comparisons.

Similar articles

Cited by

References

    1. Reynolds LA, Finlay BB. Early life factors that affect allergy development. Nat Rev Immunol. 2017;17(8):518–528. doi: 10.1038/nri.2017.39. - DOI - PubMed
    1. Phipatanakul W, et al. Mouse allergen. I. The prevalence of mouse allergen in inner-city homes. The National Cooperative Inner-City Asthma Study. J Allergy Clin Immunol. 2000;106(6):1070–1074. doi: 10.1067/mai.2000.110796. - DOI - PubMed
    1. Bryant DH, et al. Allergy to laboratory animals among animal handlers. Med J Aust. 1995;163(8):415–418. doi: 10.5694/j.1326-5377.1995.tb124657.x. - DOI - PubMed
    1. Bush RK, et al. Laboratory animal allergy. J Allergy Clin Immunol. 1998;102(1):99–112. doi: 10.1016/S0091-6749(98)70060-0. - DOI - PubMed
    1. Devillier P, et al. Allergen immunotherapy: what is the added value of real-world evidence from retrospective claims database studies? Expert Rev Respir Med. 2020;14(5):445–452. doi: 10.1080/17476348.2020.1733417. - DOI - PubMed

Publication types